Finance Dashboard
Revolutionize Your Financial Management with Our Modern and Interactive Finance Dashboard Power BI.
Intuitive Design, Easy-to-Use Interface and Highly Informative Visualizations to Empower Better Decision-Making with Finance Analytics Dashboard.
Experience Live Interaction With Our Finance Dashboard.
Build Your Custom
Finance Dashboard with us
Get your personalized dashboard for finance tailored to your business
needs and ready to deliver valuable insights.
Simplify Your Financial Management With Our Finance Dashboard.
Say goodbye to manual spreadsheets and hello to real-time power bi finance dashboard template and cost-saving opportunities.


Front Page Finance Dashboard
The Front Page of our Power BI Finance Dashboard template is the gateway to your data insights, and having navigation buttons can help users quickly and easily access different sections of your financial reporting Power BI.
The navigation buttons are typically placed at the top of the title page and are designed to be intuitive and user-friendly. These buttons can be used to jump to different pages within the financial dashboard Power BI.
Finance Overview
The Finance Overview offers a comprehensive view of the company’s financial performance, providing key information about growth with finance dashboard sample.
This focuses on five KPI metrics; including Revenue, COGS, Gross Profit, Expenses, and Net Profit. It provides a concise overview of Revenue Performance, Top Expense and Revenue Accounts, and Working Capital. These metrics offer daily analysis of the company’s financial health and enable stakeholders to make informed decisions to drive growth.


Last Year Analysis
The Last Year Analysis provides a comprehensive comparison of the company’s growth and current financial standing with the previous year.
It focuses on five KPIs including Revenue, COGS, Gross Profit, Expenses, and Net Profit. It presents a comparative view of Revenue by Month and Year-to-Date (YTD), Top 5 Expense Accounts, and Net Profit Analysis, enabling a deeper understanding of the company’s financial performance.
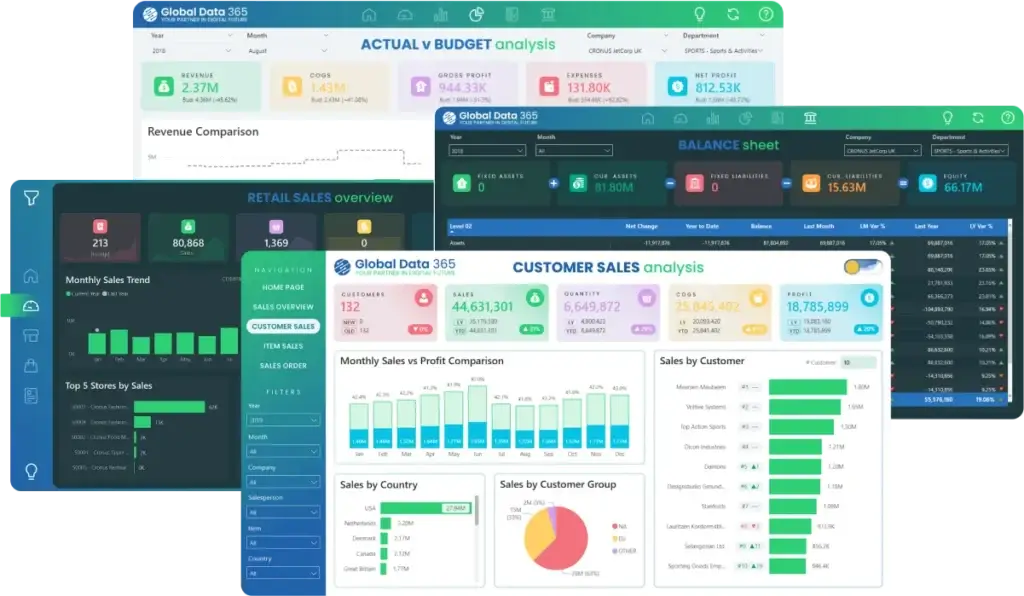
Actual Vs Budget Analysis
The Actual vs Budget Analysis helps evaluating a company’s financial performance by comparing its growth and current financial standing with its budgeted goals.
It focuses on five KPIs including Revenue, COGS, Gross Profit, Expenses, and Net Profit. It presents a Month-by-Month Actual vs Budget Comparison of Revenue and Expenses, providing a clear and concise view of the company’s financial performance. It also displays the variance and variance %, enabling stakeholders to better understand the differences between actual results and budgeted goals.


Income Statement
The Income Statement dashboard power bi provides a comprehensive view of a company’s profitability.
This report focuses on five KPIs including Revenue, COGS, Gross Profit, Expenses, and Net Profit. It presents a complete income statement, including YTD, Actual vs Budget comparison, and comparison with the previous month and year. These valuable insights offer stakeholders a lucid and concise outlook of the organization’s fiscal performance, enabling them to make well-informed decisions that promote profitability with financial Power BI dashboard.
Balance Sheet
The Balance Sheet helps evaluating a company’s financial position and book value. This report focuses on five KPIs including Fixed Assets, Current Assets, Fixed Liabilities, Current Liabilities, and Equity.
It presents a complete balance sheet statement, including Net Change, YTD, Balance, and comparison with the previous month and year. These insights offer a clear and concise view of the company’s financial position, enabling stakeholders to make informed decisions to drive growth and profitability with balance sheet dashboard.


Get expert help to build your dashboard
Our Data Analysts work with hundreds of companies across all industries including retail, manufacturing, technology, healthcare, marketing services, and more.
More than 50+ companies trusted us to implement Power BI and transform their data into powerful insights


FAQs on Finance Dashboard
The cost of the finance power bi dashboard is tailored to your specific requirement and customization needs. Please contact our sales team for more information.
Yes, the finance dashboard's theme is fully customizable. You can personalize colors, fonts, and layouts to align with your brand identity, ensuring a perfect look.
Yes, the finance dashboard power bi can be connected to a wide range of financial systems. It supports multiple connectors and APIs to ensure seamless data integration from various sources, enhancing your financial analysis and reporting capabilities.
Currently, there is not a mobile version of this dashboard for finance. However, we can develop a customized mobile version upon request as per the provided power bi finance dashboard sample.
Yes, you can fully customize the KPIs and charts in your personal finance dashboard. Select from a variety of metrics, configure data visualization and create personalized reports.
The implementation timeline varies based on specific requirements and the number of pages. Typically, it can range from 3 to 10 days.
What Our Customers Has to Say About Us
It was a genuine pleasure working with Global Data 365. They consistently demonstrated patience, professionalism, and attentiveness to my requirements. Their expertise in Power BI is impressive; they quickly comprehends the concepts I aim to communicate and promptly provides effective solutions.

Rana Yaseen
Accounting Manager - Boston Scientific
Our finance dashboard from Global Data 365 has revolutionized the way we manage our finances, providing real-time insights that enable us to make informed decisions and drive business growth. The team was responsive and attentive throughout the design process, and we highly recommend their services.

Cesco Righetti
CFO - The Arts Club
Working with Global Data 365 has been a fantastic experience. Their Power BI reports have completely transformed how we analyze and use our data. The insights are clear, actionable, and have made decision-making so much easier for our team.

Tres Nelson
Manager BI - Signature Systems
Thanks to Global Data 365 for their outstanding Power BI service. We are grateful for the opportunity to work with Global Data 365’s team of talented and committed individuals

Mohammad Arshad
Financial Control & Reporting Assistant Manager - PepsiCo
We are incredibly impressed with the sales dashboard designed for us on Power BI by Global Data 365. The dashboard has provided us with valuable real-time insights into our sales performance. We would highly recommend their services to anyone looking to take their sales analysis to the next level.

Ahmad Hammad, MBA
BI & ERP Specialist at SYH Retail - IKEA
Global Data 365 delivered an exceptional inventory dashboard for Baker Hughes. The Power BI solution provided real-time insights, streamlined inventory management, and improved decision-making across our operations.

Alan Siqueira
Inventory Manager - Baker Hughes
The supply chain dashboard on Power BI has revolutionized the way we manage our operations, providing real-time insights that enable us to optimize for maximum efficiency. They were highly professional and responsive throughout the process, and we highly recommend their services.

Mahmoud Mohsen
IT Administrator - Alif
Related Resources