Sales Dashboard

Transform your sales management with our sales dashboard in Power BI, delivering real-time insights to drive business growth.


Gain deep insights into sales performance, robust sales forecasting, and precise sales analysis, all in one intuitive Power BI dashboard.

Experience Live Interaction With Our Dashboard.

Get Customized Dashboard For Your Business

Get a Personalized Sales Dashboard

Let us help you create a dashboard for sales tailored to your unique goals

providing you with the sales analysis you need to drive success!

Transform Your Sales Analysis With Our Dynamic Sales Dashboard.

Say farewell to manual spreadsheets and get real-time insights with our Sales Dashboard examples, unlocking cost-saving opportunities and driving growth.

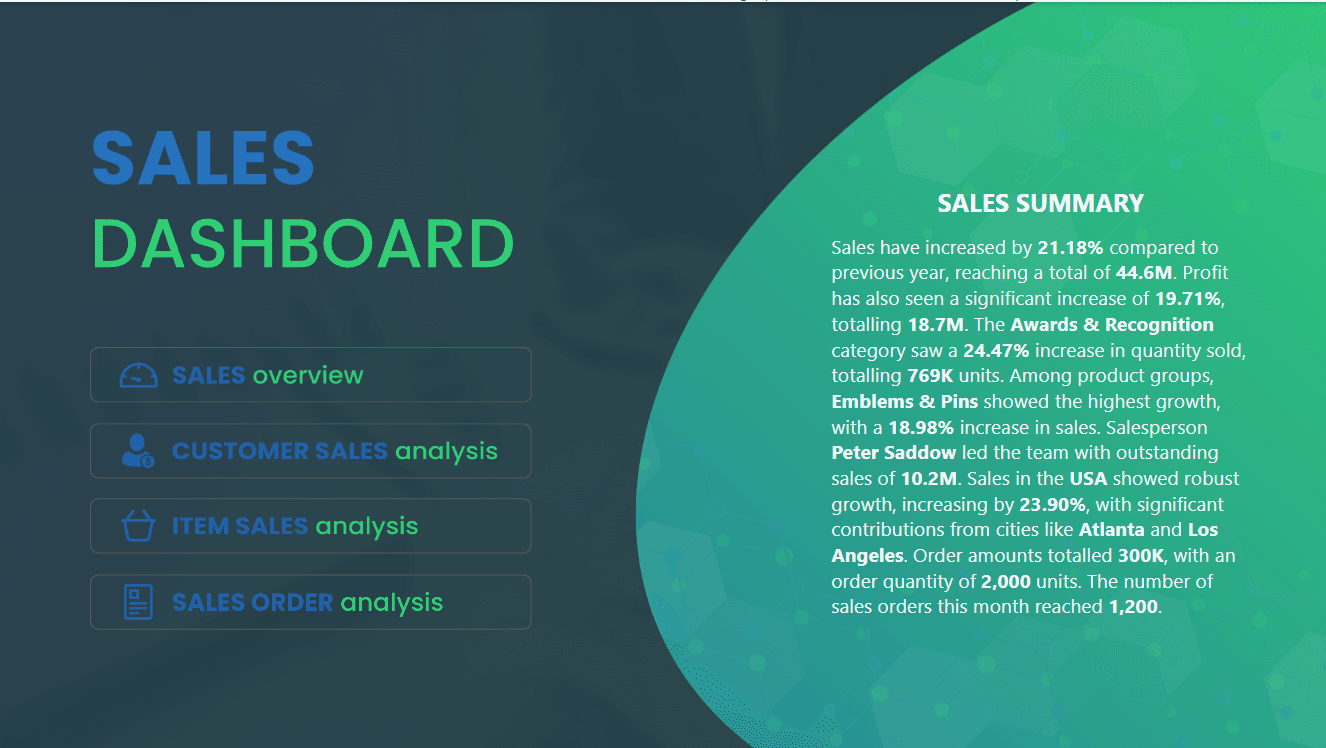
Front Page Sales Dashboard

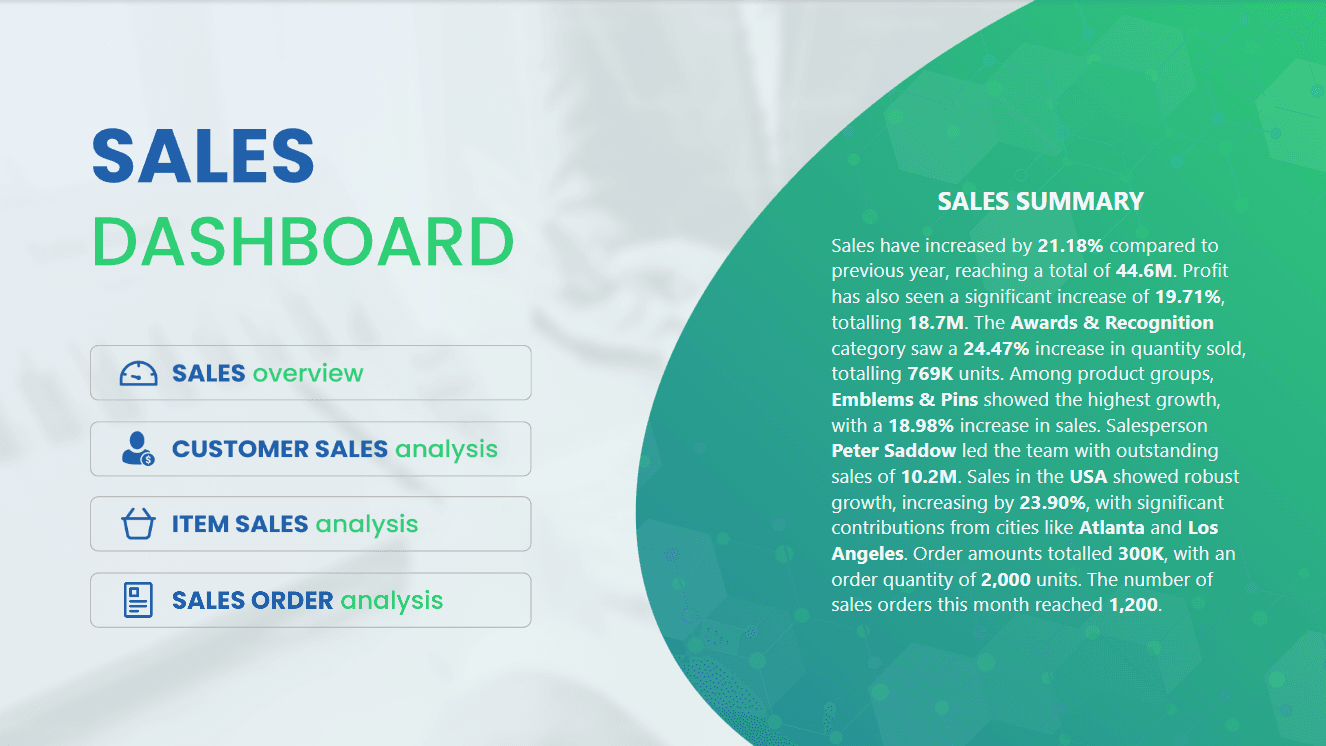
Welcome to the Ultimate Sales Dashboard, your one-stop solution for comprehensive sales analysis.

The front-page features four intuitive navigation buttons leading to specific sections: Sales Overview, Customer Sales Analysis, Item Sales Analysis, and Sales Order Dashboard. Additionally, a succinct sales summary provides an immediate snapshot of key metrics, including total sales, growth rates, and top-performing products, ensuring you stay informed and ready to drive your sales strategy forward.

sales dashboard power bisales dashboard power bi
sales dashboard overviewsales dashboard overview

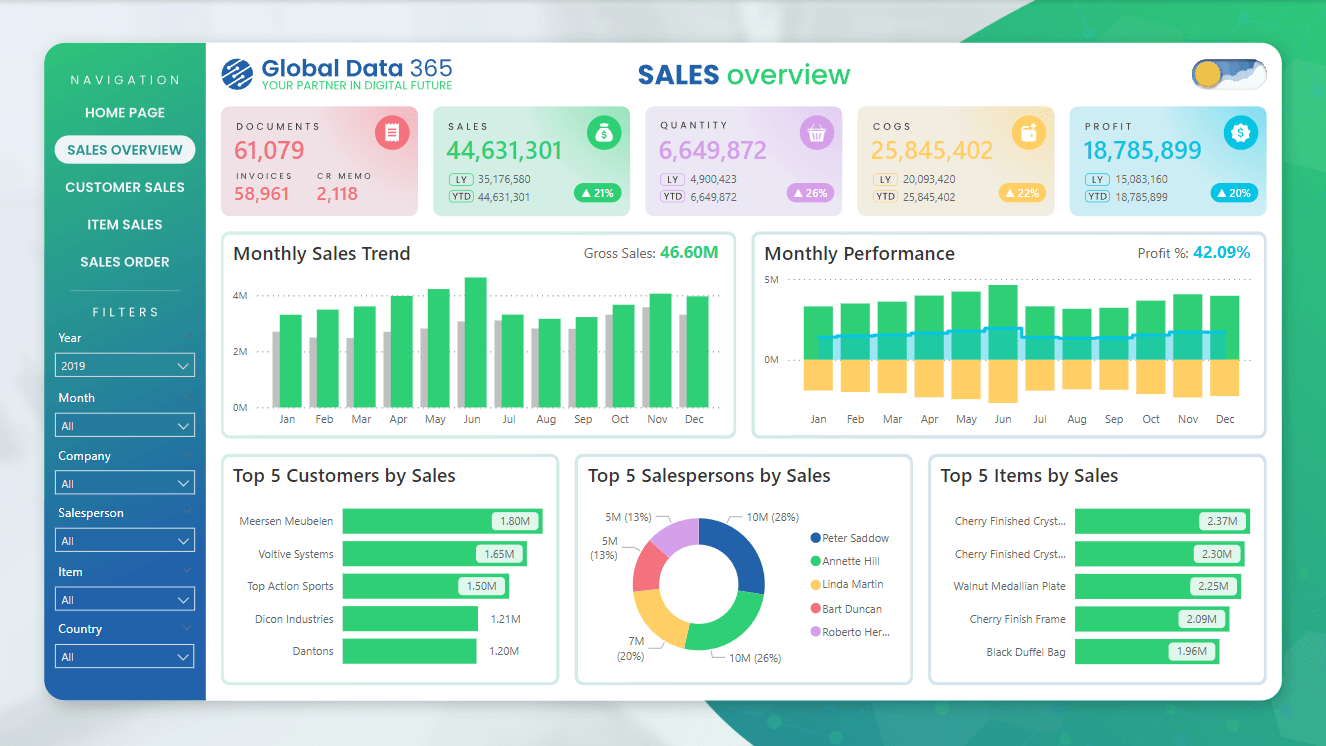
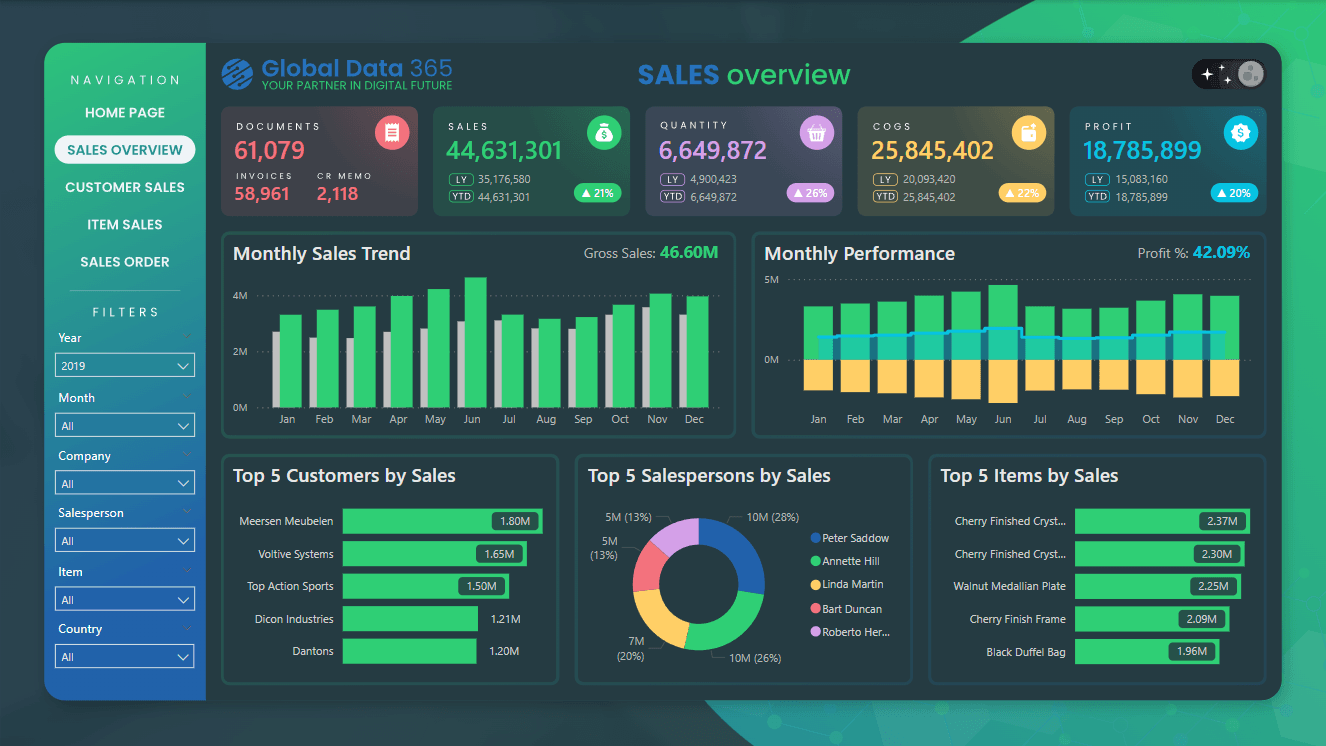
Sales Overview

The Sales Overview dashboard provides a detailed view of the company’s sales performance through essential sales dashboard KPIs and visuals.


The KPIs include Documents, Sales, Quantity, COGS (Cost of Goods Sold), and Profit, offering insights into transaction volumes, revenue, sales volume, direct costs, and net profitability. Visual representations include trends over time and top-rankings, facilitating performance analysis and informed decision-making for business growth with our sales dashboard report.

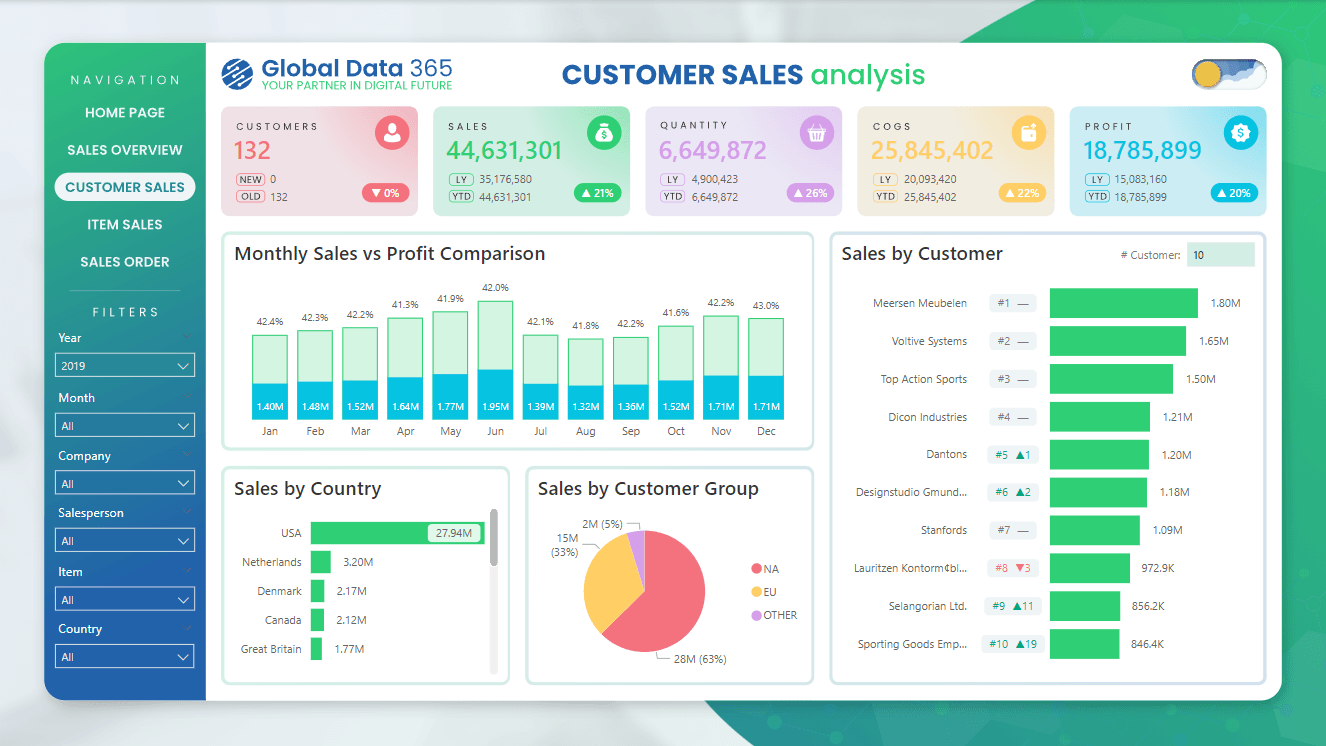
Customer Sales Analysis

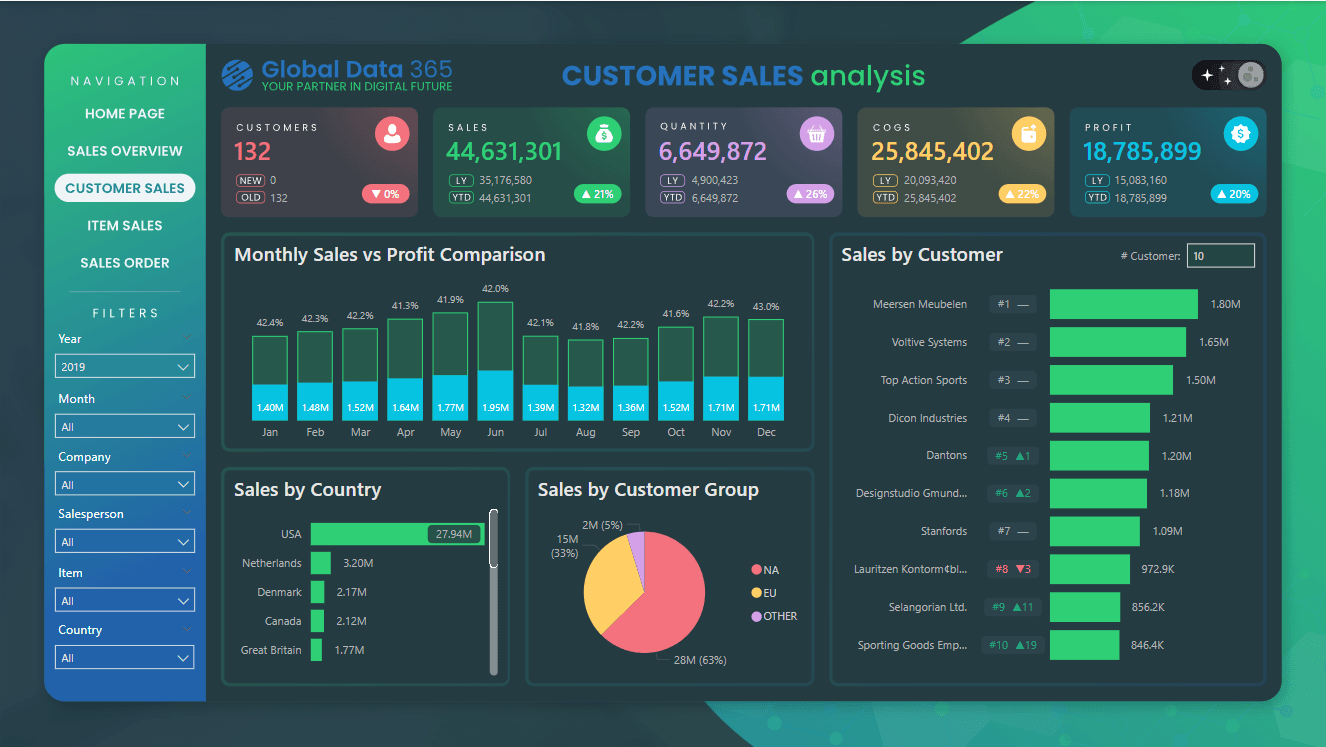
The Customer Sales Analysis page on the dashboard provides a comprehensive overview of customer-specific sales performance, enabling detailed analysis and strategic decision-making.


The KPIs including documents, sales, quantity, COGS, and profit.It helps to visualize sales patterns, identify top-performing segments, and pinpoint areas for sales improvement, thereby supporting effective sales funnel management and attainment of sales targets for business growth with sales growth dashboard.

customer sales analysissales dashboard power bi
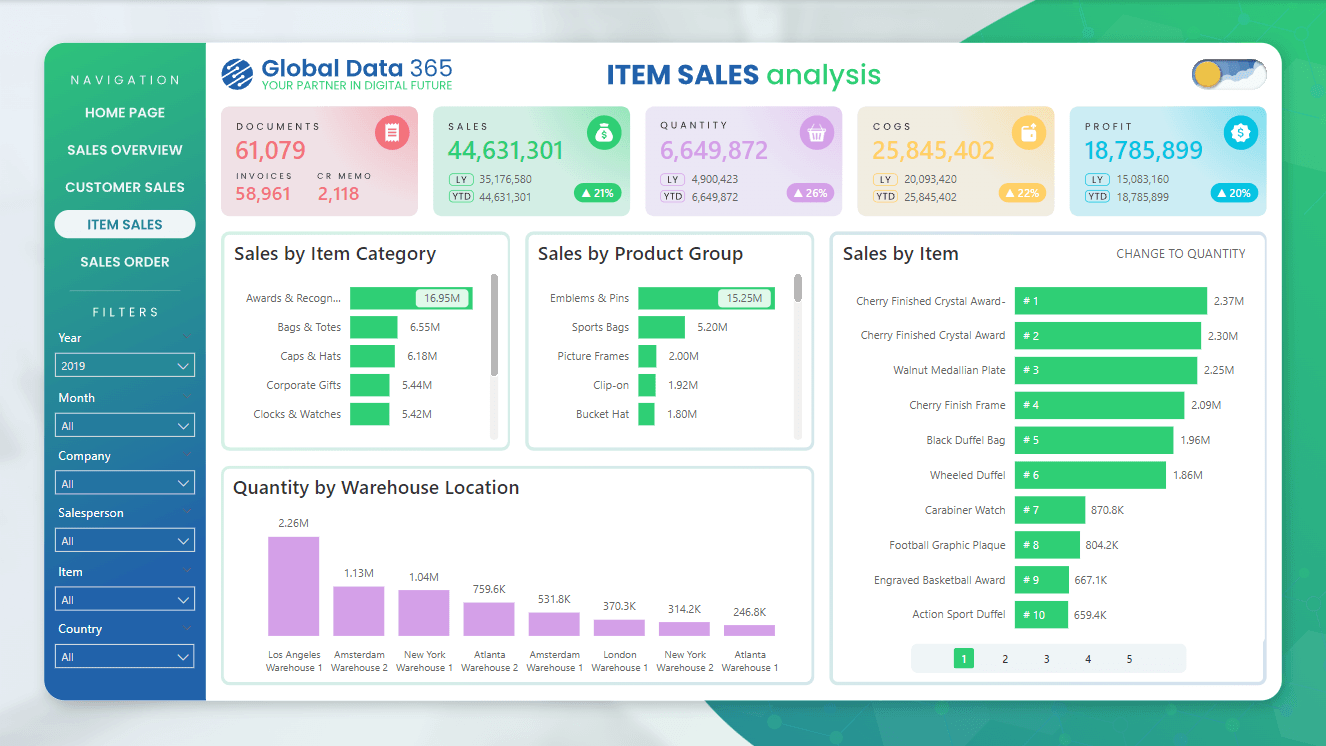
item sales analysis power bi dashboardsales dashboard power bi

Item Sales Analysis

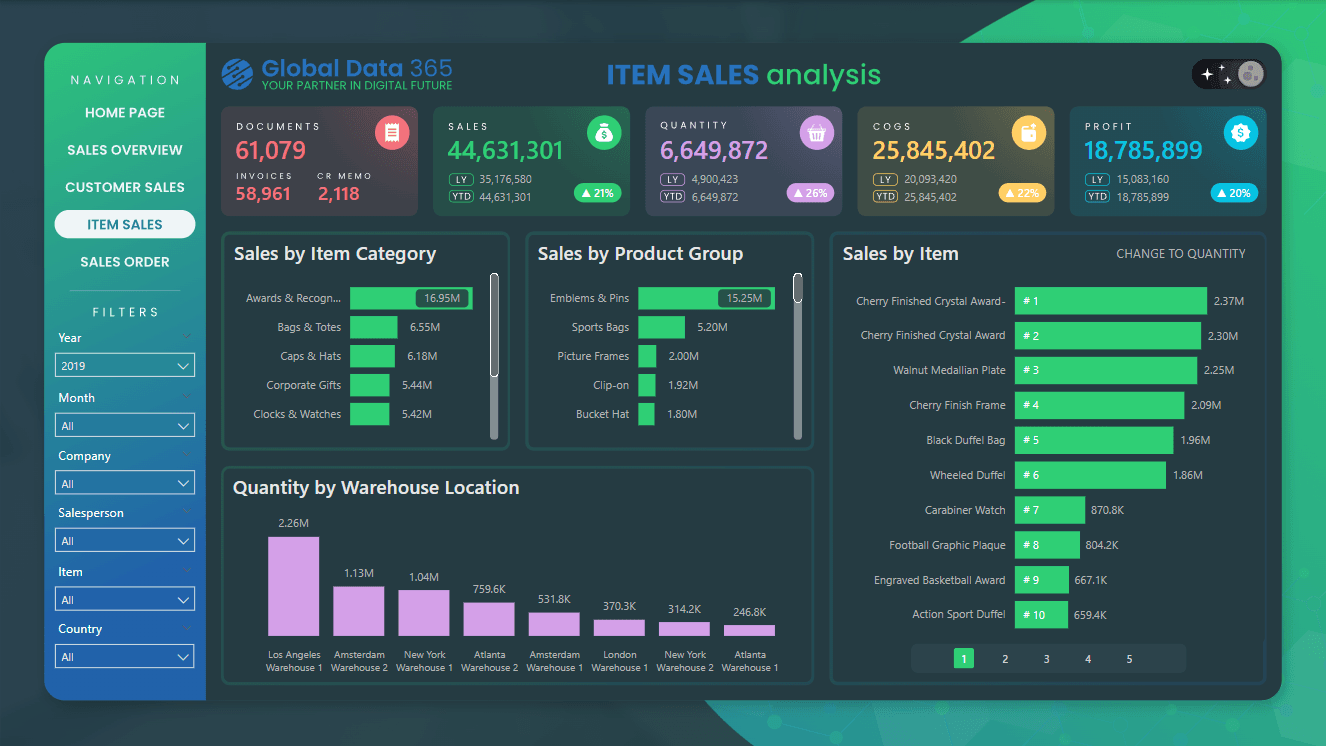
The Item Sales Analysis page on the dashboard provides a focused analysis of sales performance, offering deep insights into product-specific revenue trends.


The KPIs include documents, sales, quantity, COGS, and profit. The visuals aid in understanding operational efficiencies, facilitating informed decisions on inventory management, product strategy, and overall profitability optimization for your items with our sales dashboard template.

Sales Order Analysis

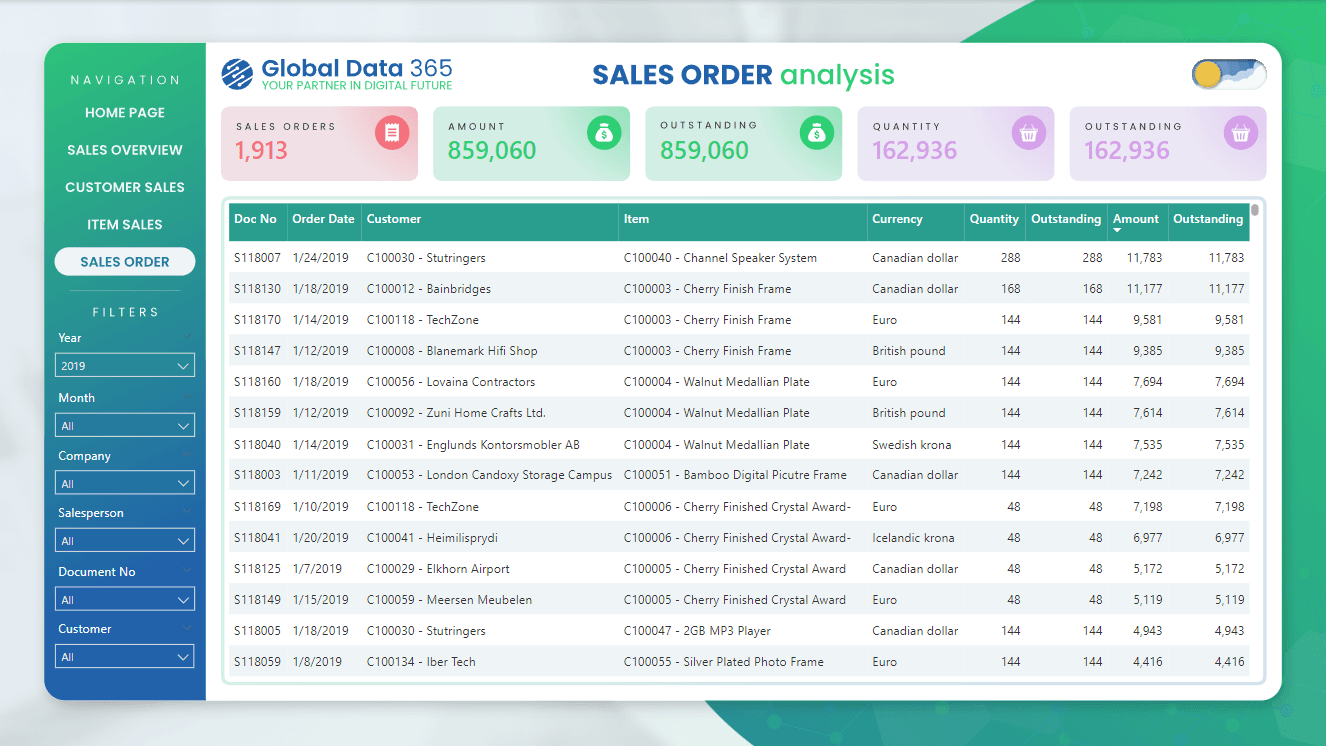
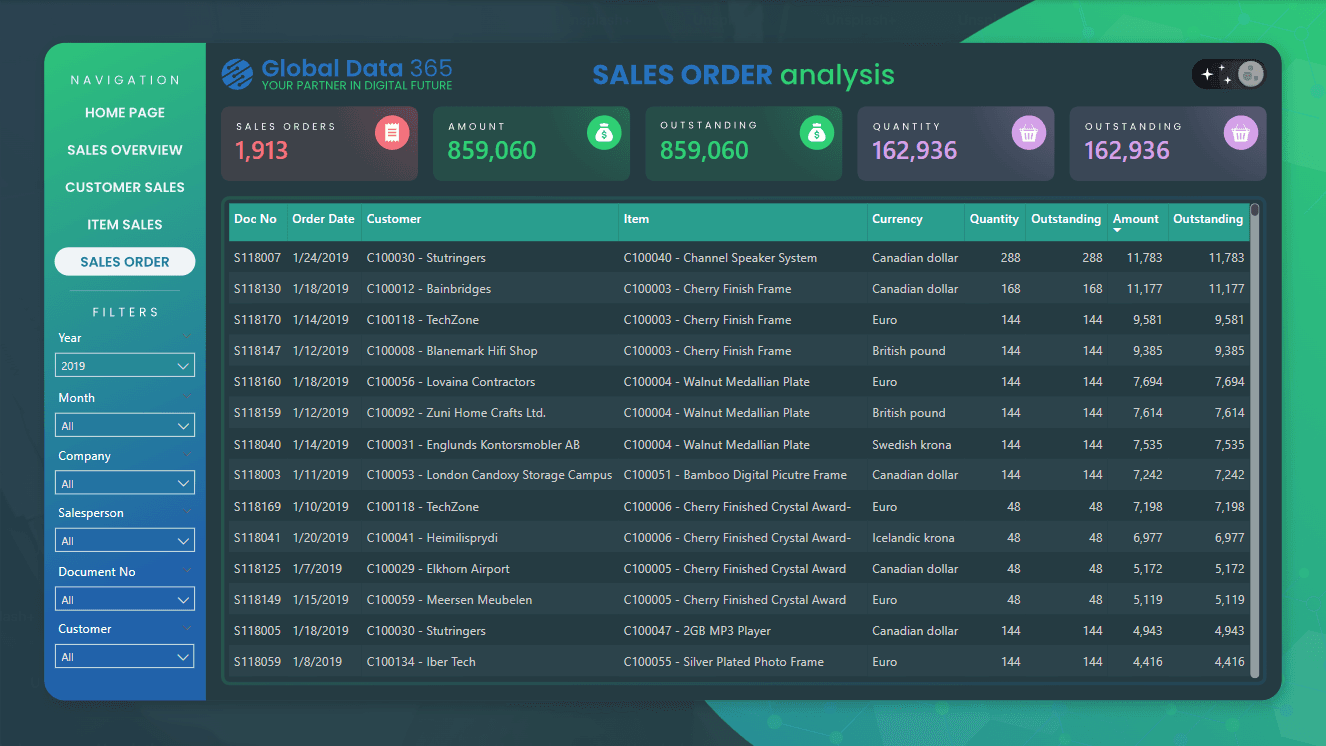
The Sales Order Analysis page on the dashboard provides a detailed overview of order management, enhancing the tracking of sales operations.


The KPIs include sales orders, amount, outstanding, and quantity. The comprehensive table of sales orders offers insights into order status and trends, facilitating informed decisions on order fulfillment, customer management and operational with comprehensive sales order dashboard power bi.

sales order analysissales order dashboard power bi
Power BI Dashboard

Get Your First Power BI Dashboard
Built In 2 Weeks

Our analysts have delivered 200+ dashboards across retail, manufacturing, healthcare, and finance teams.

Trusted By 500+ Businesses
4.9/5.0 Client Rating
Fast Response

What Our Customers Have to Say About Us

More than 50+ companies trusted us to implement Power BI and transform their data into powerful insights

FAQs on Sales Dashboard

Yes, our sales dashboard design and theme are fully customizable. You can personalize colors, fonts, and layouts to align with your brand identity, ensuring a polished look, as shown in our power bi sales dashboard sample.

Yes, you can fully customize the KPIs and charts in the dashboard. Select from a variety of metrics, configure data visualization and create personalized reports for your organizations.

Yes, the Sales Power BI Dashboard supports multiple company consolidation. This feature allows you to aggregate and analyze sales data from various entities, providing a comprehensive view of your overall business performance.

The cost of the Dashboard depends on the features and customization required. For a detailed quote, please contact our sales team.

The time required to implement a dashboard depends on the complexity of the data, the number of pages and the overall effort involved. Generally, it can take between 3 to 10 days.

To customize the dashboard according to your needs, we start with a consultation to understand your requirements, followed by designing, developing, and iterating based on your feedback.

global data 365
Get Your Custom Dashboard