Retail Sales Dashboard
The Retail Sales dashboard offers real-time insights into the sales performance of individual stores with retail analysis.
A comprehensive perspective of retail sales data and hourly trends for each store, empowering them to make informed business choices with retail sales analytics.
Experience Live Interaction With Our Dashboard.
Transform Your Retail Sales Insights
Let’s create a dashboard for retail sales tailored to your needs, so you
can easily track performance and boost your sales strategies!
Transform Your Retail Sales Dashboard into an Engaging and Insightful Experience
Find your way to retail business success with our power bi retail sales dashboard sample, leverage this powerful tool to make data-driven decisions and boost your sales performance.


Front Page Retail Sales Dashboard
The Front Page of our Ultimate Retail Sales Dashboard Power BI is the gateway to your data insights, and having navigation buttons can help users quickly and easily access different sections of your retail bi analytics dashboard.
The navigation buttons are placed at the left side of the title page and are designed to be intuitive and user-friendly. These buttons can be used to jump to different pages within the retail dashboard Power BI.
Retail Sales Analysis
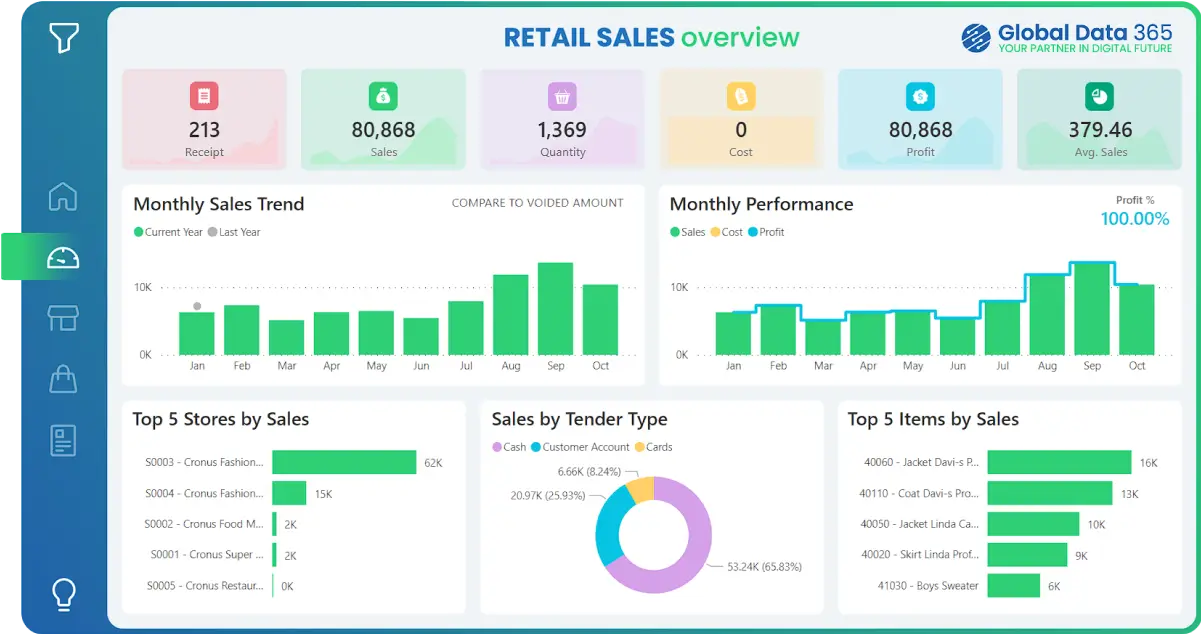
The Retail Sales Analysis Dashboard provides a holistic snapshot of the company’s sales achievements with retail sales report.
This focuses on six KPIs including Sales, Quantity, Cost and Profit. It provides a concise overview of monthly sales and profit, top performing stores and most selling items. These critical metrics offer a daily sales analysis and enable stakeholders to make informed decisions to drive growth and profitability with retail sales data.


Store Sales Analysis
The Store Sales Analysis dashboard allows you to track the performance of individual stores.
This focuses on six KPIs including Sales, Quantity, Cost and Profit. It compares store sales, displays weekly and hourly sales patterns, and showcases sales across cities. Plus, with the filter menu, you can select a specific store for more detailed insights in store sales data analysis retail dashboard.The Store Sales Analysis dashboard allows you to track the performance of individual stores.
Item Sales Analysis
The Item Sales Analysis dashboard tracks individual item sales, pinpointing bestsellers and items that aren’t moving as quickly.
It emphasizes on six KPIs including Sales, Quantity, Cost, and Profit. The dashboard ranks items, item categories, product groups, and divisions by sales value. Additionally, it lists unsold items, aiding in strategic decision-making through Item Sales Performance Dashboard Power BI.


Voided Transactions
The Voided Transactions dashboard showcases metrics surrounding voided sales.
It emphasizes on six KPIs including Sales, Quantity, Cost, and Transactions Count. The dashboard displays the progression of voided sales over time, enumerates items with their respective voided sales, and contrasts the monthly average of voided sales.
Get expert help to build your dashboard
Our Data Analysts work with hundreds of companies across all industries including retail, manufacturing, technology, healthcare, marketing services, and more.
FAQs on Retail Sales Dashboard
Yes, the retail sales dashboard is fully customizable. You can personalize colors, fonts, and layout to match your brand identity.
The pricing for the retail sales dashboard depends on the features and customization required. For a detailed quote, please contact our sales team.
Currently, a mobile version of the retail sales dashboard is not available, but we can develop a customized mobile version upon request.
Yes, you can fully customize the KPIs on our power bi retail sales dashboard template. Choose from various metrics and configure data visualizations to meet your specific business needs.
To create a retail sales report in Power BI, first import your sales data from Excel, a database, or other sources. Use Power BI’s data modeling tools to clean and transform the data as needed. Then, create visualizations like bar charts, line graphs, and pie charts to display key metrics such as total sales, sales by product category, and sales by location. Combine these visuals into a comprehensive dashboard to monitor and analyze your retail performance. For further understanding: Join our Power BI Training Program.
More than 50+ companies trusted us to implement Power BI and transform their data into powerful insights


What Our Customers Has to Say About Us
We are incredibly impressed with the sales dashboard designed for us on Power BI by Global Data 365. The dashboard has provided us with valuable real-time insights into our sales performance. We would highly recommend their services to anyone looking to take their sales analysis to the next level.

Ahmad Hammad, MBA
BI & ERP Specialist at SYH Retail - IKEA
It was a genuine pleasure working with Global Data 365. They consistently demonstrated patience, professionalism, and attentiveness to my requirements. Their expertise in Power BI is impressive; they quickly comprehends the concepts I aim to communicate and promptly provides effective solutions.

Rana Yaseen
Accounting Manager - Boston Scientific
Thanks to Global Data 365 for their outstanding Power BI service. We are grateful for the opportunity to work with Global Data 365’s team of talented and committed individuals

Mohammad Arshad
Financial Control & Reporting Assistant Manager - PepsiCo
Our finance dashboard from Global Data 365 has revolutionized the way we manage our finances, providing real-time insights that enable us to make informed decisions and drive business growth. The team was responsive and attentive throughout the design process, and we highly recommend their services.

Cesco Righetti
CFO - The Arts Club
Working with Global Data 365 has been a fantastic experience. Their Power BI reports have completely transformed how we analyze and use our data. The insights are clear, actionable, and have made decision-making so much easier for our team.

Tres Nelson
Manager BI - Signature Systems
Global Data 365 delivered an exceptional inventory dashboard for Baker Hughes. The Power BI solution provided real-time insights, streamlined inventory management, and improved decision-making across our operations.

Alan Siqueira
Inventory Manager - Baker Hughes
The supply chain dashboard on Power BI has revolutionized the way we manage our operations, providing real-time insights that enable us to optimize for maximum efficiency. They were highly professional and responsive throughout the process, and we highly recommend their services.

Mahmoud Mohsen
IT Administrator - Alif
Related Resources