Power BI Sample Dashboards
Turn Your Data Into Decisions with Power BI Samples
Explore production-ready dashboards built for every department, industry and ERP. Find your use case and hit the ground running.
Dashboards by department, industry & ERP
Tailored to real business challenges
Built by certified Power BI consultants
Supports Business Central & D365 F&O
100+ individuals trust Global Data 365
Discover how Power BI brings your data to life with samples designed for different departments—from inventory to purchasing—turning insights into smarter decisions.
Finance & Accounting
Financial analytics, accounting insights, cash flow tracking and profitability reporting dashboards

Finance
Track revenue, expenses, budgets, profitability and overall financial performance with interactive Power BI analytics.
Revenue
Expenses
Pipeline

Finance
Monitor customer balances, outstanding invoices, payment aging and collection performance in real time.
Receivables
Collections
Aging
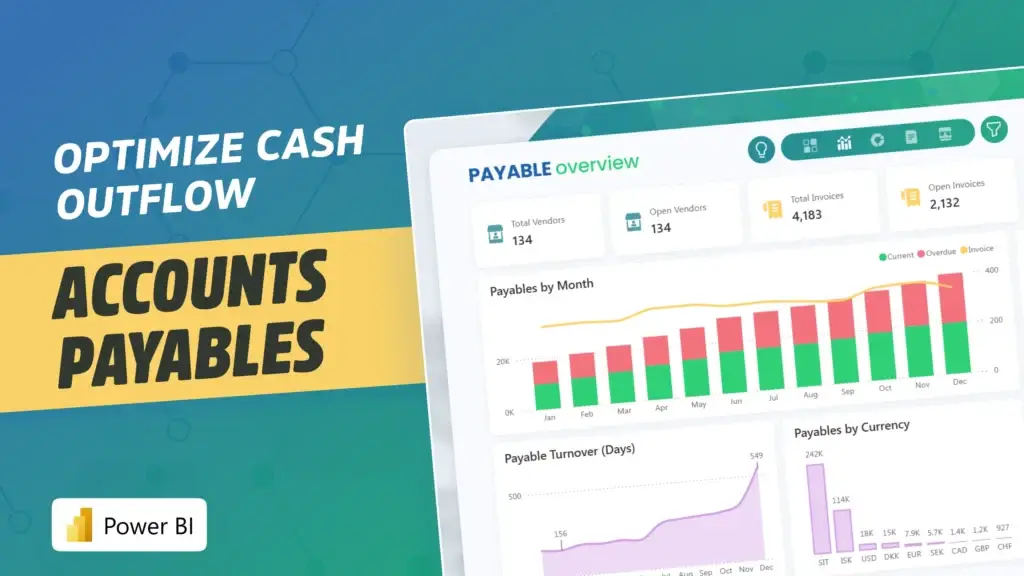
Finance
Analyze vendor payments, payable balances, due invoices and procurement spending trends efficiently.
Revenue
Quota
Pipeline

Finance
Track asset acquisition, depreciation, utilization, and fixed asset lifecycle performance across the business.
Net
Depreciation
Acquisition
4 Samples
Sales & Revenue
Sales performance, customer analytics, revenue tracking and business growth insights
3 Samples

Sales
Analyze sales trends, customer performance, revenue growth and profitability with interactive reporting.
Sales
Revenue
Customers

Sales
Track retail revenue, store performance, product demand, and customer purchasing behavior across locations.
Retail
Stores
Products
Supply Chain & Inventory
Inventory visibility, warehouse analytics and supply chain performance dashboards
2 Samples
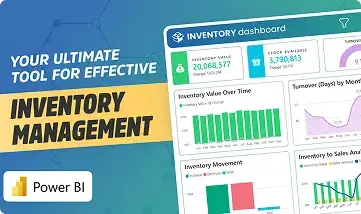
Supply Chain
Track stock levels, inventory valuation, warehouse operations, and replenishment insights in real time.
Stock
Turnover
Warehouse
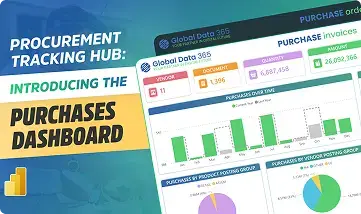
Supply Chain
Monitor supplier activity, procurement costs, purchase orders and spending performance effectively.
Vendors
Suppliers
1 Sample
Human Resources
Workforce analytics, employee insights, and HR performance reporting solutions
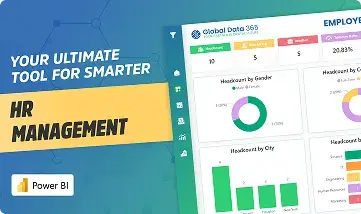
Human Resources
Monitor headcount, attrition, recruitment, workforce diversity, and employee performance metrics.
Headcount
Attrition
Hiring
Transform your data into actionable insights with Power BI's curated industry solutions perfect for your business and corporate insights for all.
Real Estate & Property
Gain visibility into property operations, leasing performance, occupancy trends, and revenue analytics.
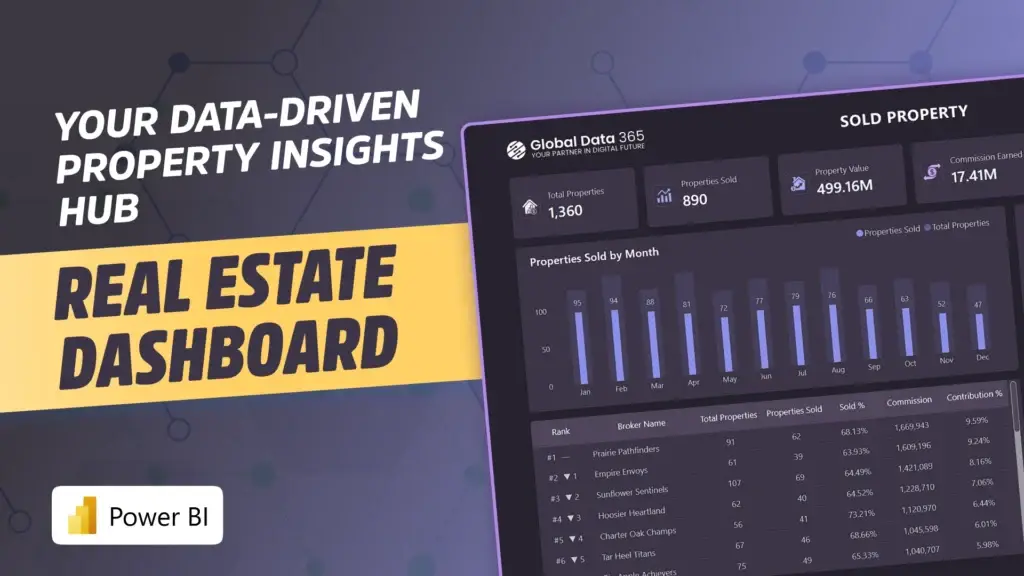
Real Estate
Track property sales, rental income, occupancy performance, and real estate portfolio insights
Sales
Rentals
Occupancy
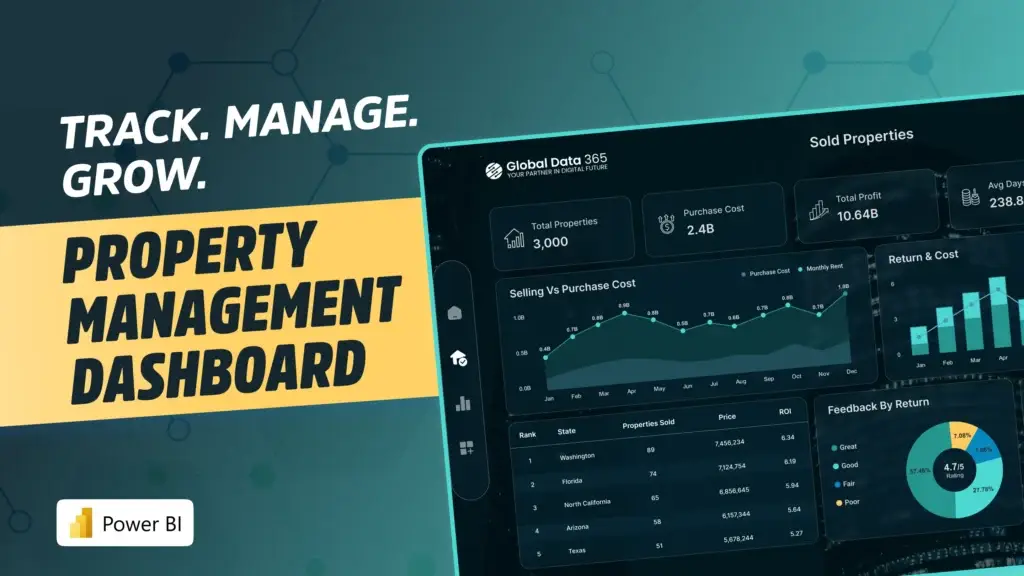
Real Estate
Monitor tenants, maintenance activities, lease performance, and property operations efficiently.
Listing
Maintenance
2 Samples
Hospitality
Hospitality analytics, guest experience tracking and operational performance reporting
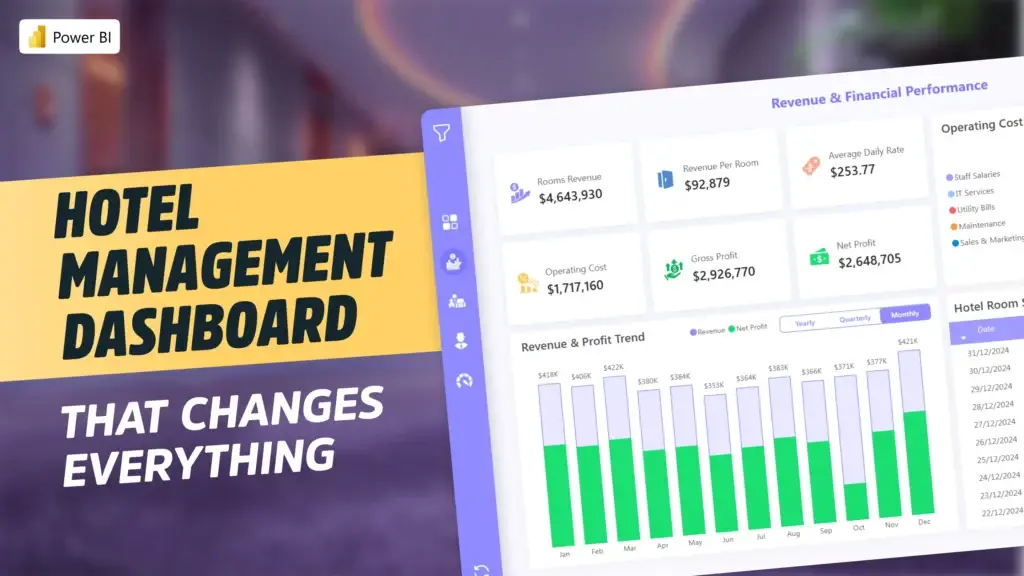
Hospitality
Track occupancy rates, bookings, guest analytics and hotel revenue performance in real time.
Guests
Bookings
Occupancy

Hospitality
Analyze restaurant sales, menu performance, operational costs, and customer trends effectively.
Menu
Customers
Sales
2 Samples
Supply Chain
Manufacturing, logistics and end-to-end operational analytics dashboards

Logistics
Track shipments, delivery performance, transportation costs and fulfillment operations in real time.
Shipments
Delivery
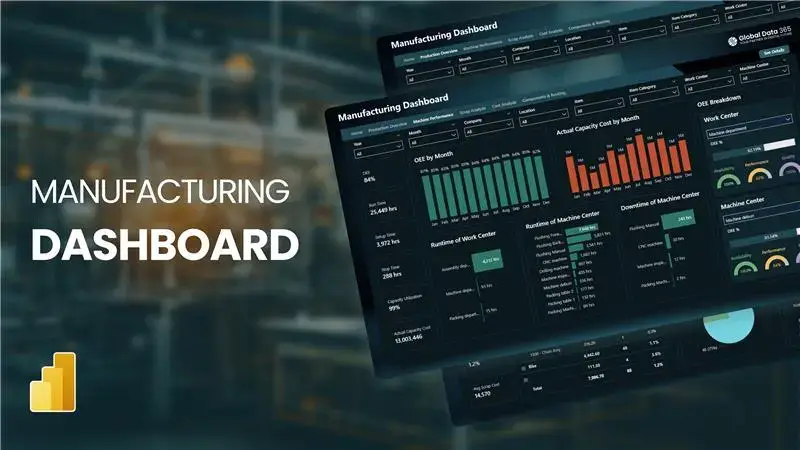
Logistics
Monitor production efficiency and rate, machine utilization, scrap analysis and manufacturing costs effectively
Production
OEE
Machines
2 Samples
Operations
Run your domain with your operational dashboard for real-time visibility
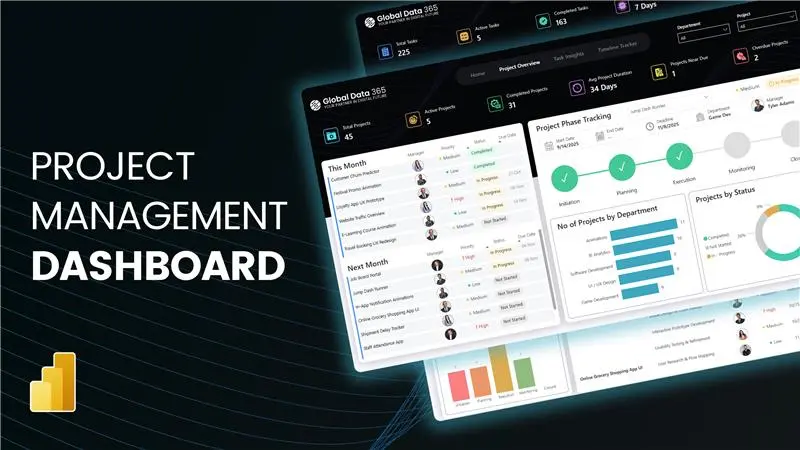
Office
Track project progress, task completion, budgets, resources, and project profitability insights
Tasks
Timeline
Resources
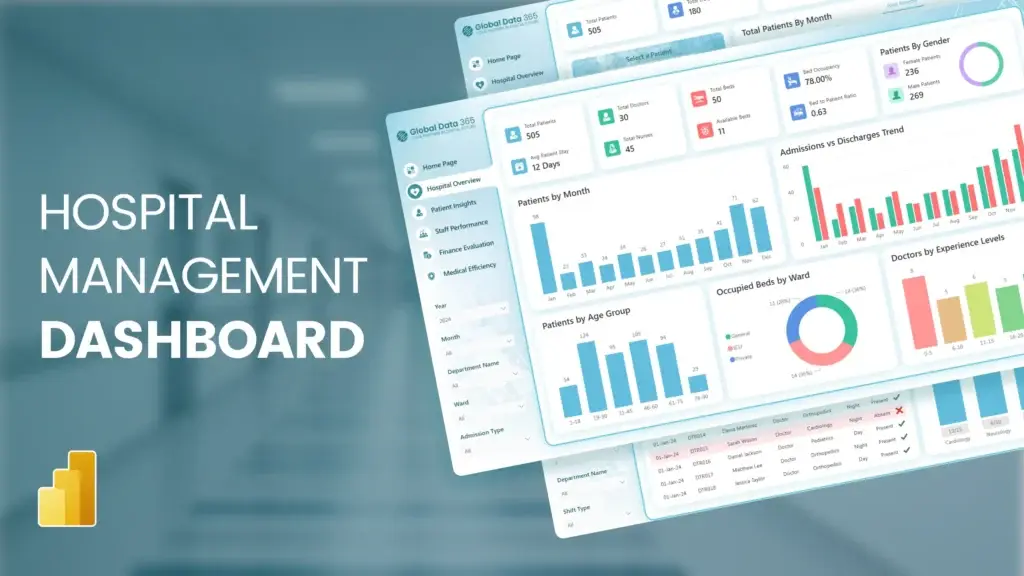
Healthcare
Monitor patient admissions, occupancy, staff performance, and healthcare operations.
Healthcare
Patients
Medical
2 Samples
ERP dashboards for Microsoft Dynamics 365 Business Central and F&O deliver real-time insights to track performance and drive smarter decisions.
Microsoft Dynamics 365 Business Central (BC)
Transform Business Central data into actionable finance and sales insights with Power BI reporting.
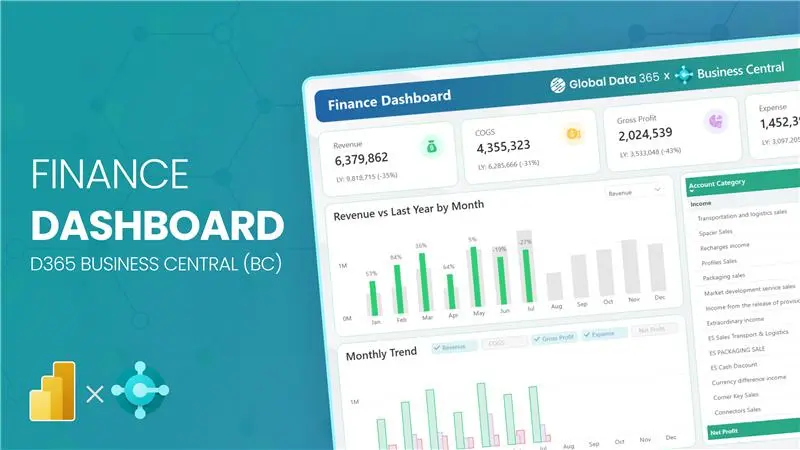
D365 BC
Track financial KPIs, profitability, budgets, cash flow and accounting performance directly from Business Central.
Cashflow
Profitability
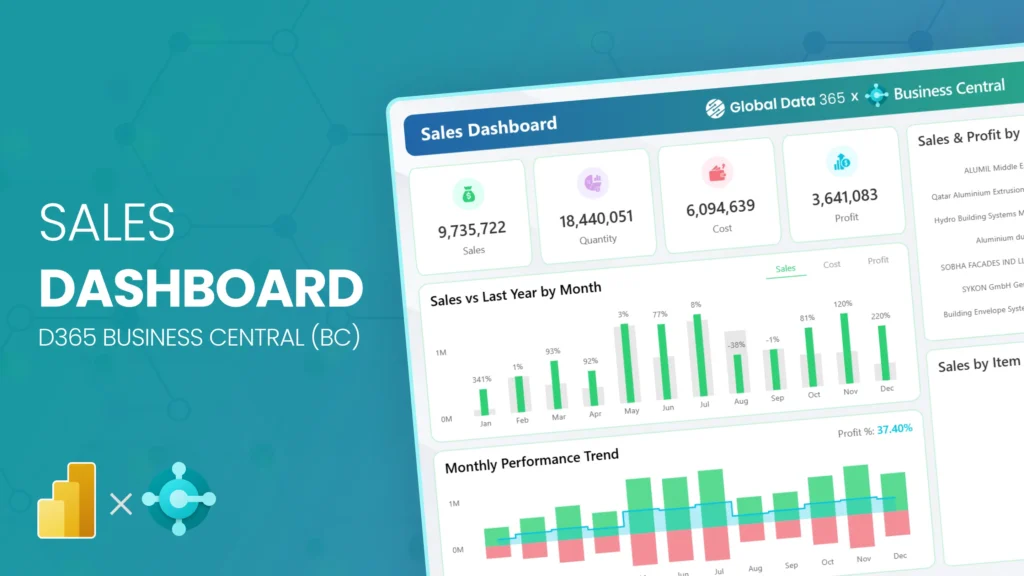
D365 BC
Analyze revenue trends, customer insights, product performance and sales growth within Dynamics 365 BC.
Revenue
Sales
Customers
2 Samples
Microsoft Dynamics 365 Finance & Operations (F&O)
Optimize operations and reporting with advanced analytics powered by Dynamics 365 F&O data.
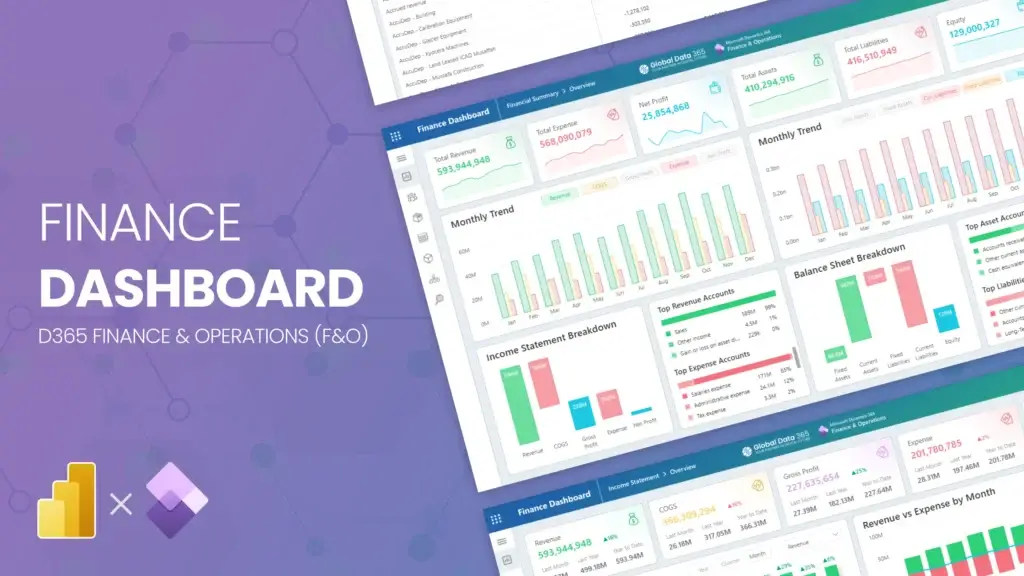
D365 F&O
Track income statements, balance sheets, cash flow and financial performance with real-time D365 F&O analytics.
Revenue
Cube
GL
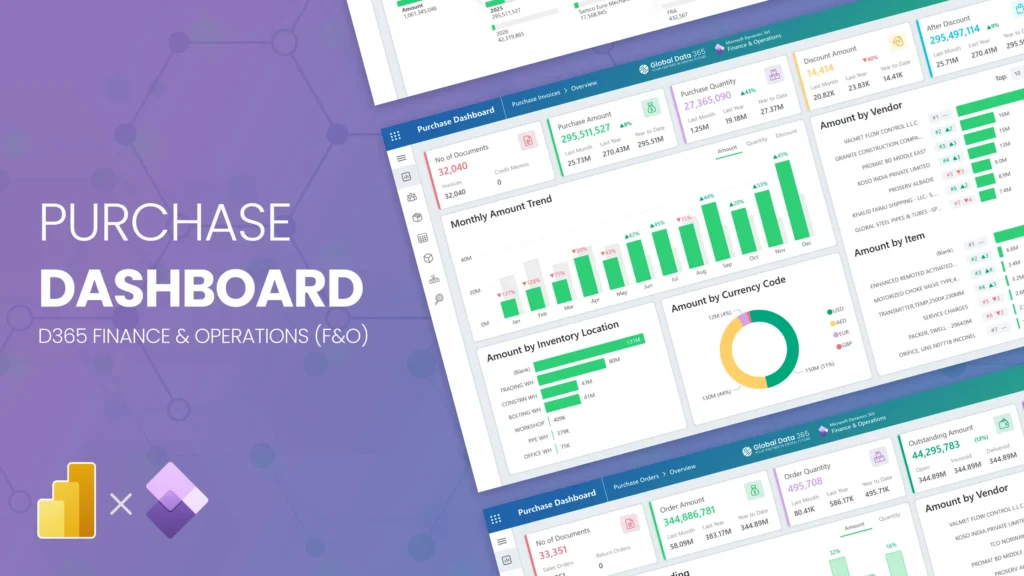
D365 F&O
Track procurement operations, supplier performance, purchasing trends, and spend analysis efficiently.
Orders
Invoices
Vendors
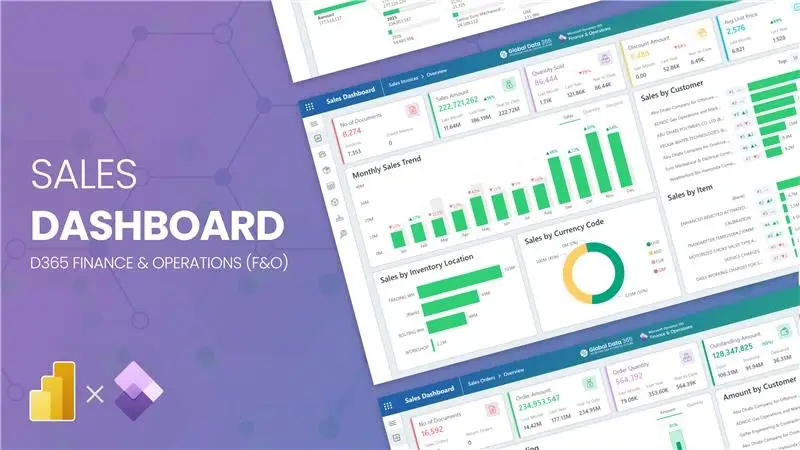
D365 F&O
Monitor revenue growth, customer trends, operational efficiency and sales performance insights for the F&O data.
Invoices
Orders
Forecasting
3 Samples
Get in Touch
Need a Personalized Dashboard?
Tell us your use case whether it’s a custom sales tracker, a finance overview, or a full ERP-connected dashboard. We’ll build it to fit your exact data and goals.
Custom dashboards tailored to your KPIs
Fast turnaround by certified consultants
Connects to BC, D365 F&O, and more
Built for your industry & team
Request a Custom Dashboard
We’ll get back to you as soon as possible

