Finance Dashboard Power BI
for D365 Finance & Operations(F&O)
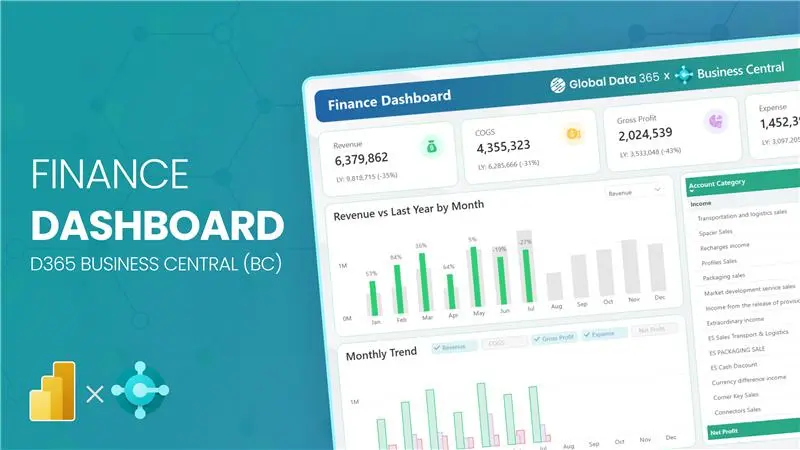
Finance Dashboard Power BI for D365 Finance & Operations(F&O)
Transform your financial reporting with our modern and interactive Finance Dashboard for D365 F&O,
designed to give finance teams complete visibility into their numbers.
Monitor financial analytics with powerful Power BI visuals built for data-driven decisions with our D365 F&O Finance Dashboard.
Try the D365 F&O Finance Dashboard Yourself
Get Personalized Finance Dashboard
for D365 F&O
Global Data 365 simplifies reporting by automatically extracting and organizing your D365 F&O data into a centralized analytics model.
Finance Dashboard Modules
for D365 Finance & Operations
From real-time cash flow monitoring to detailed income statement analysis, unlock actionable financial insights that help you manage performance and make data-driven decisions across your entire finance cycle with financial dashboard for D365 F&O.
Financial Summary
High-level financial overview & GL analytics
Overview
Cube
trial balance
cash flow
gl entries
Get a consolidated view of your company’s financial health in D365 F&O from trial balance and general ledger entries to cash flow trends and multi-dimensional cube analysis.
- KPIs: Total Revenue, Total Expenses, Net Income, Cash Position
- Trial Balance — debit vs credit with account-level drill-down
- Cash Flow — operating, investing & financing activities
- GL Entries — filter by account, period, dimension & posting layer
- Multi-dimensional Cube for ad-hoc financial slice & dice
Income Statement
P&L performance, budget & ratio analysis
Overview
vs budget
report
ratios
Analyze your profit & loss in D365 F&O across periods, compare actuals vs budget, review key profitability ratios, and drill through a full income statement report.
- KPIs: Gross Profit, Operating Income, Net Profit, EBITDA
- Revenue vs Budget — variance & % deviation by account group
- Full Income Statement report with period comparison
- Profitability Ratios — gross margin, operating margin, net margin
Balance Sheet
Assets, liabilities & equity position
Overview
report
ratios
Monitor your complete balance sheet in D365 F&O from current and non-current assets to liabilities and equity, with period-over-period comparisons and key financial ratios.
- KPIs: Total Assets, Total Liabilities, Equity, Current Ratio
- Full Balance Sheet report — structured by account category
- Liquidity & Leverage Ratios — current, quick, debt-to-equity
- Period comparison — MoM and YoY balance sheet movement
Analysis
Forecast comparison & influencer intelligence
vs forecast
decomposition
influencers
Dive deeper into your financial performance with forecast variance analysis, decomposition trees, and AI-powered key influencer visuals to understand what drives your numbers in D365 F&O.
- Actuals vs Forecast — variance analysis by period & account
- Decomposition Tree — break down any KPI by multiple dimensions
- Key Influencers — identify top drivers of revenue & cost changes
- Trend anomaly detection — spot unusual movements quickly
What Our Customers Have to Say About Us
Working with Global Data 365 has been a fantastic experience. Their Power BI reports have completely transformed how we analyze and use our data. The insights are clear, actionable, and have made decision-making so much easier for our team.

Tres Nelson
Manager BI - Signature Systems
We are incredibly impressed with the sales dashboard designed for us on Power BI by Global Data 365. The dashboard has provided us with valuable real-time insights into our sales performance. We would highly recommend their services to anyone looking to take their sales analysis to the next level.

Ahmad Hammad, MBA
BI & ERP Specialist at SYH Retail - IKEA
Global Data 365 delivered an exceptional inventory dashboard for Baker Hughes. The Power BI solution provided real-time insights, streamlined inventory management, and improved decision-making across our operations.

Alan Siqueira
Inventory Manager - Baker Hughes
Thanks to Global Data 365 for their outstanding Power BI service. We are grateful for the opportunity to work with Global Data 365’s team of talented and committed individuals

Mohammad Arshad
Financial Control & Reporting Assistant Manager - PepsiCo
It was a genuine pleasure working with Global Data 365. They consistently demonstrated patience, professionalism, and attentiveness to my requirements. Their expertise in Power BI is impressive; they quickly comprehends the concepts I aim to communicate and promptly provides effective solutions.

Rana Yaseen
Accounting Manager - Boston Scientific
The supply chain dashboard on Power BI has revolutionized the way we manage our operations, providing real-time insights that enable us to optimize for maximum efficiency. They were highly professional and responsive throughout the process, and we highly recommend their services.

Mahmoud Mohsen
IT Administrator - Alif
FAQs on Finance Dashboard For D365 F&O
A Finance Dashboard for Dynamics 365 Finance & Operations (F&O) is a Power BI-powered reporting solution that connects directly to your D365 F&O data to deliver real-time financial analytics in a single, interactive view. It consolidates key financial statements, including the income statement, balance sheet, cash flow statement, and general ledger (GL) entries, into visual KPIs and drill-through reports. Unlike standard D365 F&O built-in workspaces, a dedicated F&O finance dashboard enables CFOs and finance teams to monitor net income, gross profit, EBITDA, and cash position with period-over-period comparisons, actuals vs. budget variance, and multi-dimensional cube analysis, all without exporting data to Excel.
Power BI connects to Dynamics 365 Finance & Operations through entity store, OData feeds, Azure Data Lake (BYOD/Synapse Link), or pre-built data connectors that extract financial data from D365 F&O tables. Once connected, Power BI pulls transactional data from modules like General Ledger, Accounts Payable, Accounts Receivable, and Cash & Bank Management to build a centralized financial analytics model. A well-structured D365 F&O Finance Dashboard uses this connection to surface real-time trial balance data, GL posting layers, financial dimensions, and budget vs. actuals comparisons, enabling finance teams to replace manual F&O financial reports with automated, always-current Power BI dashboards.
A comprehensive D365 F&O Finance Dashboard should track KPIs across all core financial statements. For the income statement: Gross Profit, Operating Income, Net Profit, and EBITDA. For the balance sheet: Total Assets, Total Liabilities, Equity, and Current Ratio. For cash flow: Operating, Investing, and Financing cash flow trends. For GL and trial balance reporting in F&O: debit vs. credit balances by account, posting layer, and financial dimension. Additional F&O-specific metrics include actuals vs. budget variance %, actuals vs. forecast deviation, profitability ratios (gross margin, operating margin, net margin), and liquidity ratios like quick ratio and debt-to-equity, giving finance leaders a complete picture of organizational financial health.
Yes, D365 F&O financial reports and dashboards can be fully customized by department, cost center, business unit, legal entity, and any financial dimension configured in your chart of accounts. Power BI dashboards built on D365 F&O data allow finance teams to slice income statements, balance sheets, and GL entries by dimension values, enabling departmental P&L reporting, intercompany analysis, and consolidated vs. entity-level views. This makes a D365 F&O Finance Dashboard significantly more flexible than standard Management Reporter or Financial Reporter outputs, which often require manual layout changes for each reporting entity or department-level financial view.
The D365 F&O Finance Dashboard is purpose-built to extract and visualize data directly from Microsoft Dynamics 365 Finance & Operations, including trial balance, GL entries, financial dimensions, posting layers, and budget data as structured within F&O's chart of accounts. A generic Finance Department Dashboard, by contrast, may aggregate financial data from any source (QuickBooks, SAP, CSV exports) and focuses on department-level KPIs without ERP-native integration. The D365 F&O-specific dashboard handles F&O's multi-legal entity structure, financial dimension hierarchies, and period definitions natively, making it the right choice for organizations running Dynamics 365 F&O as their ERP who need automated, accurate F&O financial reporting without manual data preparation.
Yes, a fully featured D365 Finance & Operations dashboard includes actuals vs. budget variance analysis and actuals vs. forecast comparison as dedicated reporting views. These allow finance teams to track revenue and expense deviations by account group, period, and financial dimension, with both absolute variance and percentage deviation displayed. Advanced D365 F&O financial dashboards also incorporate decomposition trees and AI-powered key influencer visuals to identify the top drivers behind budget overruns or revenue shortfalls. This level of F&O budget reporting replaces the need for manual Excel-based variance workbooks and integrates directly with budget data maintained in D365 F&O's budgeting module.
Related Resources