HR Dashboard

Transform Your Workforce Management with Cutting-Edge HR Dashboard Power BI.


Maximize your Human Resources operations with our HR Analytics Dashboard Power BI. Access employee data, leave, payroll and performance insights in one intuitive platform.

Experience Live Interaction with Our HR Dashboard Sample.

Get Customized Dashboard For Your Business

Boost Your Team Insights with
HR Dashboard KPI

Get your personalized dashboard for HR tailored to your business and HR analytics requirements that will deliver you valuable insights.

Transform Your HR Analysis With Our Dynamic HR Dashboard.

Explore powerful and dynamic Power BI HR dashboard template that replace traditional data tracking, providing real-time insights and unlocking cost-saving opportunities to drive growth.

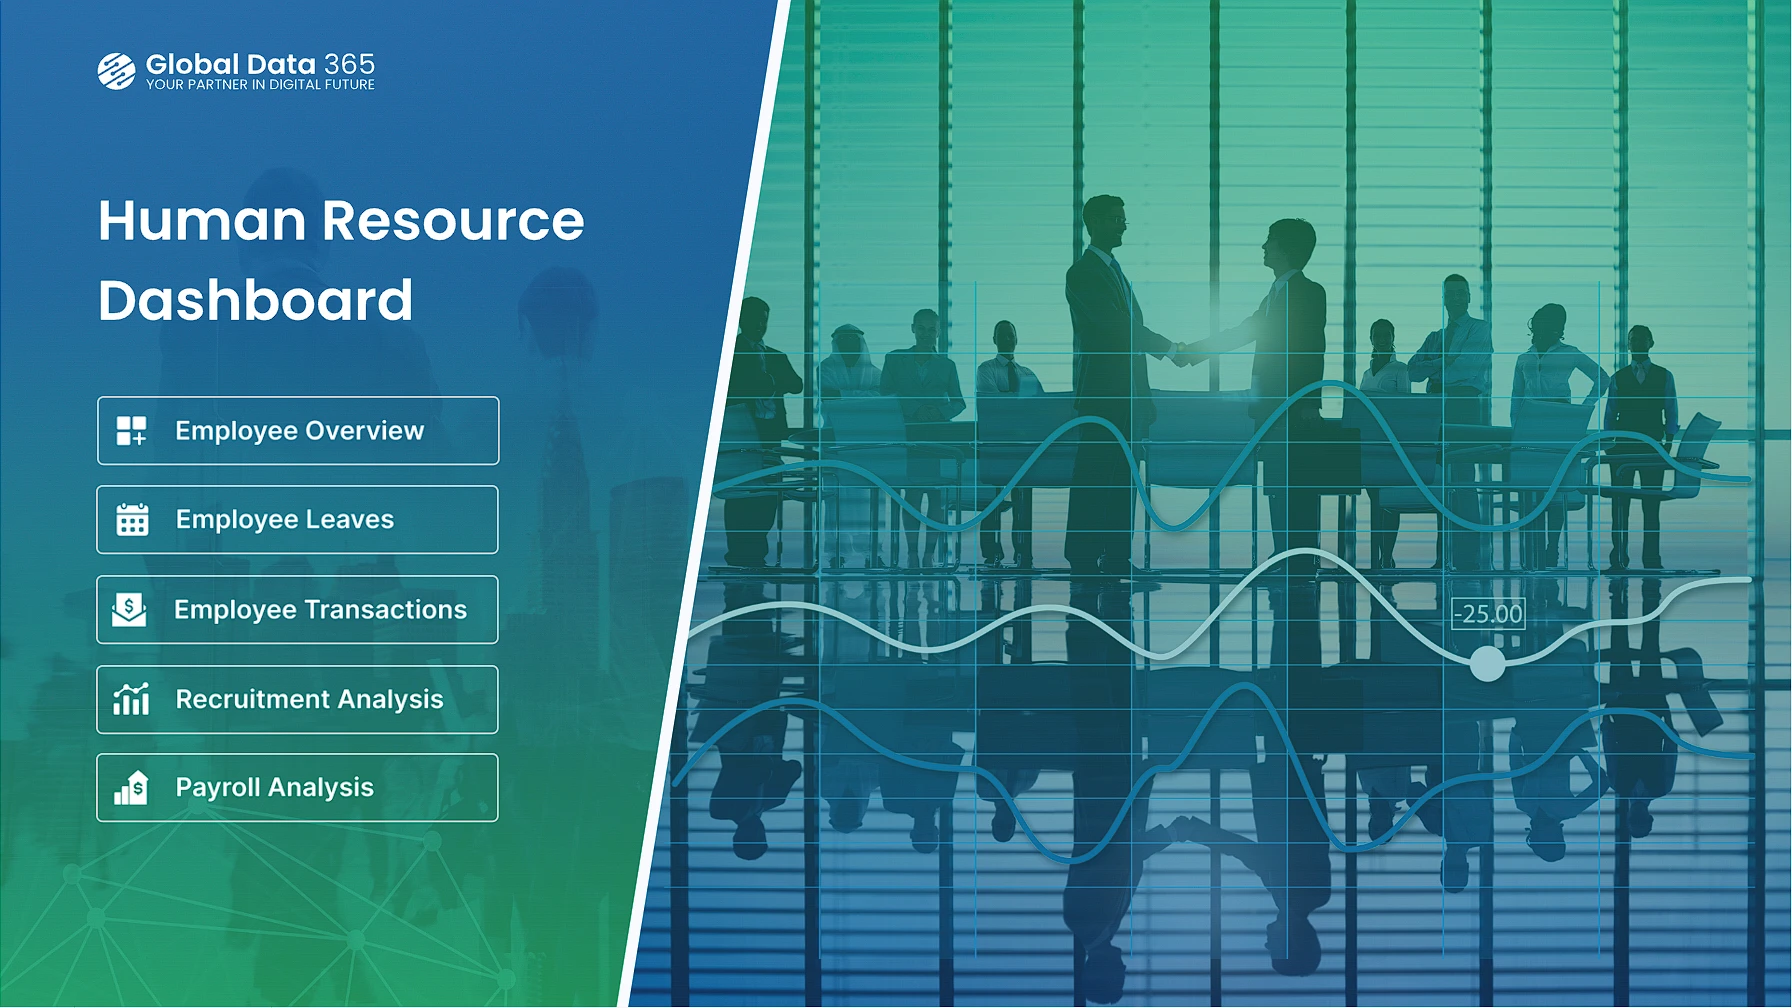
hr dashboard power biPower BI HR Dashboard home page with navigation to Employee Overview, Leaves, Transactions, Recruitment, and Payroll

Front Page

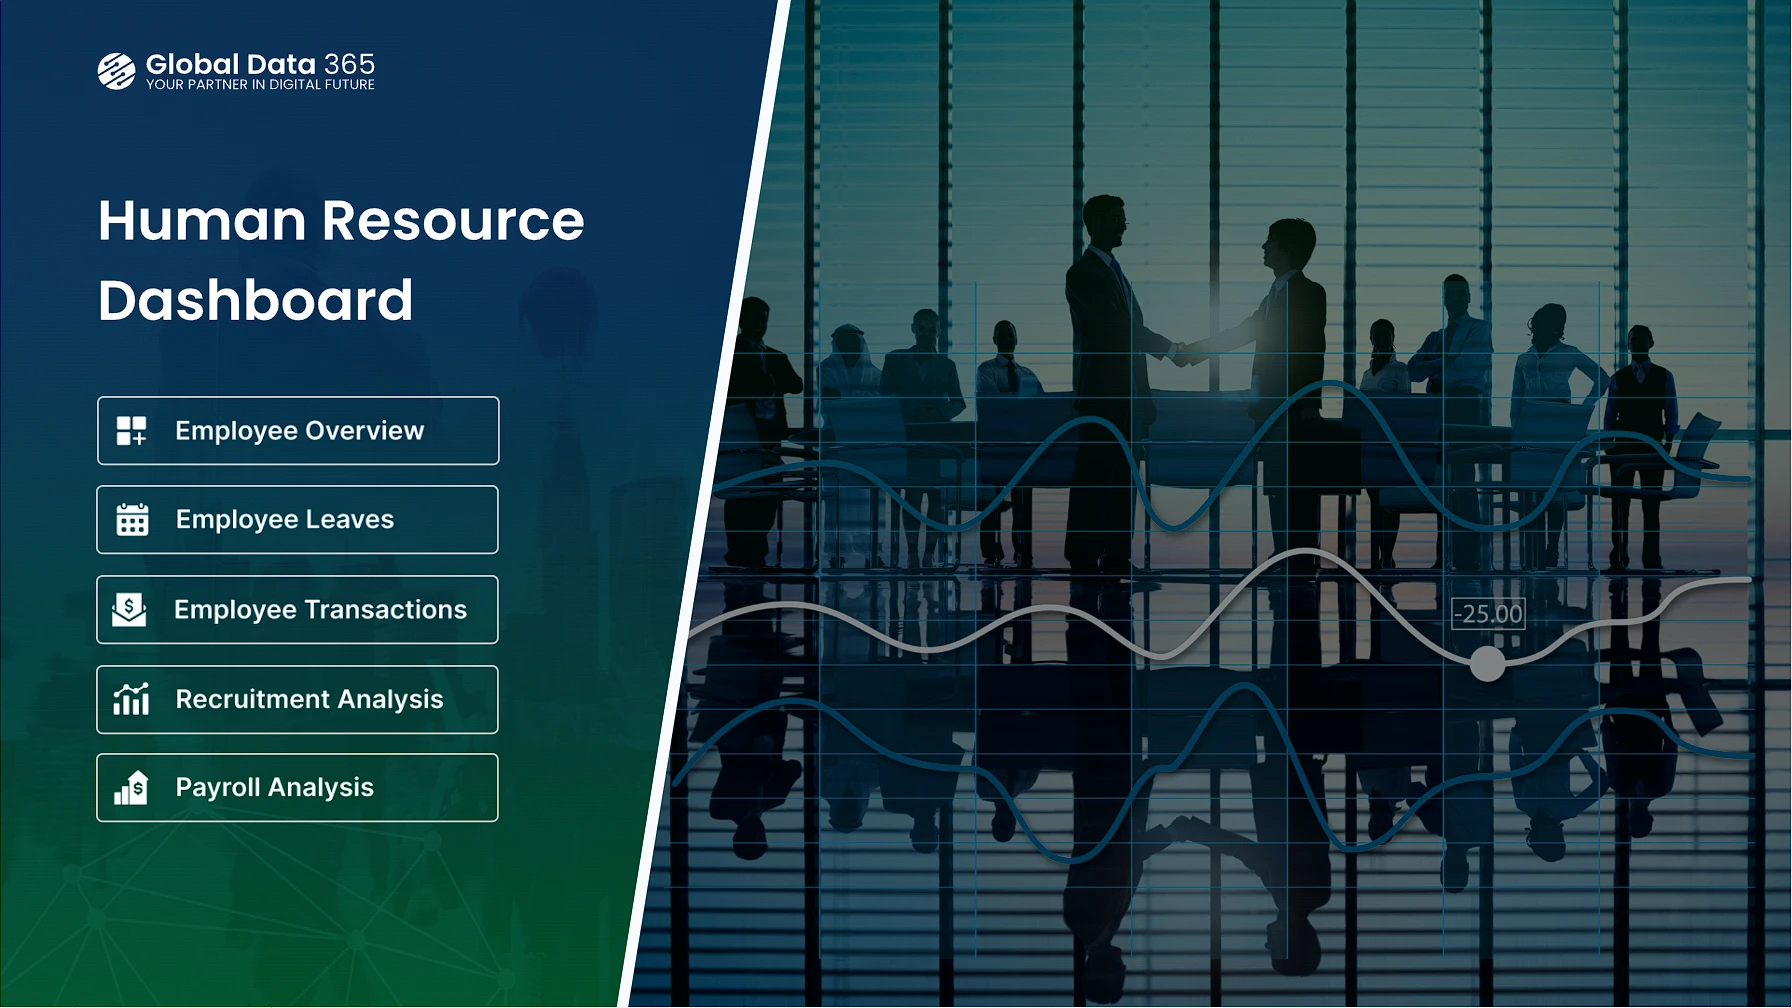
The front-page explore HR dashboard examples across five core pages with navigation buttons leading to specific pages: Employee Overview, Employee Leaves, Employee Transactions, Recruitment Analysis and Payroll Analysis.


The navigation buttons are typically placed at the side of the title page and are designed to be intuitive and user-friendly. These buttons can be used to jump to different pages within the Human Resources Dashboard Power BI.

Employee Overview

The HR Employee Overview dashboard tracks the HR dashboard metrics that matter most, with a template built around KPIs and visuals every HR team needs.


The KPIs include Headcount, New Hires, Attrition, Turnover Ratio and Average Age, offering insights into workforce size for better workforce optimization. Visual representations include Headcounts by Gender, City, Contract Type, Department, Age Group, and Job Position, facilitating performance analysis and demographic trends for informed decision-making for organizational growth with Power BI HR Data Dashboard.

hr dashboard power bi for employee overviewHR Employee Dashboard Overview in Power BI
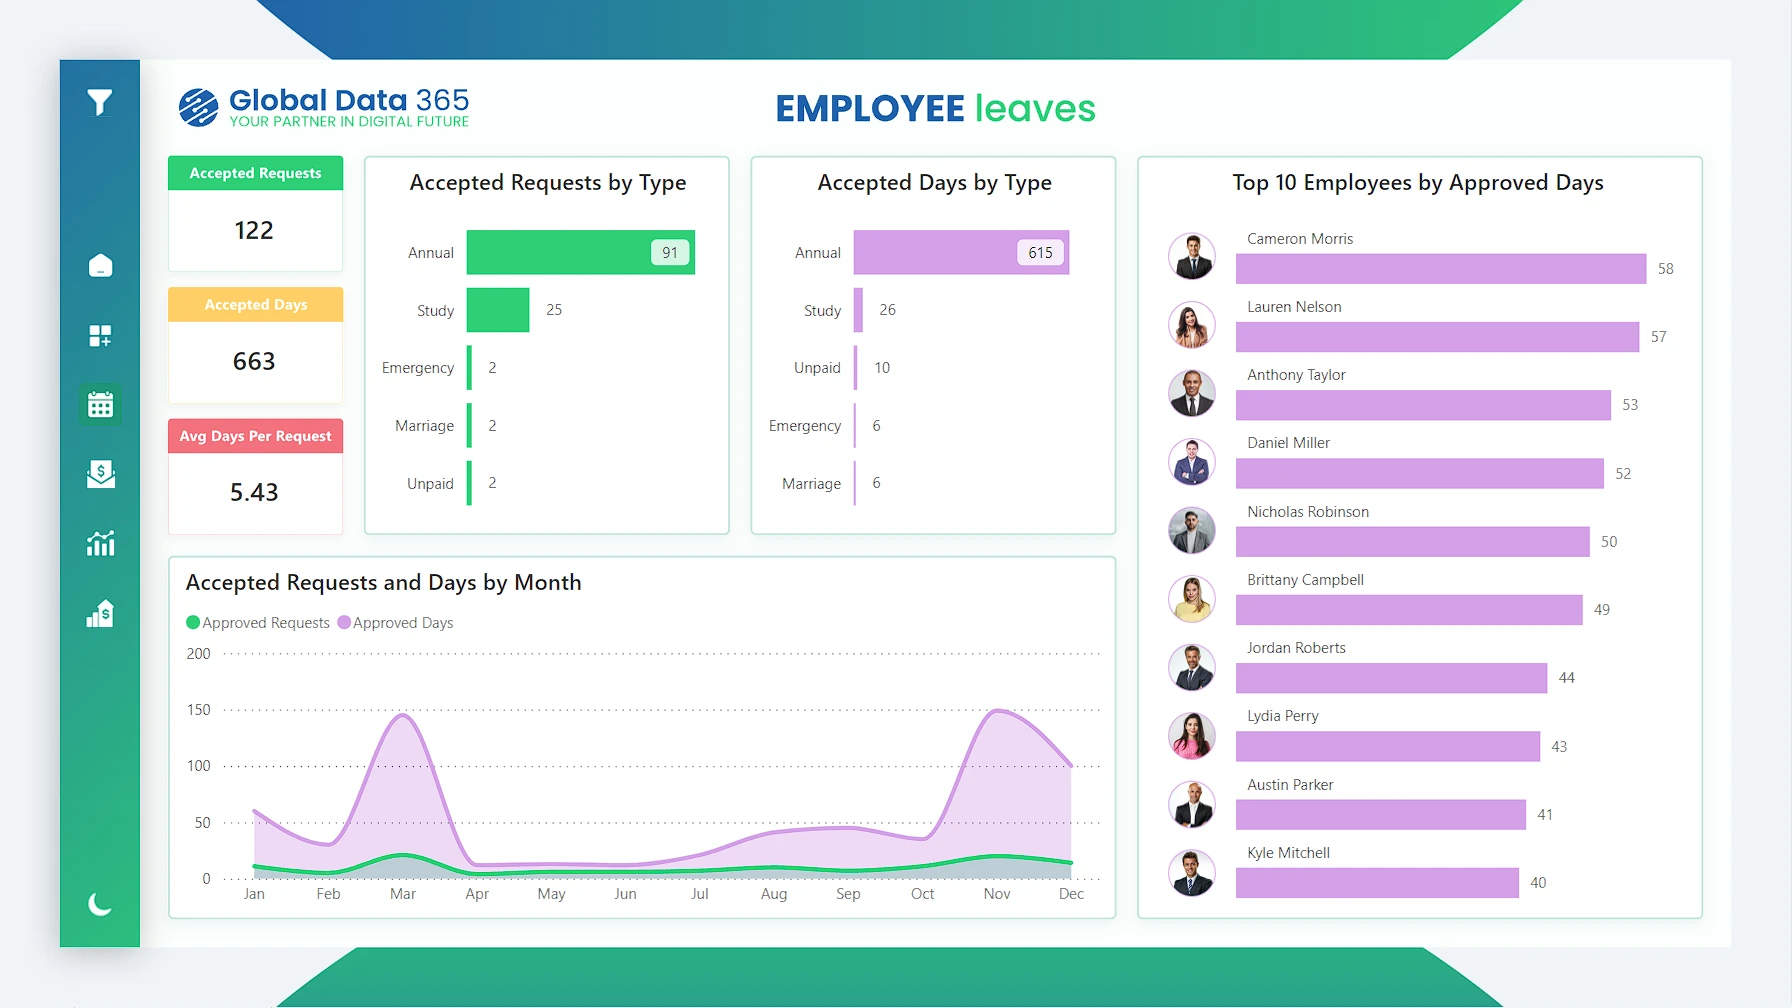
Power BI Employee Leaves Dashboard showing accepted leave requestspower bi hr dashboard for employee leaves management

Employee Leaves

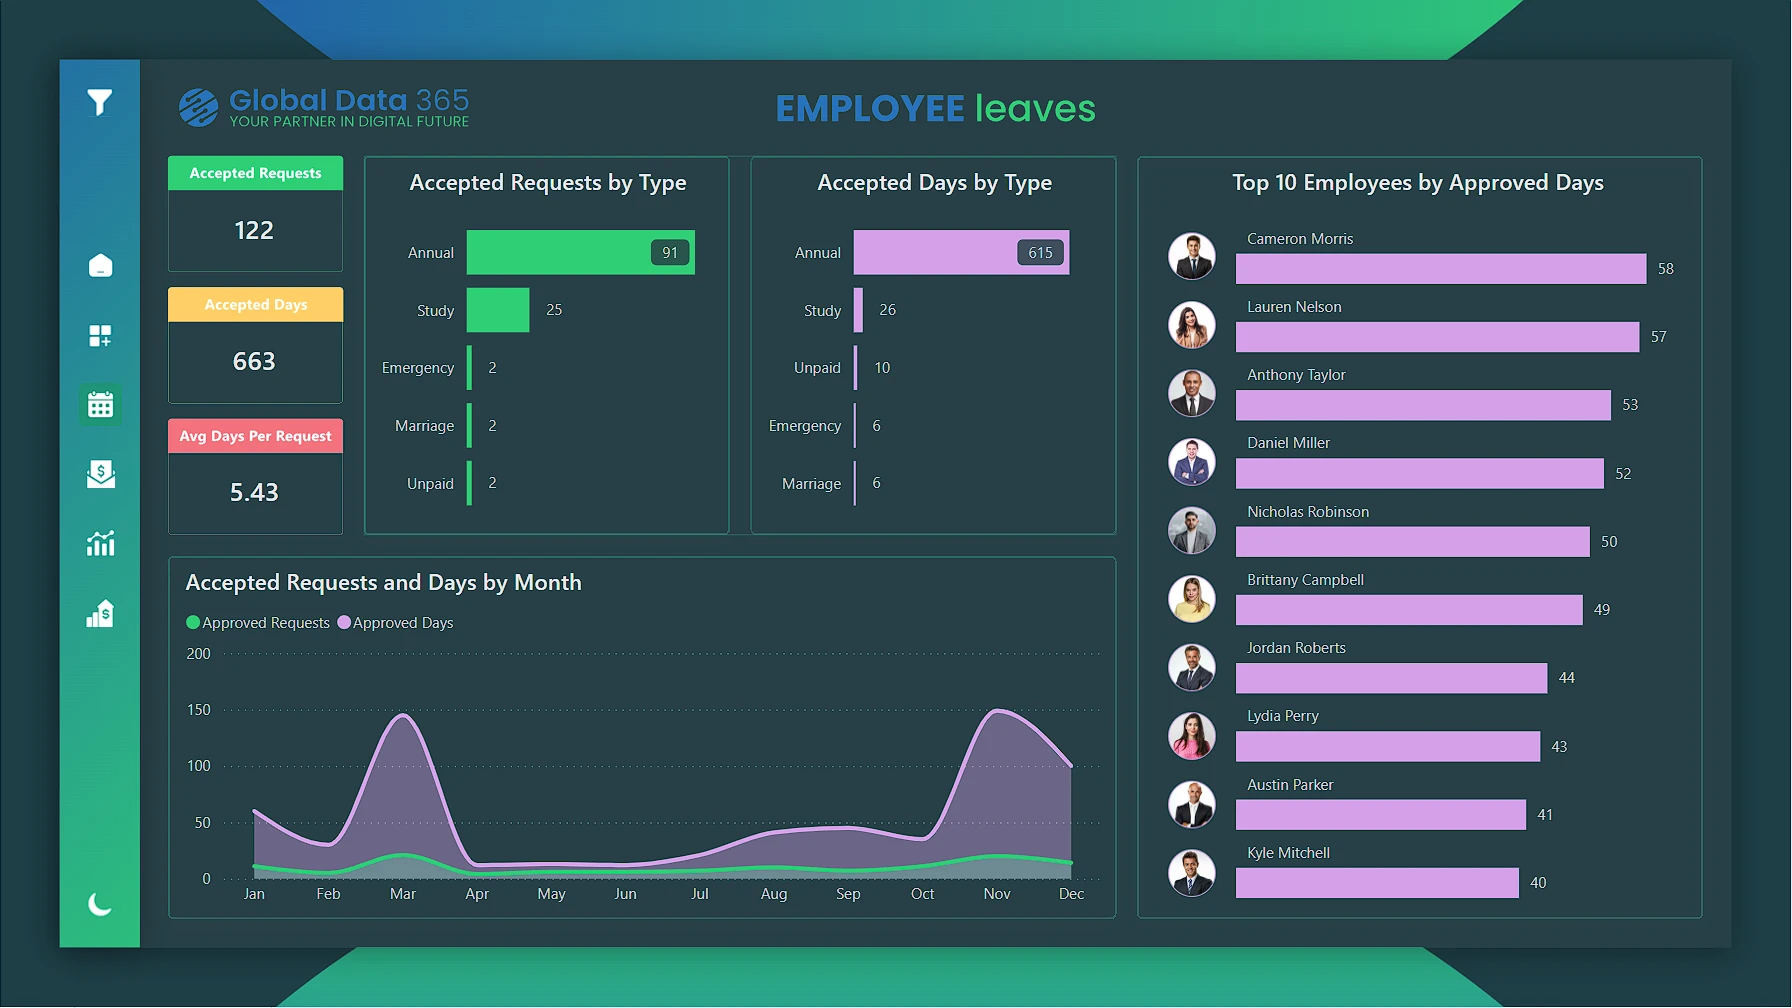
The Employee Leaves page, a dedicated HR leave dashboard provides a comprehensive overview of employee leave management.


The KPIs include Accepted Requests, Accepted Days, and Average Days per Request. Visual representations include Accepted Requests by Type, Accepted Days by Type, Top 10 Employees by Approved Days, to visualize leave patterns, identify trends in different leave types and pinpoint employees with significant approved leave, supporting effective leave management in HR dashboard report to ensure adequate staffing levels.

Employee Transactions

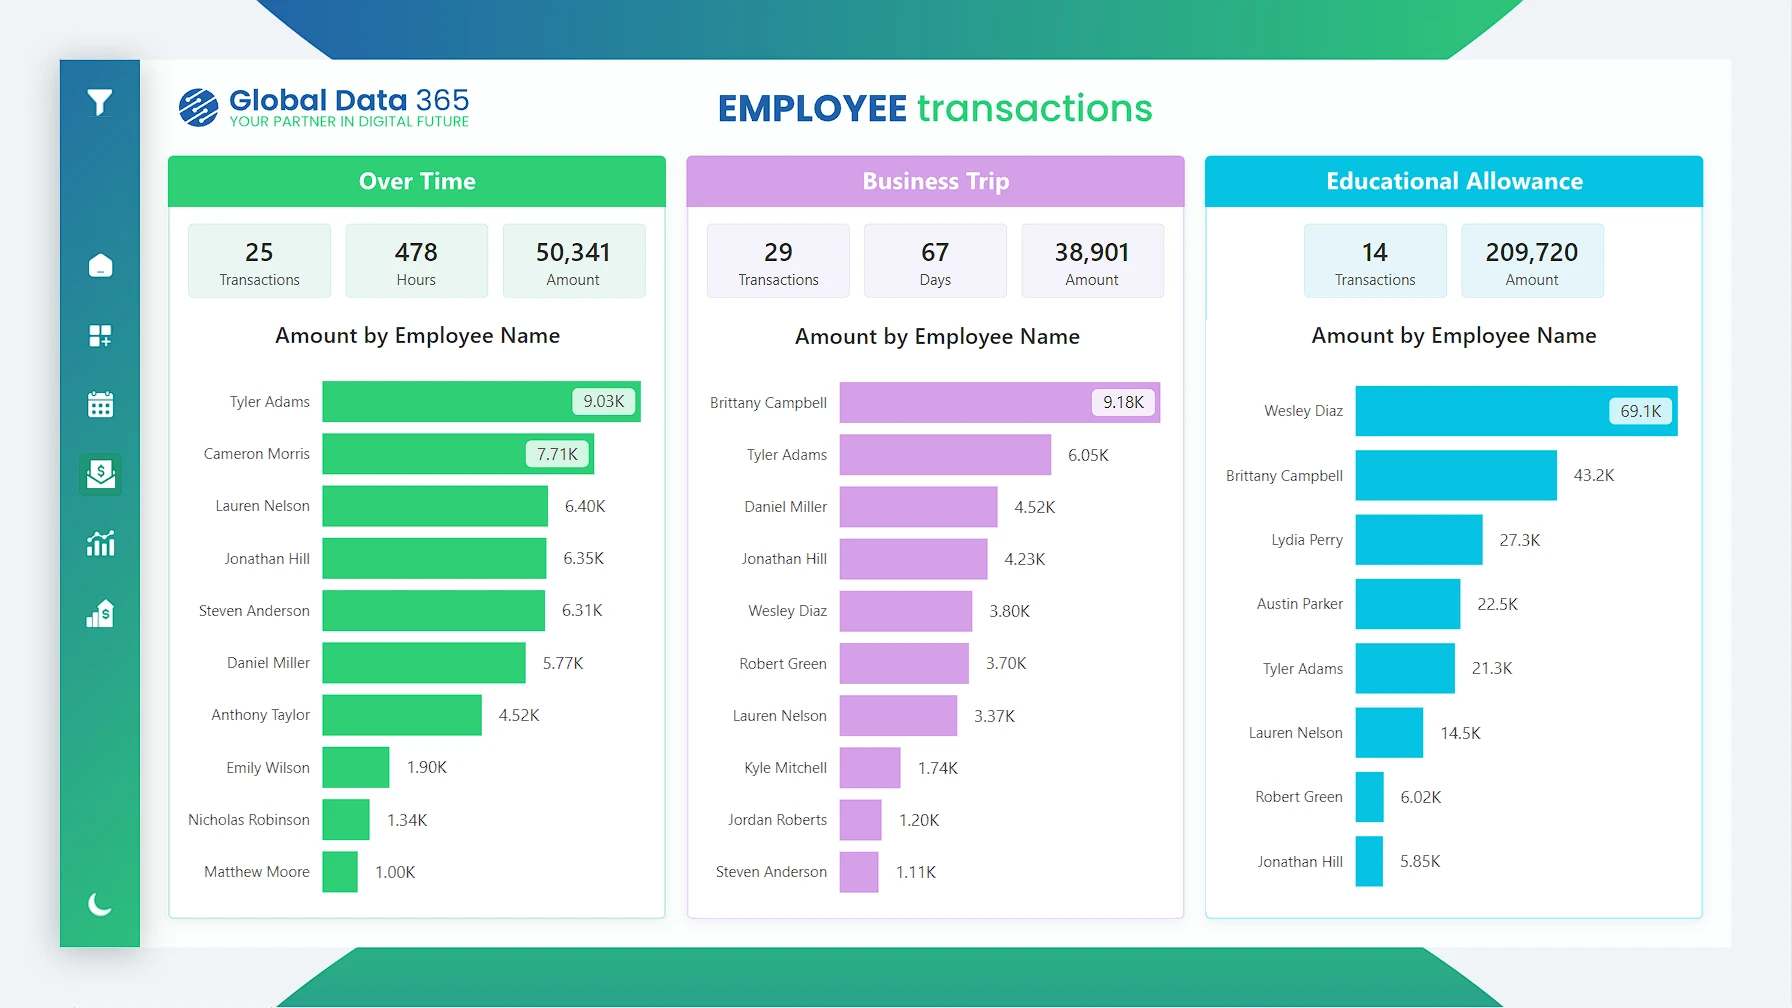
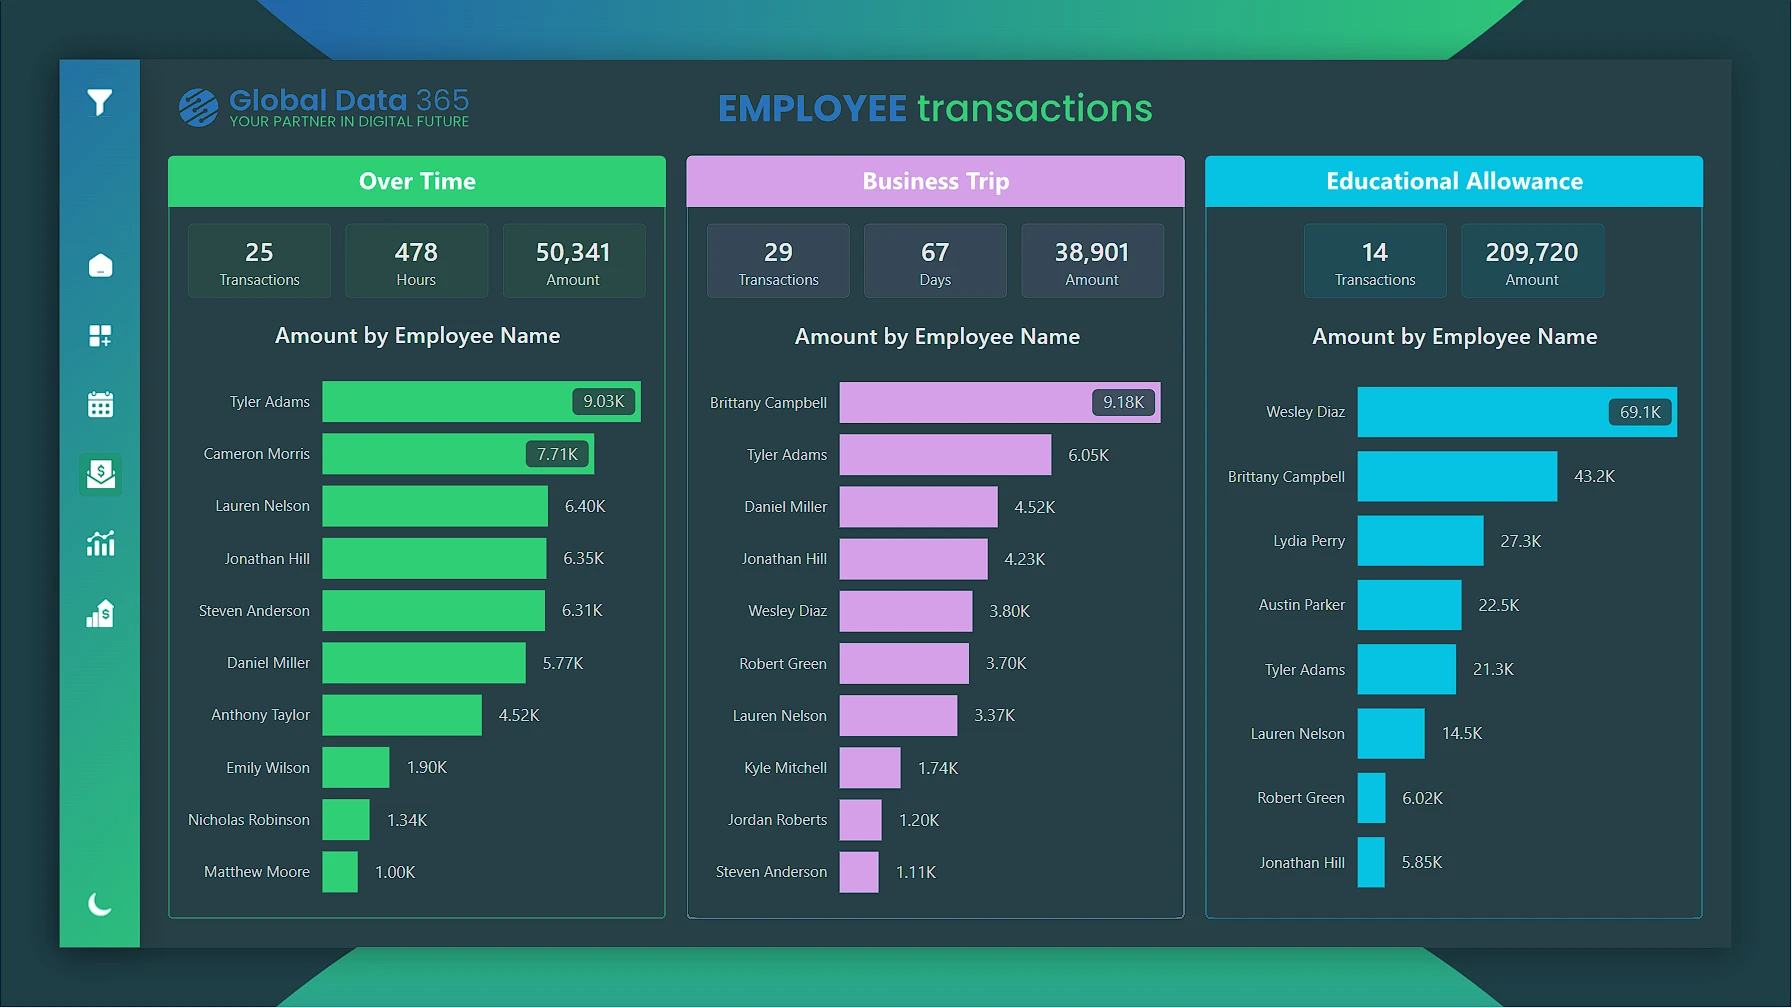
The Employee Transactions page on the dashboard provides a focused analysis of employee-related activities, offering deep insights into transactions.


The KPIs include Transaction Count and Amount for each category. Each visual showcases amounts by employee name, to enhance understanding of spending patterns and employee-specific transactions, facilitating informed decisions on resource allocation, budget management, and overall employee support for better HR management with our HR dashboard software powered by Power BI.

Power BI Employee Transactions HR Dashboard showing transactionpower bi hr dashboard employee transactions template
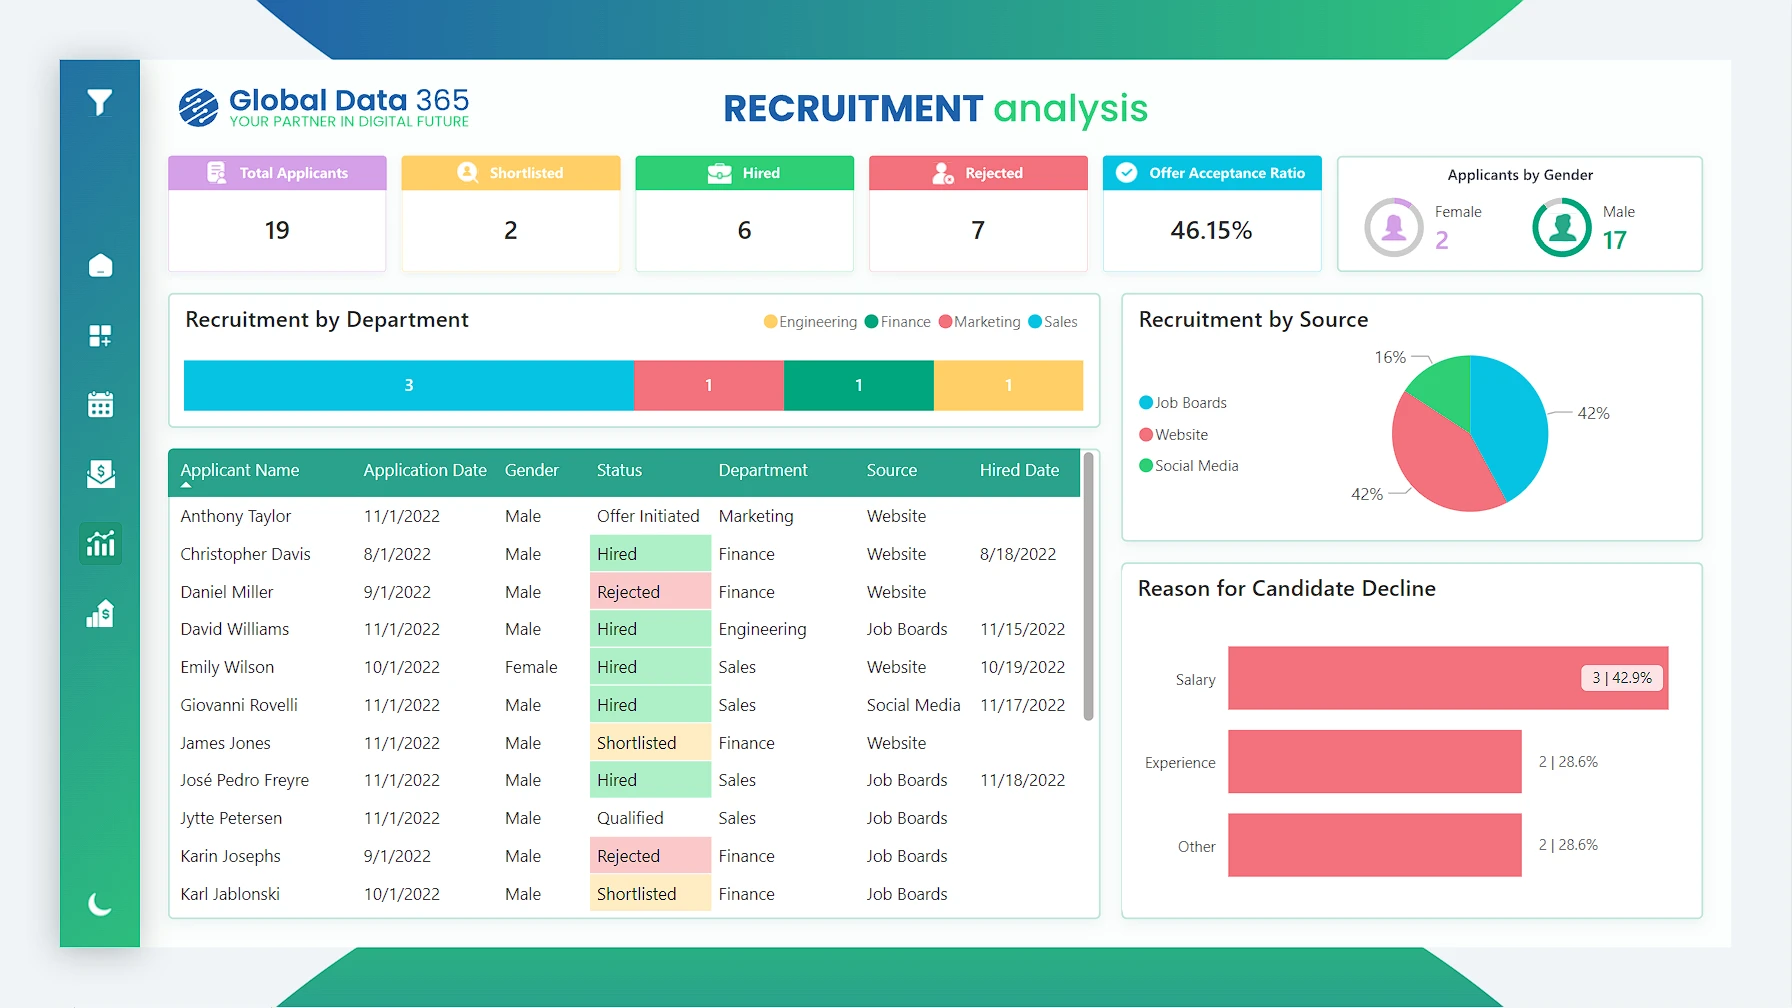
Power BI HR Dashboard Recruitment Analysis reportHR Recruitment Analysis Dashboard Power BI

Recruitment Analysis

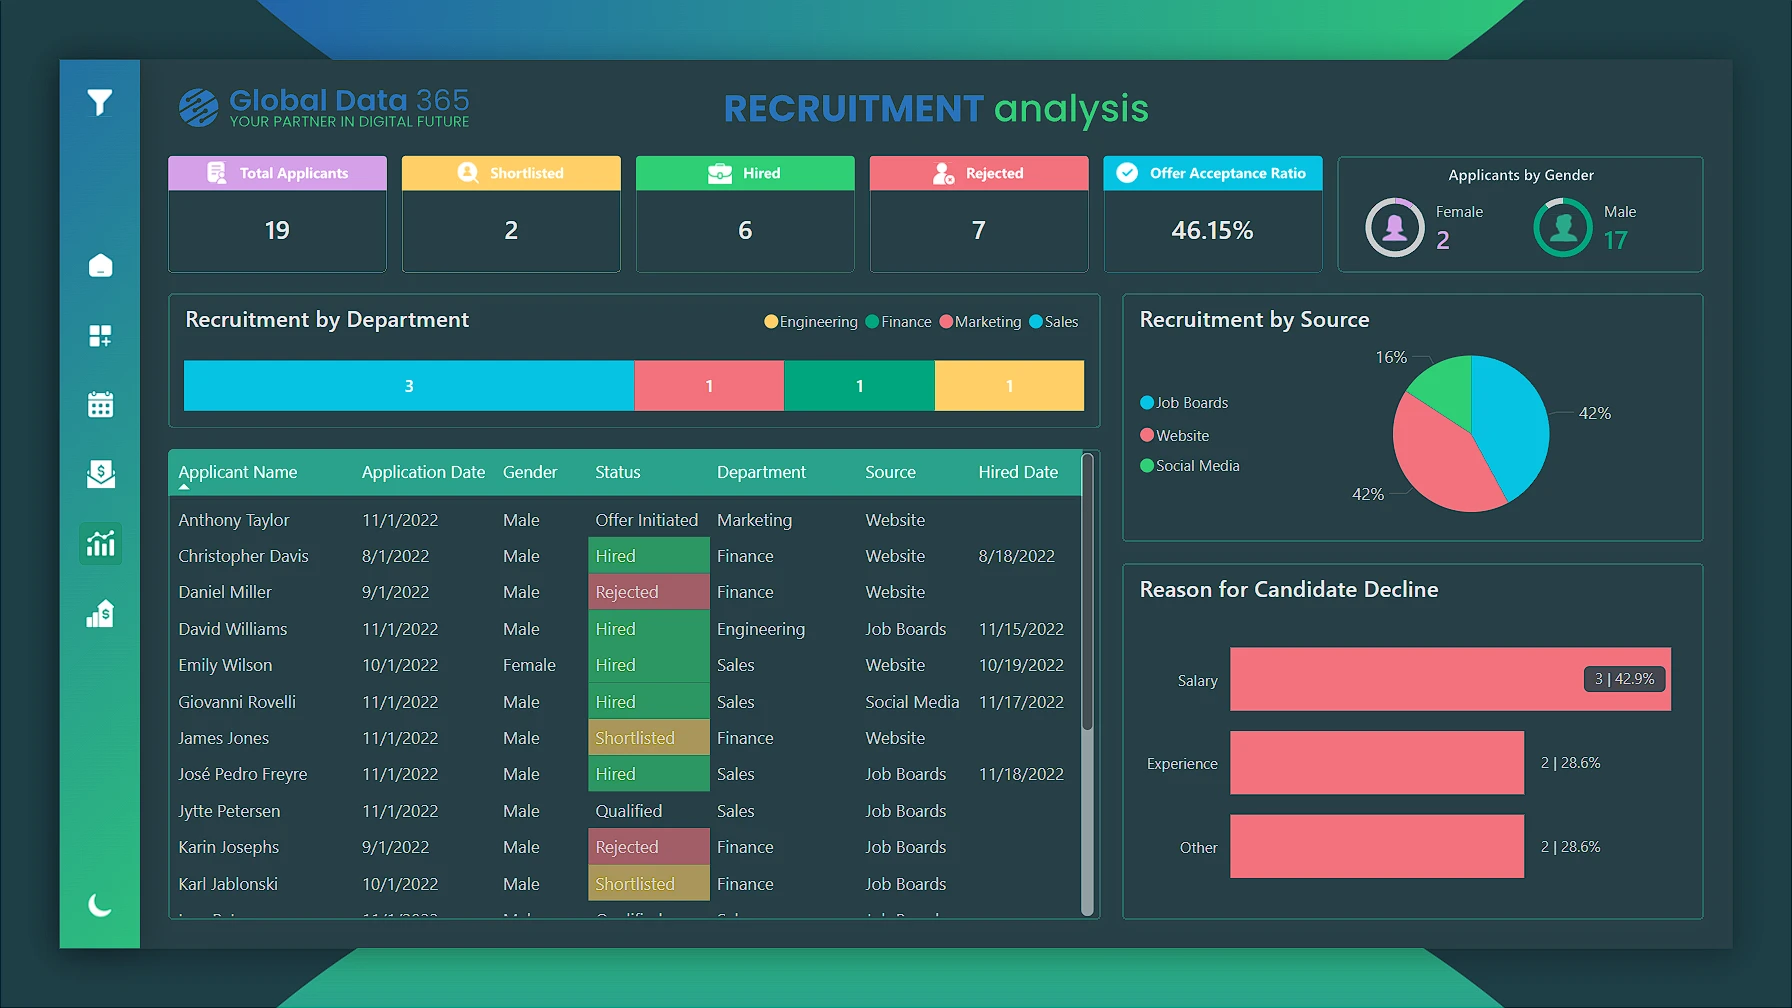
The Recruitment Analysis page, our HR dashboard recruitment module provides a detailed overview of the hiring process and tracking of recruitment operations.


The KPIs include Total Applicants, Shortlisted, Hired, Rejected, and Offer Acceptance Ratio. The visuals offer insights into recruitment trends, such as Recruitment by Department, Applications by Gender, Recruitment by Resource, and Reasons for Candidate Decline, facilitating informed decisions on talent acquisition and workforce planning. Additionally, the table displays Applicant Info and their application methods, providing a clear overview of the recruitment pipeline in Power BI using a HR Management Dashboard.

Payroll Analysis

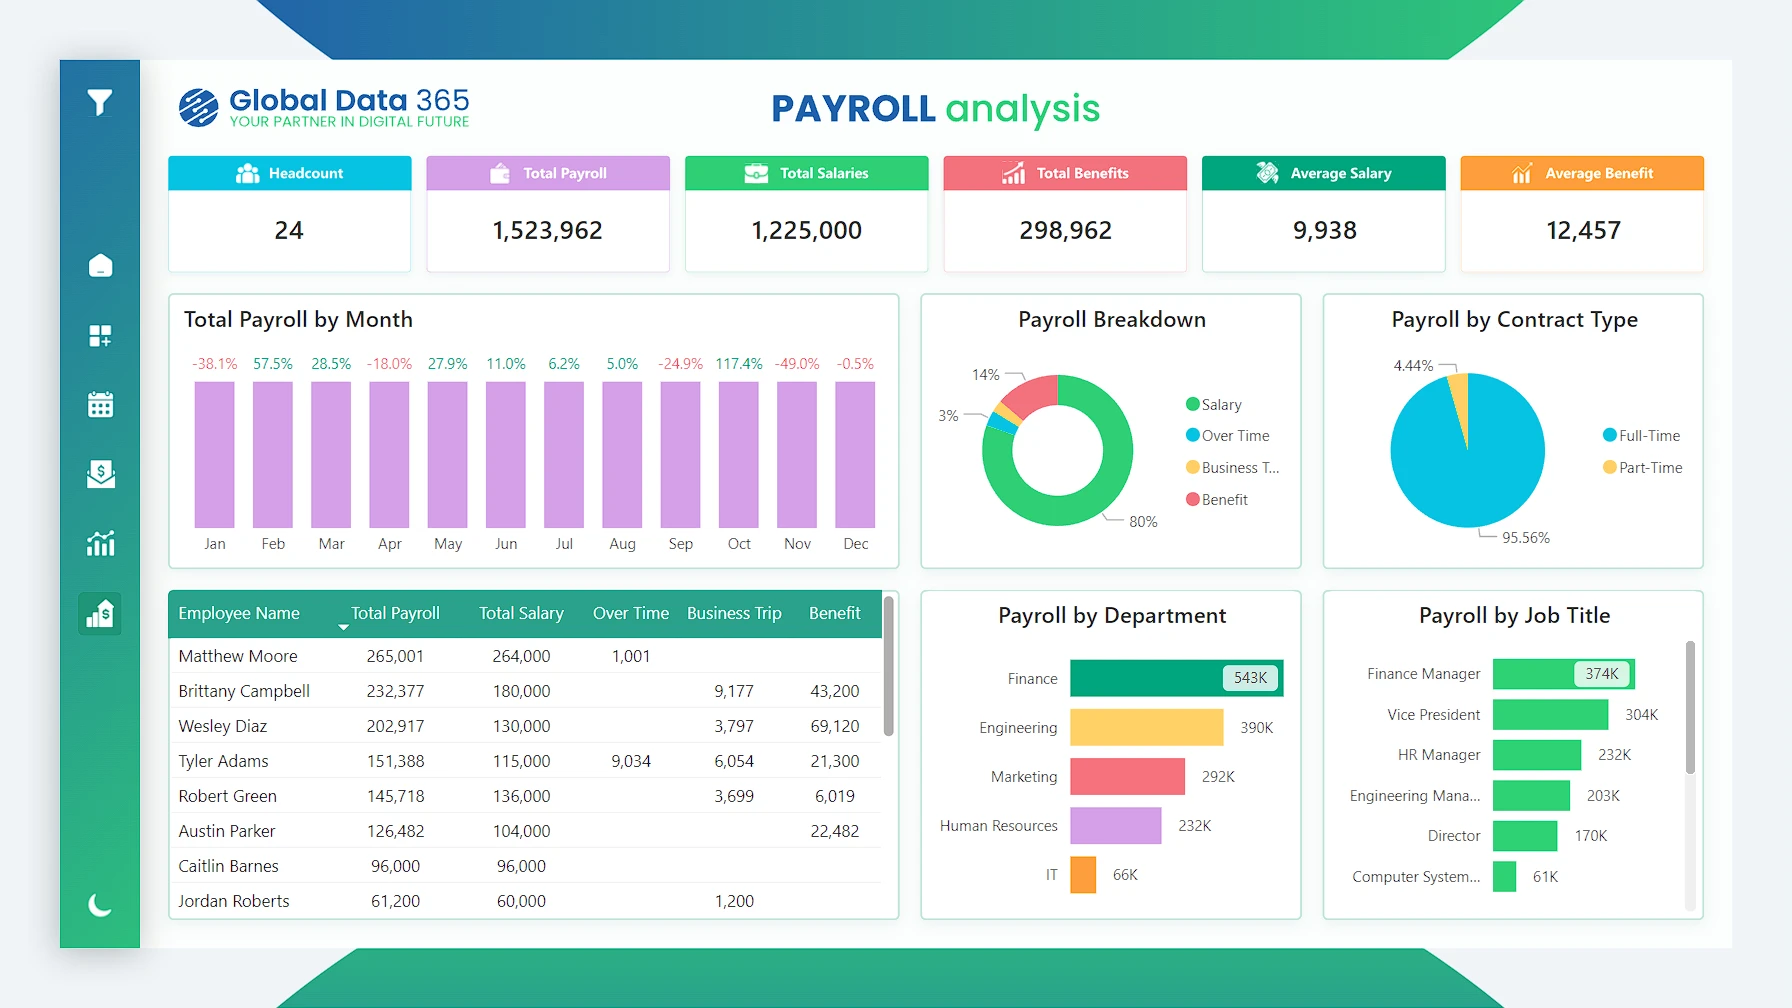
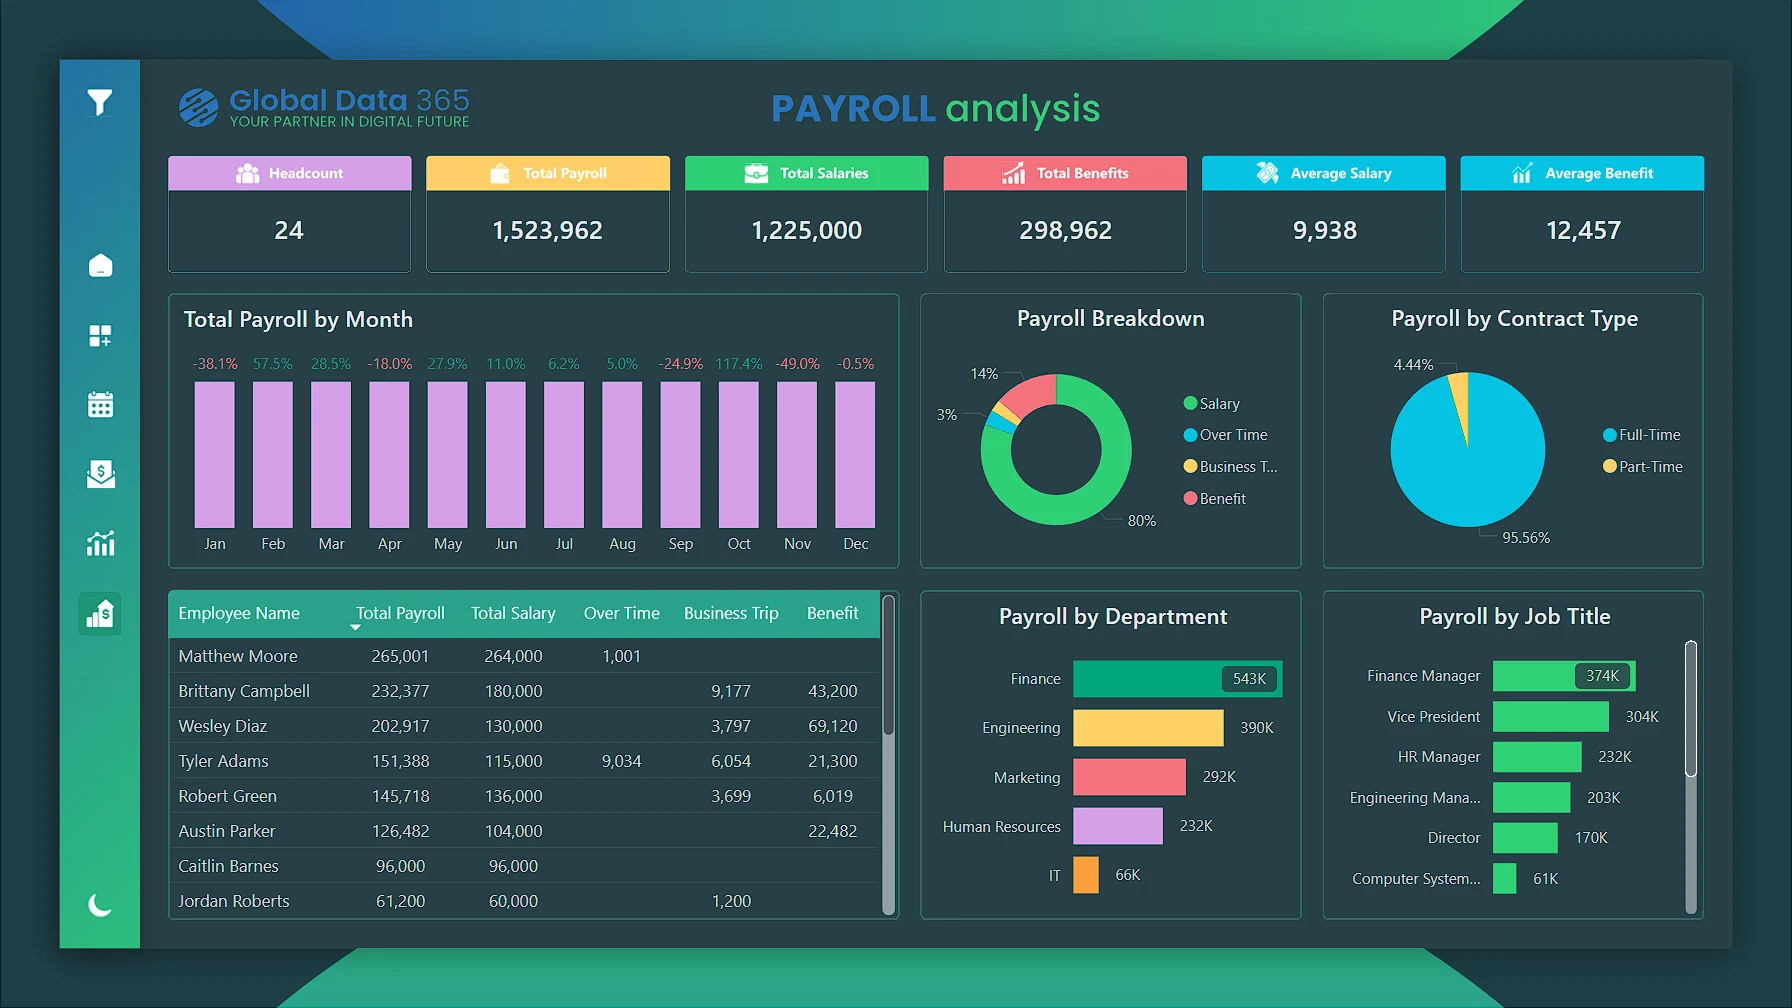
The Payroll Analysis page, a dedicated HR payroll dashboard, gives quick overview of payroll management, enhancing the tracking of employee compensation and benefits.


The KPIs include Headcount, Total Payroll, Total Salaries, Total Benefits, Average Salary, and Average Benefit. The visuals offer insights into payroll trends, including Total Payroll by Month, Payroll by Contract Type, Payroll by Department, Payroll by Job Title, and a detailed Payroll Breakdown. Additionally, a table presents an overview of payroll details, facilitating budgeting, resource allocation and overall compensation strategies with HR Dashboard Analytics.

Payroll Analysis Power BI for HR DashboardHR Dashboard Power BI Payroll Analysis report
Power BI Dashboard

Get Your First Power BI Dashboard
Built In 2 Weeks

Our analysts have delivered 200+ dashboards across retail, manufacturing, healthcare, and finance teams.

Trusted By 500+ Businesses
4.9/5.0 Client Rating
Fast Response

More than 50+ companies trusted us to implement Power BI and transform their data into powerful insights

Frequently Answered Questions

A Human Resources or HR Dashboard is a powerful tool that provides a visual overview of key HR metrics, such as employee turnover, recruitment progress, employee satisfaction, and payroll analysis. It is used for various purposes, from an HR dashboard for management to an HR dashboard for employees and recruitment teams. For CEOs and board of directors, it offers strategic insights to align HR operations with business goals.

The cost varies and depends on the features, customization options, and the size of your organization. Whether you're building the dashboard for management, for employees, or a specific purpose like recruitment, the price can range from a basic package to advanced analytics with integration into existing systems like HR Power BI Dashboard. Contact us for a tailored quote based on your specific needs.

Yes, the HR dashboard design is fully customizable. We can adjusts colors, fonts, layout structure and page format to match your company's branding, and the number of pages, charts and KPIs can be expanded to fit your organization's specific needs. Whether the dashboard is built for employees, department managers, or the board of directors, the design is tailored to surface the most relevant HR dashboard format insights for your audience.

The power bi dashboard can be extended into an HR compliance dashboard to monitor policy adherence, certification expiries, and audit-readiness metrics alongside your existing headcount and payroll data — just let us know your compliance requirements when we scope your build.

The implementation time for it depends on the complexity of the data and the customizations required. A basic dashboard may take less than 3 days, while a comprehensive one with advanced analytics and features could take up to 7 working days. We’ll work with you to establish a clear timeline based on your specific needs.

HR Analytics involves the collection and analysis of workforce data to make informed decisions. A dashboard in Power BI visualizes this data, offering insights into areas such as recruitment, employee performance, turnover rates, and more. Whether it's an HR Dashboard for recruitment or a dashboard for the CEO and board of directors, these tools are crucial for making data-driven decisions that enhance overall HR operations.

The implementation of a Power BI Dashboard begins with discussing your requirements and receiving the necessary data from you. Based on that, we conduct research and collaborate with you to finalize a layout. Next, we design the entire dashboard in Figma for your approval. Once approved, we replicate the design in Power BI, ensuring it matches the Figma layout. Finally, we add all the required functionalities. Throughout the process, we gather your feedback at each stage to ensure the final product meets your expectations.

What Our Customers Has to Say About Us

global data 365
Get Your Custom Dashboard