Sales Dashboard Power BI
for D365 Finance & Operations(F&O)
Sales Dashboard Power BI for D365 Finance & Operations(F&O)
Transform Your Sales reporting with Our Modern and Interactive Power BI Sales Dashboard for D365 F&O, to have
easy sales control with powerful visuals for informed decision-making.
Streamlined operations and enhanced efficiency with Power BI Dashboard for D365 F&O.
easy sales control with powerful visuals for informed decision-making.
Streamlined operations and enhanced efficiency with Power BI Dashboard for D365 F&O.
Try the D365 F&O Sales Dashboard Yourself
Get Personalized Sales Dashboard
for D365 F&O
Global Data 365 simplifies reporting by automatically extracting and organizing your D365 F&O data into a centralized analytics model.
Sales Dashboard Modules
for D365 Finance & Operations
From detailed invoicing trends to real-time sales order pipeline tracking, unlock actionable insights that help you monitor performance and make faster, data-driven decisions across your entire sales cycle with sales analytics for D365 F&O.
Sales Invoices
Invoice-level analytics & trends
Overview
Customers
Items
Details
Cube
Analytics
Influencers
Overview
Customers
Items
Details
Cube
Analytics
Influencers
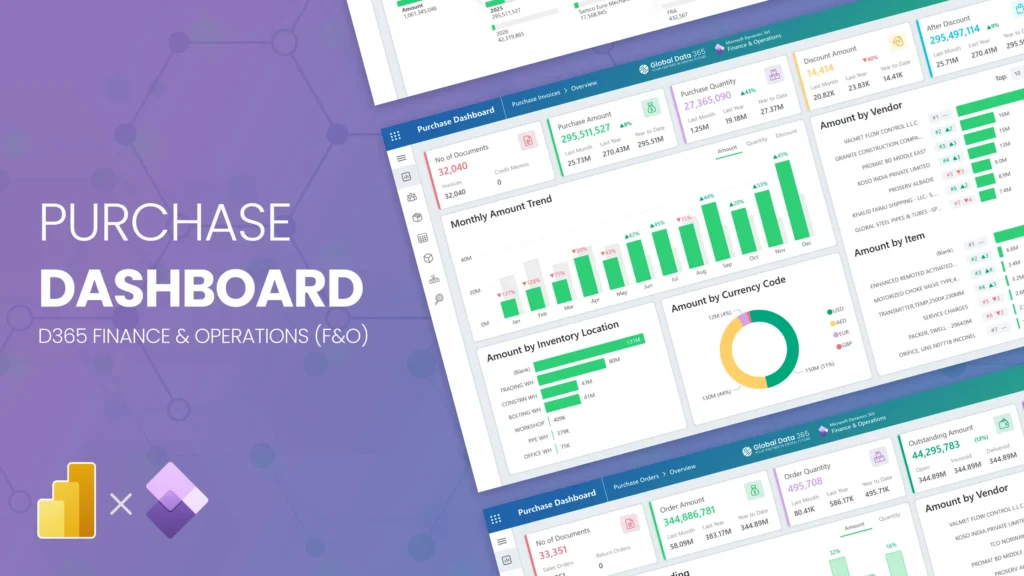
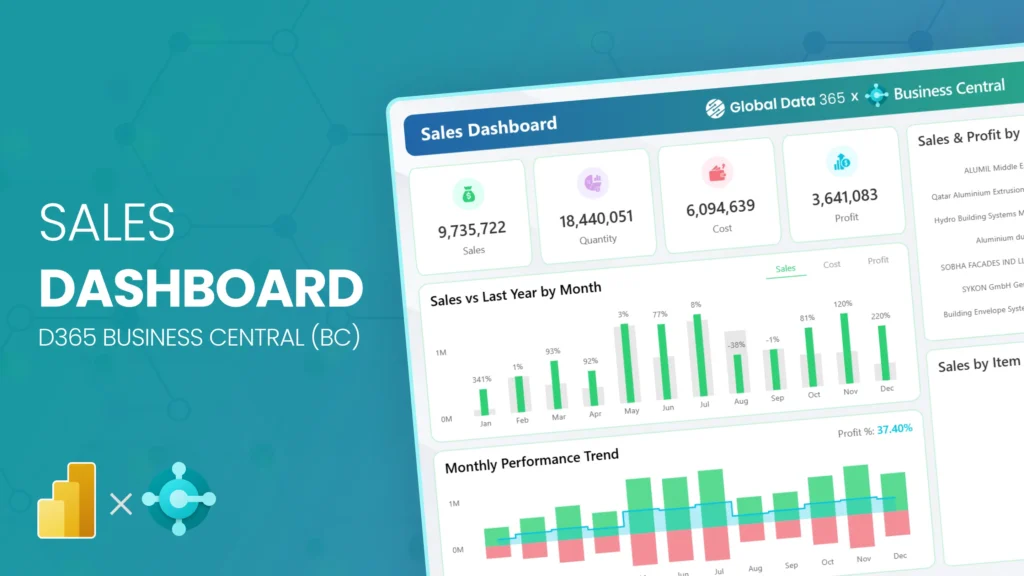
Track every posted sales invoice in D365 F&O from total invoice count and billed amount to monthly trends, discounts, and average unit pricing across customers and items.
- KPIs: No of Documents, Sales Amount, Quantity Sold, Discount Amount, Avg Unit Price
- Monthly Sales Trend with YoY % change — by Sales, Quantity, or Discount
- Sales by Customer (Top N ranking with rank movement)
- Sales by Item — identify highest-revenue products
- Sales by Inventory Location & Currency Code breakdown
Sales Orders
Order pipeline & fulfillment tracking
Overview
Customers
Items
Details
Cube
Analytics
Influencers
Overview
Customers
Items
Details
Cube
Analytics
Influencers
Monitor your entire sales order pipeline in D365 F&O from total order volume and outstanding amounts to monthly order vs outstanding comparisons and fulfillment performance.
- KPIs: No of Documents, Order Amount, Order Quantity, Outstanding Amount and Quantity
- Monthly Orders vs Outstanding — Amount & Quantity view with % outstanding
- Amount by Customer — ranked by total order value
- Amount by Item — top items driving order revenue
- Amount by Inventory Location & Currency Code split
What Our Customers Have to Say About Us
Working with Global Data 365 has been a fantastic experience. Their Power BI reports have completely transformed how we analyze and use our data. The insights are clear, actionable, and have made decision-making so much easier for our team.

Tres Nelson
Manager BI - Signature Systems
Global Data 365 delivered an exceptional inventory dashboard for Baker Hughes. The Power BI solution provided real-time insights, streamlined inventory management, and improved decision-making across our operations.

Alan Siqueira
Inventory Manager - Baker Hughes
Thanks to Global Data 365 for their outstanding Power BI service. We are grateful for the opportunity to work with Global Data 365’s team of talented and committed individuals

Mohammad Arshad
Financial Control & Reporting Assistant Manager - PepsiCo
It was a genuine pleasure working with Global Data 365. They consistently demonstrated patience, professionalism, and attentiveness to my requirements. Their expertise in Power BI is impressive; they quickly comprehends the concepts I aim to communicate and promptly provides effective solutions.

Rana Yaseen
Accounting Manager - Boston Scientific
We are incredibly impressed with the sales dashboard designed for us on Power BI by Global Data 365. The dashboard has provided us with valuable real-time insights into our sales performance. We would highly recommend their services to anyone looking to take their sales analysis to the next level.

Ahmad Hammad, MBA
BI & ERP Specialist at SYH Retail - IKEA
The supply chain dashboard on Power BI has revolutionized the way we manage our operations, providing real-time insights that enable us to optimize for maximum efficiency. They were highly professional and responsive throughout the process, and we highly recommend their services.

Mahmoud Mohsen
IT Administrator - Alif
FAQs on Sales Dashboard For D365 F&O
A Sales Dashboard for Dynamics 365 Finance & Operations (F&O) is a Power BI reporting solution that connects directly to D365 F&O sales data to deliver real-time sales analytics in a single interactive view. Unlike standard D365 F&O sales inquiry screens, a dedicated F&O sales dashboard visualizes KPIs such as total sales amount, quantity sold, discount amount, average unit price, and outstanding order value across customers, items, inventory locations, and currency codes. It gives sales managers and operations teams a consolidated, drill-through view of the entire D365 F&O sales cycle, from order creation to invoice posting, without manual data exports.
A Power BI Sales Dashboard for D365 F&O tracks two core sets of KPIs. For sales invoices: number of posted invoice documents, total billed sales amount, quantity sold, discount amount, and average unit price, with monthly YoY trend analysis by sales, quantity, or discount. For sales orders: total order count, order amount, order quantity, outstanding amount, and outstanding quantity, with monthly orders vs. outstanding comparisons showing percentage of unfulfilled pipeline. Both modules support Top N customer and item rankings with rank movement tracking, sales by inventory location, and currency code breakdowns, giving D365 F&O users a complete picture of both realized revenue and open order pipeline in one dashboard.
A D365 F&O Sales Dashboard is purpose-built to extract and visualize data directly from Microsoft Dynamics 365 Finance & Operations tables, specifically the sales invoice journal and sales order module, including D365 F&O-native fields like inventory location, currency code, document status, and order fulfillment stage. A generic Sales Department Dashboard, by contrast, may pull data from any CRM or flat-file source and focuses on pipeline stages or rep activity metrics without ERP-native integration. The D365 F&O Sales Dashboard handles multi-legal entity structures, item-level margin visibility, and the distinction between posted sales invoices and open sales orders natively, making it the correct reporting tool for organizations running Dynamics 365 F&O who need accurate, automated D365 F&O sales reporting without manual reconciliation.
Yes, a D365 F&O Sales Dashboard built on Power BI tracks both sales orders and sales invoices as separate reporting modules with side-by-side comparison capability. The sales orders module shows total order amount alongside outstanding amount and quantity, letting operations teams monitor how much of the D365 F&O sales order pipeline has been fulfilled versus what remains open. The sales invoices module shows what has been posted and billed. Together, these two views provide a complete order-to-invoice conversion picture in D365 F&O, allowing sales and finance teams to identify fulfillment bottlenecks, outstanding order backlogs, and revenue recognition gaps, all within a single Power BI D365 F&O sales reporting environment.
Yes, the Power BI Sales Dashboard for D365 F&O supports full drill-down by customer and by item across both the sales invoice and sales order modules. Customer-level views include Top N customer rankings by sales amount or order value with rank movement indicators, showing which customers are growing or declining in spend. Item-level views identify the highest-revenue products and top-ordered SKUs directly from D365 F&O item master data. Additional filtering dimensions include inventory location and currency code, enabling multi-site and multi-currency D365 F&O sales analysis. Advanced analytics views add decomposition trees to break down any KPI by multiple dimensions and AI-powered key influencer visuals to identify the primary drivers of sales increases or drops.
D365 F&O sales data is extracted into Power BI through several integration methods: OData entities exposed by D365 F&O (such as sales invoice headers/lines and sales order entities), Azure Synapse Link for Dataverse (formerly BYOD/Export to Data Lake), or pre-built data connectors that map D365 F&O sales tables into a centralized analytics model. A well-architected D365 F&O sales reporting solution normalizes posted invoice data, open order data, customer master records, and item data into a unified Power BI data model, enabling the Sales Dashboard to refresh automatically and reflect near-real-time D365 F&O sales activity. This eliminates the need for manual sales report extracts from D365 F&O and ensures that KPIs like outstanding order amounts and discount trends are always current.
D365 F&O standard workspaces provide basic transactional views, such as the Sales Order Processing and Inquiry workspace, that are designed for day-to-day operational tasks like order entry and invoice lookup. They offer limited visual analytics, no cross-dimensional trend analysis, and no native ability to compare sales invoice totals against outstanding order pipelines in a single view. A Power BI Sales Dashboard for D365 F&O, by contrast, transforms the same underlying D365 F&O sales data into interactive visuals with monthly YoY trend charts, Top N customer and item rankings with rank movement, actuals vs. outstanding pipeline comparisons, and AI-powered influencer analysis. For organizations that need strategic D365 F&O sales analytics, beyond what standard inquiry screens provide, a dedicated Power BI sales dashboard is the natural extension of D365 F&O's reporting capabilities.
Related Resources