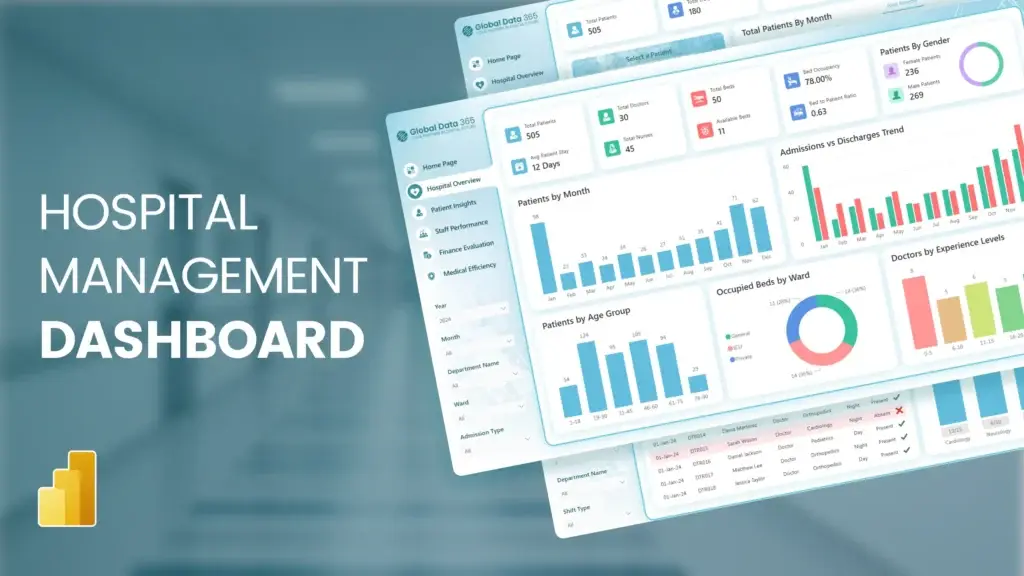
Hotel Management Dashboard
The Hotel Management Dashboard in Power BI provides real-time insights into key operational and financial metrics, helping you monitor revenue, occupancy, staff and guest efficiency.
With a comprehensive view of room revenue, guest demographics, cost analysis and satisfaction scores, this hospitality dashboard empowers you to make data-driven decisions, enhance guest experience and optimize profitability across locations.
Experience Live Interaction With Hotel Management Dashboard.
Elevate Your Hotel Operations with Analytics
Let’s create a dashboard for hotel management tailored to your needs to optimize your operations and guest experience!
Transform Your Hotel Management Dashboard for Smarter Hospitality Insights
Take control of your hospitality operations with our Power BI Hotel Management Dashboard sample, your key to smarter decisions and improved performance.
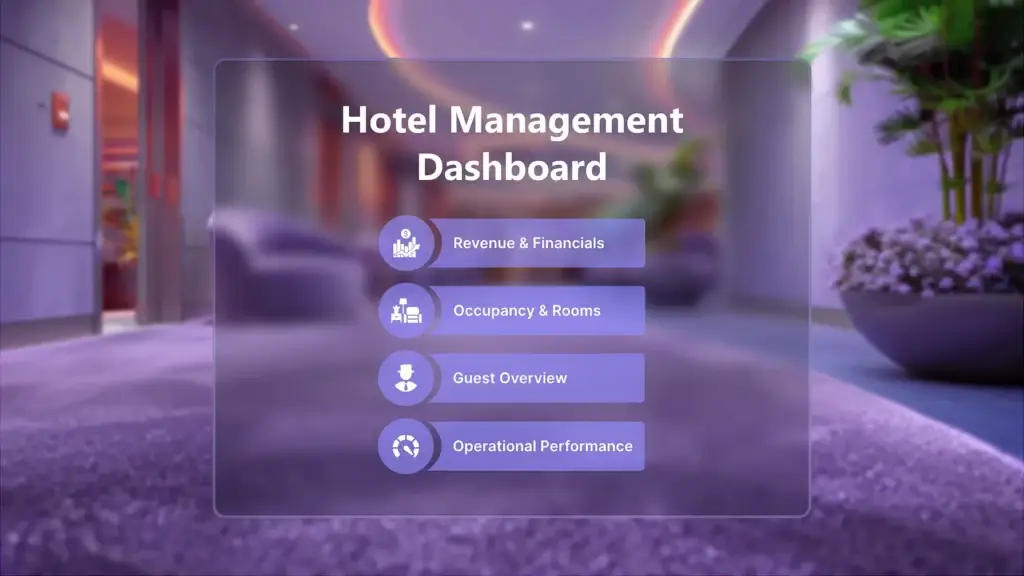
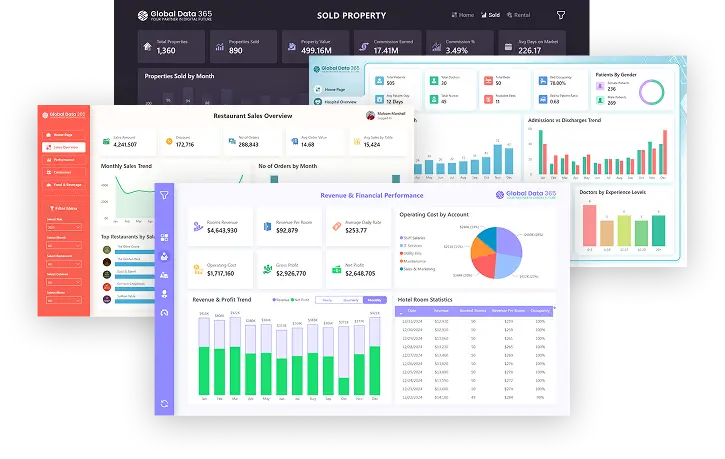
Hotel Management Dashboard
The front page of the Power BI Hotel Management Dashboard sets the stage for smart, data-driven hospitality management.
Effortlessly navigate between Revenue & Financials, Occupancy & Rooms, Guest Overview, and Operational Performance to monitor and manage critical aspects of hotel performance. Gain real-time insights, enhance guest satisfaction, and drive smarter business decisions with this powerful and user-friendly dashboard.
Revenue & Financial Performance
The Revenue & Financials Dashboard page provides a comprehensive snapshot of the financial health of hotel operations.
It highlights room revenue, revenue per room, average daily rate, operating cost and profitability metrics such as gross profit and net profit. With visual insights into monthly revenue and profit trends, cost distribution by account, and detailed hotel room statistics, this dashboard empowers management to track performance, control costs, and maximize profitability. The Hotel Revenue Dashboard is an essential tool for evaluating financial strategies and enhancing overall revenue management.

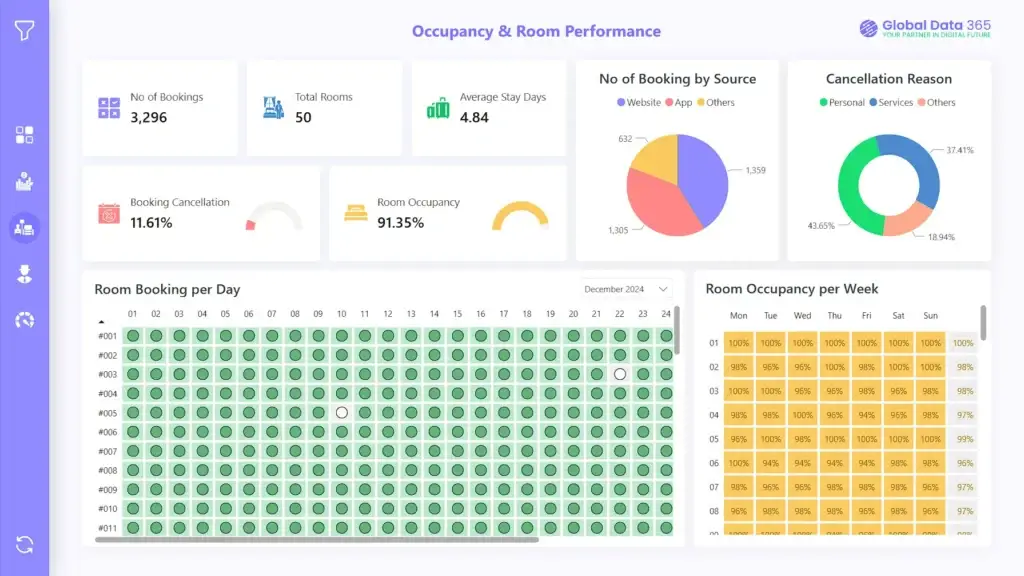
Occupancy & Room Performance
The Occupancy & Rooms Dashboard page provides an in-depth overview of key insights on no. of Bookings, Room Occupancy and Cancellation Ratios.
This dashboard for hotel management highlights the total number of bookings, average stay duration, and room occupancy rates, offering a clear view of overall performance. It breaks down booking across different platforms and identifies key cancellation reasons. With detailed metrics on daily room bookings and weekly occupancy trends, the hotel booking dashboard enables management to manage room availability and reduce cancellations with data-driven insights.
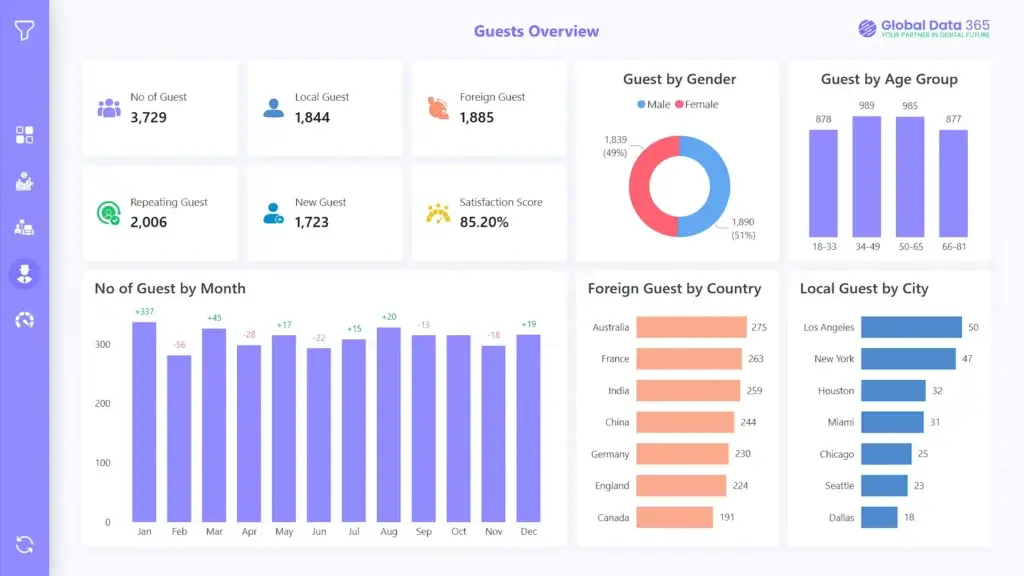
Guest Overview
The Hotel Guest Overview dashboard page offers in-depth view of guest trends, satisfaction, and demographics for strategic decision-making in the hospitality industry.
This guest overview analytics showcases key metrics such as total guests, local and foreign guest, new and repeating guests, and overall guest satisfaction score. Detailed visualizations break down guests by gender, age group, country and city, helping hotels understand their customer base. Monthly trends and geographic insights empower hotels to optimize guest experiences and enhance service strategies based on data-driven guest behavior analysis.
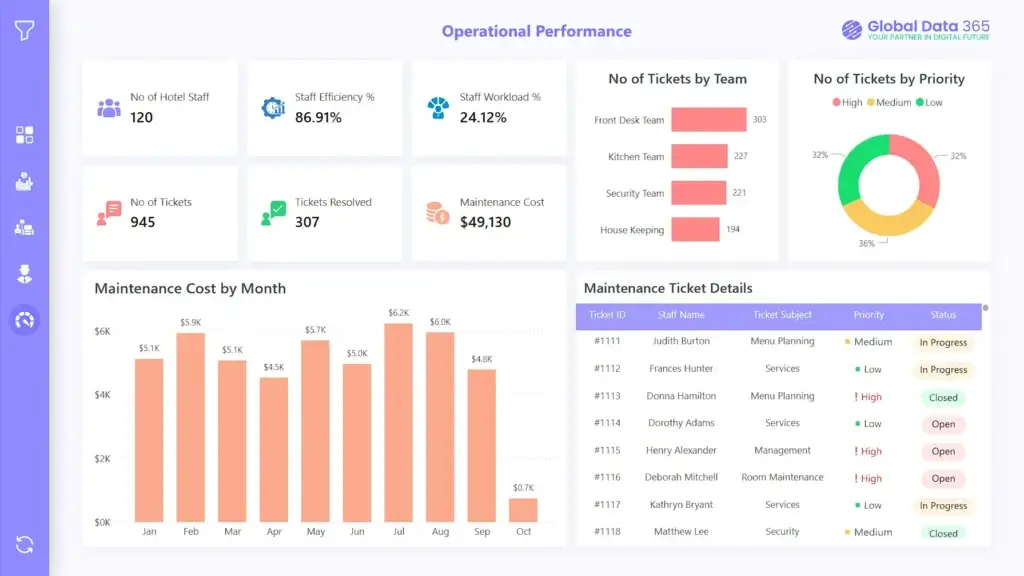
Operational Performance
The Hotel Operational Performance Dashboard page provides an in-depth overview of key insights on Staff, Departments, and Maintenance Tickets.
This dashboard highlights number of hotel staff and their efficiency, overall workload percentage and total maintenance cost. It also tracks the number of tickets raised and resolved, giving a clear picture of service responsiveness. Frequently reported staff teams and ticket priorities are visualized to help optimize issue handling and resource allocation. Monthly trends in maintenance costs and detailed ticket-level insights for hotel managers to monitor performance and enhance staff productivity.
Get expert help to build your dashboard
Our Data Analysts work with hundreds of companies across all industries including hospitality, retail, manufacturing, technology, healthcare, marketing services, and more.
More than 50+ companies trusted us to implement Power BI and transform their data into powerful insights


FAQs on Hotel Management Dashboard
A wide range of users can benefit from a Power BI hotel dashboard, including front desk staff using a hotel reservation dashboard, operations managers monitoring a hotel system, and executives analyzing performance through a hotel KPI dashboard. Admin teams use the hotel admin dashboard for system oversight, while marketing and sales benefit from a hotel booking dashboard to track trends and campaign performance.
The pricing of power bi dashboard for hotel industry depends on the features and customization required. For a detailed quote, please contact our sales team.
Currently, a mobile version of hospitality power bi dashboard is not available, but we can develop a customized mobile version upon request that will be just like our power bi hotel management dashboard template.
Designing a dashboard for hospitality industry involves selecting a hotel management dashboard template or creating a custom layout in tools like Figma. Start by identifying key metrics such as bookings, revenue, and occupancy. You can use a hotel dashboard Figma design to map data visually. An effective hotel dashboard design ensures real-time insights and easy navigation for managers and staff.
A dashboard for hotel management centralizes key data—reservations, revenue, occupancy, and staff performance—into a single view. A well-built hotel management dashboard improves decision-making, enhances operational efficiency, and boosts guest satisfaction. Using a hotel management template helps teams implement insights quickly and consistently.
What Our Customers Have to Say About Us
Working with Global Data 365 has been a fantastic experience. Their Power BI reports have completely transformed how we analyze and use our data. The insights are clear, actionable, and have made decision-making so much easier for our team.

Tres Nelson
Manager BI - Signature Systems
The supply chain dashboard on Power BI has revolutionized the way we manage our operations, providing real-time insights that enable us to optimize for maximum efficiency. They were highly professional and responsive throughout the process, and we highly recommend their services.

Mahmoud Mohsen
IT Administrator - Alif
It was a genuine pleasure working with Global Data 365. They consistently demonstrated patience, professionalism, and attentiveness to my requirements. Their expertise in Power BI is impressive; they quickly comprehends the concepts I aim to communicate and promptly provides effective solutions.

Rana Yaseen
Accounting Manager - Boston Scientific
Our finance dashboard from Global Data 365 has revolutionized the way we manage our finances, providing real-time insights that enable us to make informed decisions and drive business growth. The team was responsive and attentive throughout the design process, and we highly recommend their services.

Cesco Righetti
CFO - The Arts Club
Thanks to Global Data 365 for their outstanding Power BI service. We are grateful for the opportunity to work with Global Data 365’s team of talented and committed individuals

Mohammad Arshad
Financial Control & Reporting Assistant Manager - PepsiCo
We are incredibly impressed with the sales dashboard designed for us on Power BI by Global Data 365. The dashboard has provided us with valuable real-time insights into our sales performance. We would highly recommend their services to anyone looking to take their sales analysis to the next level.

Ahmad Hammad, MBA
BI & ERP Specialist at SYH Retail - IKEA
Global Data 365 delivered an exceptional inventory dashboard for Baker Hughes. The Power BI solution provided real-time insights, streamlined inventory management, and improved decision-making across our operations.

Alan Siqueira
Inventory Manager - Baker Hughes
Related Resources