Manufacturing Dashboard
The Manufacturing Dashboard Power BI provides real-time insights into production performance, operational efficiency and cost control, helping you monitor every stage of the manufacturing process.
With a comprehensive view of production output, machine performance, material consumption and cost analysis, this dashboard empowers teams to make data-driven decisions throughout their manufacturing cycle.
Experience Live Interaction With Manufacturing Dashboard.
Optimize Your Manufacturing Performance with Data
Let’s build a powerful dashboard for manufacturing tailored to your operations to gain real-time insights and drive smarter production decisions
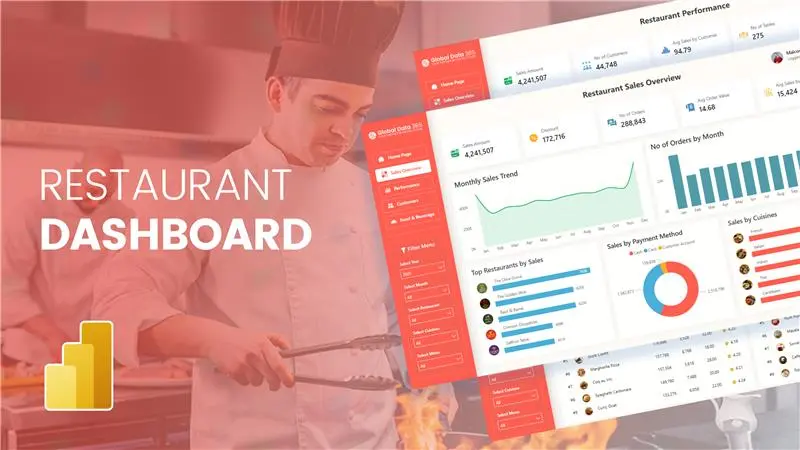
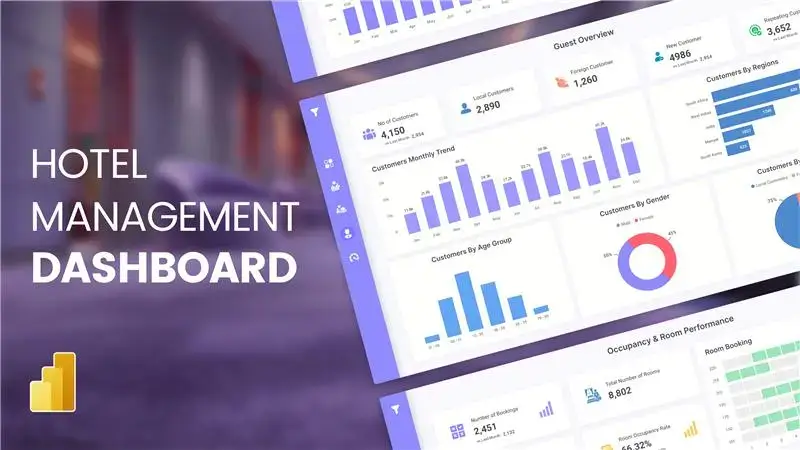
Transform Your Hotel Management Dashboard for Smarter Hospitality Insights
Take control of your hospitality operations with our Hotel Management Dashboard, your key to smarter decisions and improved performance.

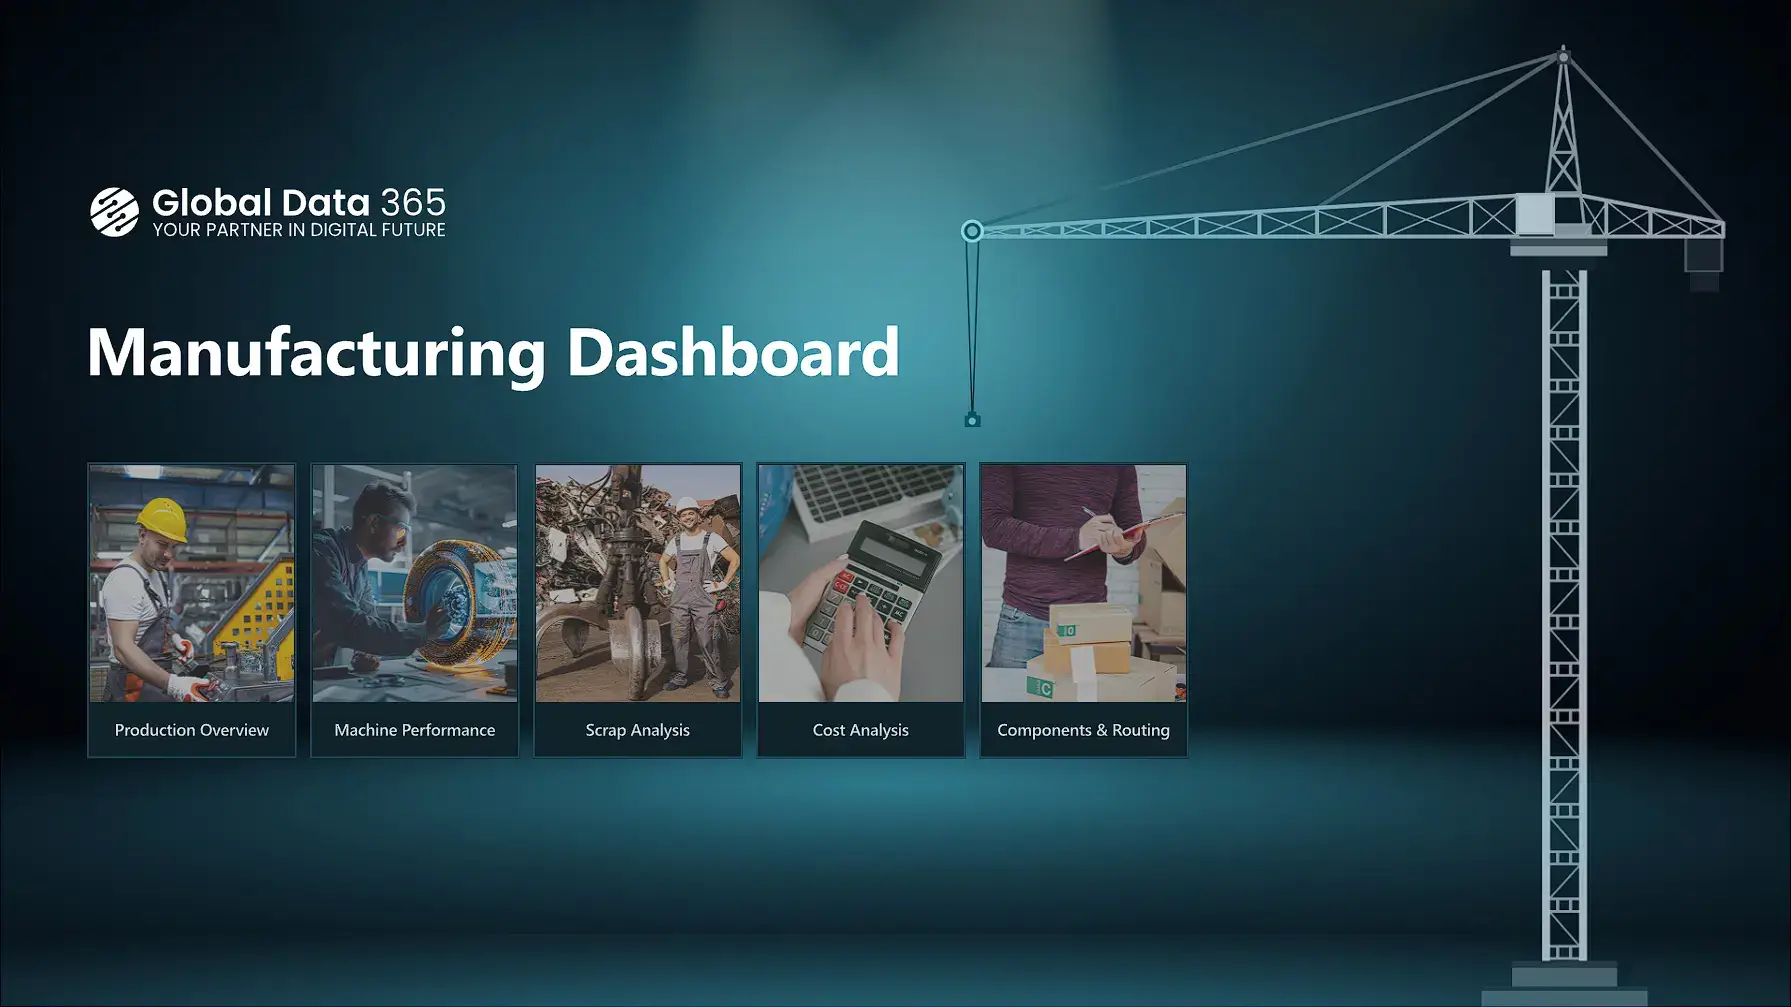
Manufacturing Dashboard
The front page of the Power BI Manufacturing Dashboard sets the stage for smart, data-driven production management.
Effortlessly navigate between Production Overview, Machine Performance, Cost Analysis, Scrap Analysis and Components & Routing helping you monitor and manage critical aspects of manufacturing operations. Gain real-time insights and drive smarter operational decisions with our manufacturing dashboard in power bi.
Production Overview
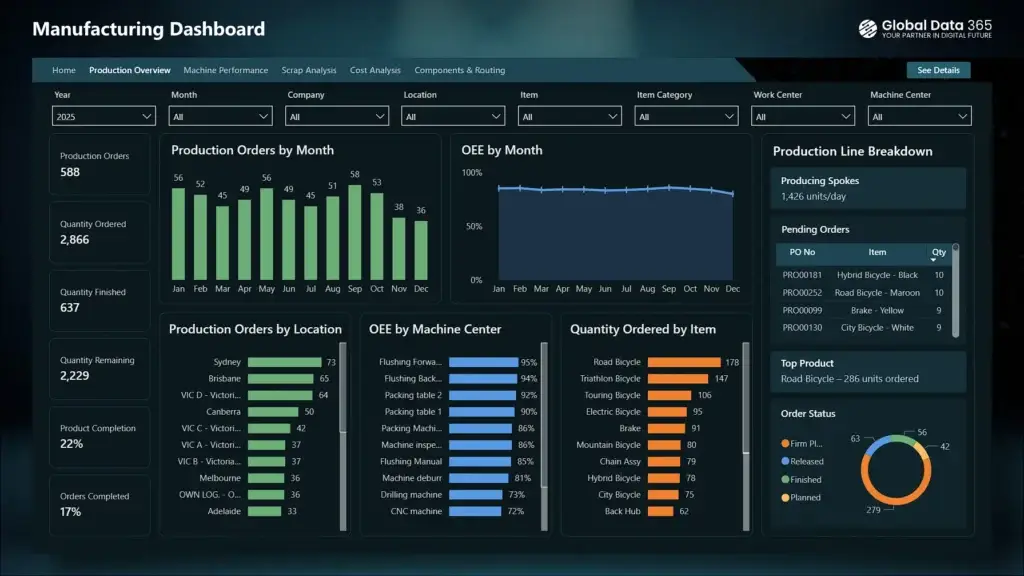
The Production Overview Dashboard page provides a comprehensive snapshot of manufacturing performance and operational efficiency.
It highlights production orders, quantity ordered, finished goods, remaining production and key metrics such as product completion and overall equipment effectiveness (OEE). With visual insights into monthly production trends, production by location, machine center performance and order status breakdown, this power bi production dashboard enables teams to monitor operations effectively. The Manufacturing Production Dashboard is an essential tool for optimizing production planning.
Machine Performance
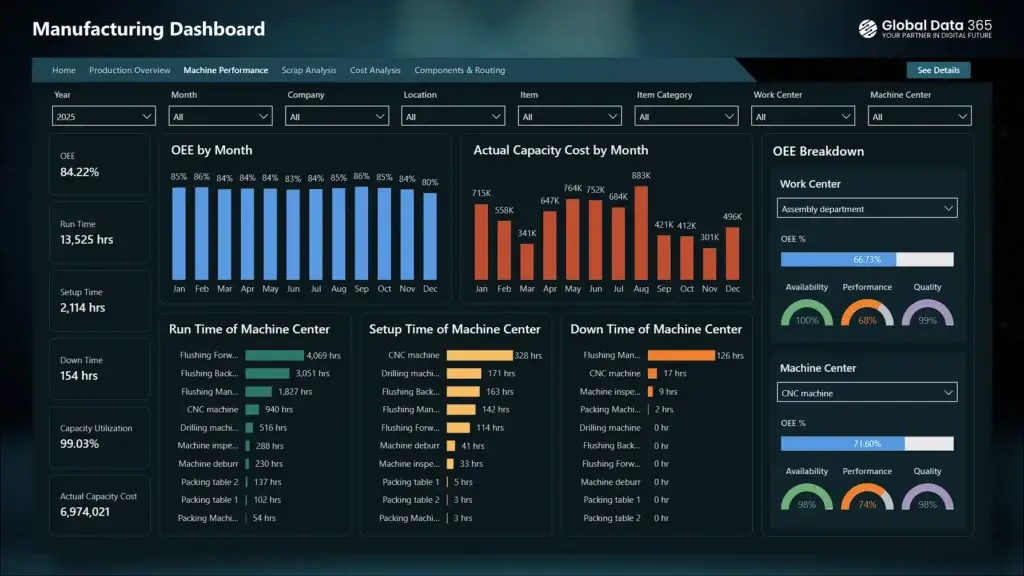
The Machine Performance Dashboard page delivers a comprehensive overview of equipment efficiency within the manufacturing environment.
It showcases critical metrics such as overall equipment effectiveness (OEE), run time, setup time, downtime and capacity utilization. With visual representations of OEE trends, capacity cost analysis, and detailed breakdowns of machine and work center performance, this dashboard enables teams to monitor productivity and identify bottlenecks. The Machine Performance report is an essential tool for maximizing equipment utilization with our Manufacturing Dashboard Power BI.
Scrap Analysis
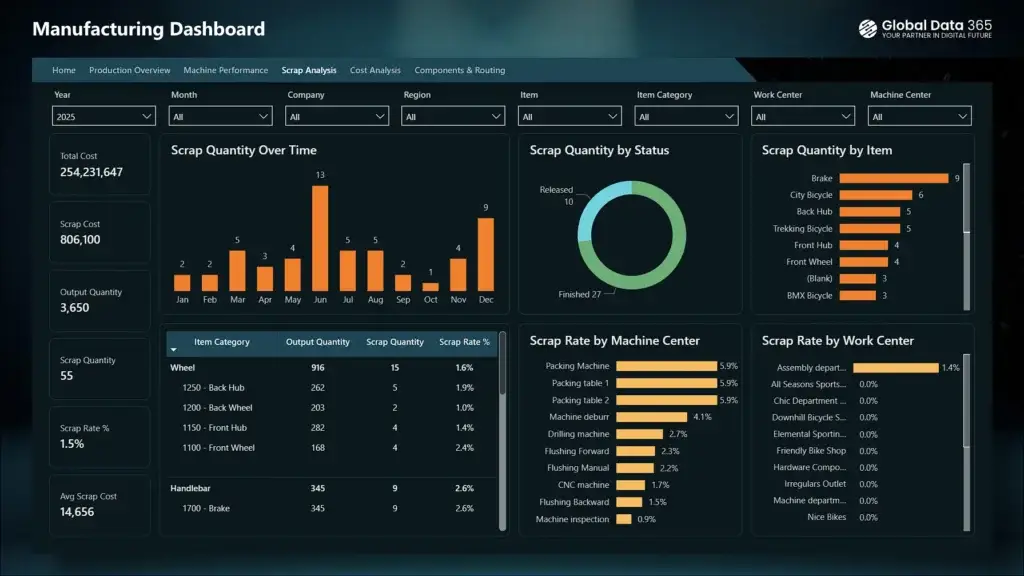
The Scrap Analysis Dashboard page provides a detailed view of material waste and production inefficiencies across the manufacturing process.
It highlights key metrics such as total scrap cost, scrap quantity, scrap rate, and average scrap cost, enabling quick assessment of production losses. With visual insights into scrap quantity trends over time, scrap distribution by status and item and scrap rates across machine and work centers, this scrap analysis dashboard for manufacturing is an essential tool for minimizing waste and improving quality control.
Cost Analysis
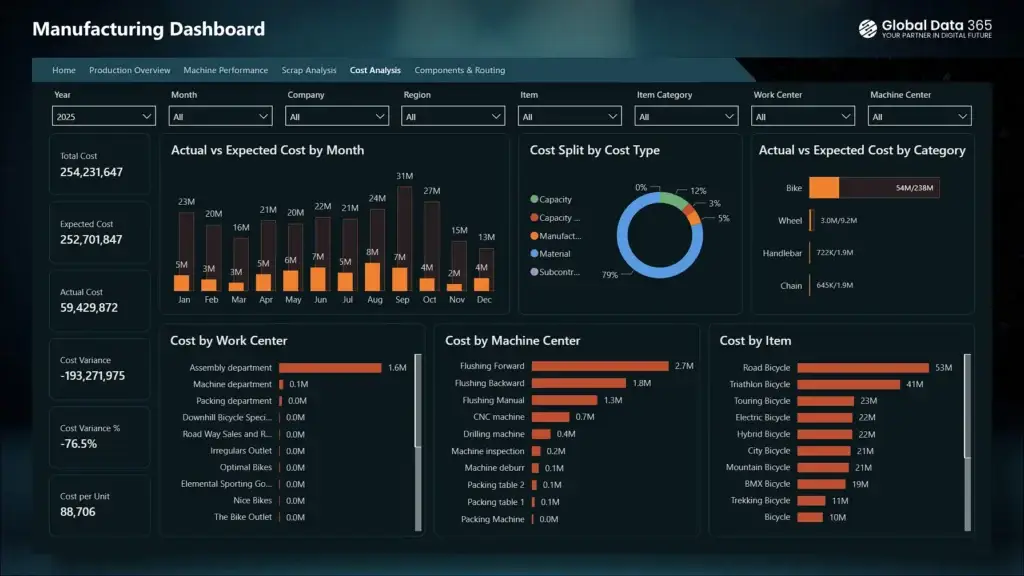
The Cost Analysis Dashboard page provides a comprehensive snapshot of manufacturing costs and financial performance.
It highlights total cost, expected vs actual cost, cost variance, and cost per unit to track financial efficiency. With visual insights into monthly cost trends, cost distribution by type, and detailed cost breakdown by work center, machine center and item category, this manufacturing cost dashboard is an essential tool for identifying cost drivers and improving overall profitability.
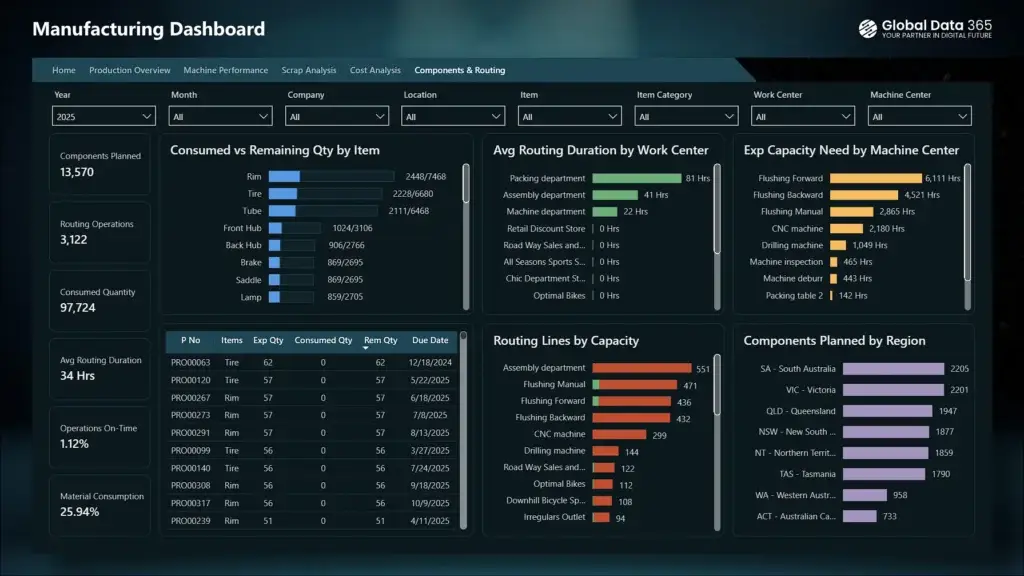
Components & Routing
The Components & Routing Dashboard page provides a comprehensive view of material consumption and production routing efficiency.
It highlights key metrics such as components planned, consumed quantity, routing operations and average routing duration. With visual insights into consumed vs remaining quantities, routing performance by work center, capacity requirements by machine center and components planned by region, this dashboard enables teams to monitor material usage and process flow. The Components & Routing of Manufacturing Dashboard Power BI is an essential tool for optimizing resource planning for smooth production operations.
Get expert help to build your dashboard
Our Data Analysts work with hundreds of companies across all industries including hospitality, retail, manufacturing, technology, healthcare, marketing services, and more.
More than 50+ companies trusted us to implement Power BI and transform their data into powerful insights


FAQs on Manufacturing Dashboard
A manufacturing dashboard is a visual reporting tool that provides real-time insights into production performance, efficiency, and operational metrics such as output, downtime, and cost, helping manufacturers make data-driven decisions.
The pricing of power bi dashboard for hotel industry depends on the features and customization required. For a detailed quote, please contact our sales team.
Currently, a mobile version of manufacturing power bi dashboard template is not available, but we can develop a customized mobile version upon request.
The key KPIs for manufacturing typically include Overall Equipment Effectiveness (OEE), production output, cycle time, defect rate (scrap rate), and cost per unit, all of which help measure efficiency and productivity.
A real-time production dashboard is a live monitoring system that tracks manufacturing operations instantly, showing updates on production status, machine performance, and efficiency. It is often considered part of the Best manufacturing dashboard software for real-time production monitoring solutions that help improve decision-making and reduce downtime.
Customizable manufacturing dashboard tools for industrial use can be purchased from BI solution providers, ERP vendors, or specialized analytics companies that offer tailored dashboards designed to integrate with production systems and support scalable manufacturing operations.
What Our Customers Have to Say About Us
Working with Global Data 365 has been a fantastic experience. Their Power BI reports have completely transformed how we analyze and use our data. The insights are clear, actionable, and have made decision-making so much easier for our team.

Tres Nelson
Manager BI - Signature Systems
The supply chain dashboard on Power BI has revolutionized the way we manage our operations, providing real-time insights that enable us to optimize for maximum efficiency. They were highly professional and responsive throughout the process, and we highly recommend their services.

Mahmoud Mohsen
IT Administrator - Alif
It was a genuine pleasure working with Global Data 365. They consistently demonstrated patience, professionalism, and attentiveness to my requirements. Their expertise in Power BI is impressive; they quickly comprehends the concepts I aim to communicate and promptly provides effective solutions.

Rana Yaseen
Accounting Manager - Boston Scientific
Our finance dashboard from Global Data 365 has revolutionized the way we manage our finances, providing real-time insights that enable us to make informed decisions and drive business growth. The team was responsive and attentive throughout the design process, and we highly recommend their services.

Cesco Righetti
CFO - The Arts Club
Thanks to Global Data 365 for their outstanding Power BI service. We are grateful for the opportunity to work with Global Data 365’s team of talented and committed individuals

Mohammad Arshad
Financial Control & Reporting Assistant Manager - PepsiCo
We are incredibly impressed with the sales dashboard designed for us on Power BI by Global Data 365. The dashboard has provided us with valuable real-time insights into our sales performance. We would highly recommend their services to anyone looking to take their sales analysis to the next level.

Ahmad Hammad, MBA
BI & ERP Specialist at SYH Retail - IKEA
Global Data 365 delivered an exceptional inventory dashboard for Baker Hughes. The Power BI solution provided real-time insights, streamlined inventory management, and improved decision-making across our operations.

Alan Siqueira
Inventory Manager - Baker Hughes
Related Resources