Learn how to use Object-Level Security (OLS) in Power BI to hide sensitive objects like columns and tables. This guide walks through a real-world example of hiding an Employee Salary column step by step, including setup, testing, limitations and best practices.
Many of you are likely familiar with the security features built into Power BI.
1. Row Level Security (RLS)
2. Object Level Security (OLS)
Let’s see a bit about Row Level Security.
Row-Level Security (RLS) is a data security feature that restricts access to specific rows of data for designated users or groups of users. In Power BI, RLS enables us to ensure that users only view data within a dashboard they are authorized to see. This is achieved by applying criteria defined in the data model to control access at the row level within a table. The underlying logic filters the data, effectively hiding unauthorized rows by applying these criteria as the report is generated. Find the guide here: Static Row-Level Security and Dynamic Row-Level Security in Power BI. Now, Let’s jump into Object Level Security (OLS):
What is Object-Level Security (OLS) in Power BI?
Object-Level Security (OLS) is a feature that restricts access to specific tables or columns in a data model based on user roles. Unlike Row-Level Security, OLS operates on the metadata of the data model rather than the data itself. This functionality can be applied to entire tables or individual columns, ensuring that users only have access to the structural elements of the data model that align with their permissions.
Why Does it Matter?
Many organizations have data tables that contain both confidential and public information. We can control access to the confidential column(s) by applying OLS to that table in the following way:
Prerequisites
- OLS deals with tables and columns in a data model, and indirectly, it deals with the metadata of a data model. Establishing OLS requires an external tool.
- Tabular Editor is a widely used model metadata editor that provides a simple GUI for editing the Model Metadata instead of making changes in the script. ·
- Download link for Tabular Editor Download Tabular Editor
Step-by-step: Implement OLS in Power BI Desktop
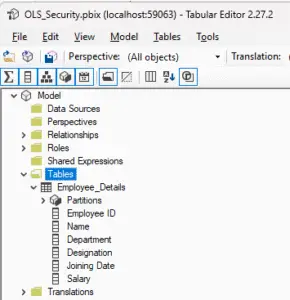
Sample Data For example, let’s say we have a table with employee details. Let’s treat the Salary column as a secured column. The Salary column should not be exposed to everyone after applying OLS on the Salary column, which is present in the Employee Details table. 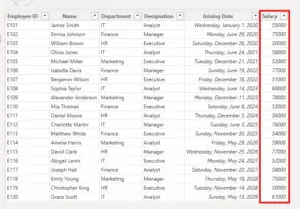 Administration role – Expose the columns.
Public role – Hide the columns.
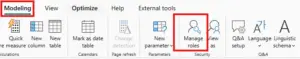
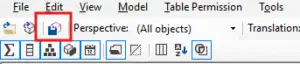
- Go to the Modelling tab in Power BI desktop.

- Click on Manage Roles.
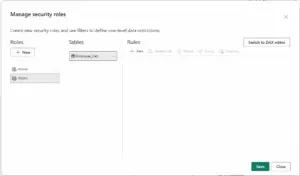
- Now click New, create 2 roles , and rename them to Admin and Public

- Save the changes.
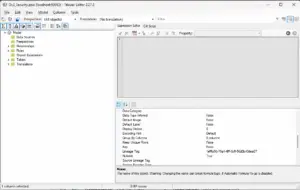
- Now go to the External tools tab in Power BI and click on Tabular Editor
- The Tabular Editor should connect to the data model automatically and look like this

- Expand the Tables section

- You can also apply OLS to the whole table

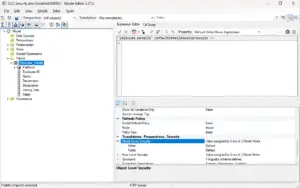
- Click on the desired column you want to hide, In our case it’s the Salary Column, Scroll down to Translations, Perspectives, Security , Under that Expand Object Level Security Section
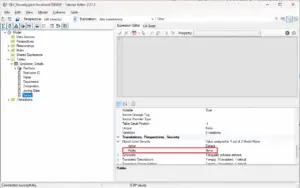
- Under object-level security, we see the Security roles that we created earlier in this article. The Salary column should not be exposed to the Public, but we can enable it for Admin
- Change the default to None for the Public and for Admin role leave it as default.

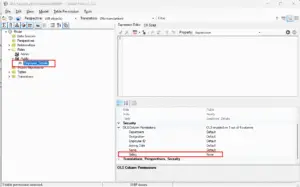
- After updating the column properties, expand the roles folder, and you can see the Employee_Details Table added under the public role. Click on the Employee table under public role for more information.

- Save the changes in Tabular Editor. The changes will be reflected in Power BI Desktop and you can now close the Tabular Editor.

Testing OLS Security in Power BI Desktop
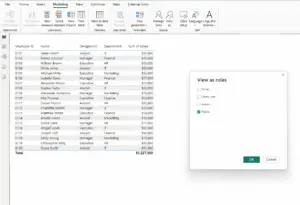
Let’s perform validation using the inbuilt option View as in the Power BI desktop.
- Go to the Power BI desktop Modeling tab and click View as
- Now, you can see all the available roles in a dialog box. Among those, select the public role and click OKto check whether the Salary column is hiding for this role.

- Click OK
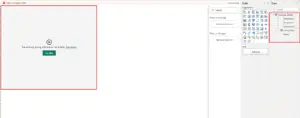
- Once you click OK, you can see that the Table visual gives an error, and also with the Salary column being hidden in the data pane of Employee_Details Table.

- You can also test for the Admin Role, It will be default as we haven’t applied any OLS security on it.
👉 Join our Power BI Training and gain hands-on skills to turn insights into action.
Testing OLS in Power BI Service
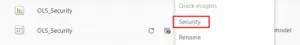
- Publish the report in Power BI Service
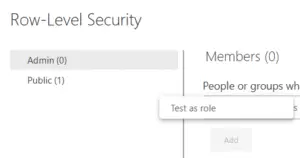
- Navigate to your workspace and click on Security on the semantic model of your report

- Now click on the Test as role(In more options) option in the public role.
 We’ve also added a pie chart for count of Employees by Designation, Lets test it now:
  As you can see the, Visuals built using the column where OLS was applied errored out while the pie chart remain the error free in the Public Role.
 - Testing as Admin Role

 We’ve also added a pie chart for count of Employees by Designation, Lets test it now:
 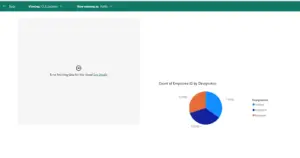 As you can see the, Visuals built using the column where OLS was applied errored out while the pie chart remain the error free in the Public Role.
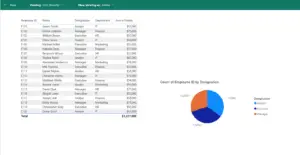
Limitations of Object-Level Security (OLS)
While OLS is powerful, it has important limitations you should understand before using it in production.
Key limitations
- OLS is static (not dynamic) OLS does not evaluate user identity dynamically using DAX (like USERPRINCIPALNAME()). Users must be explicitly assigned to roles in the Power BI Service.
- OLS hides metadata, not data logic OLS completely hides columns, tables, or measures. If a visual or measure depends on a hidden object, it will fail or disappear.
- Broken visuals and measures Any visual or DAX measure that references a hidden column will:
- Show an error, or
- Be removed from the report for that user
Using RLS and OLS Together
In real-world scenarios, RLS and OLS are most powerful when used together. Why combine RLS + OLS?
- RLS answers: Which rows can a user see?
- OLS answers: Which columns or tables can a user see?
Together, they provide complete data protection.
Conclusion
Object-Level Security (OLS) is a critical component of Power BI’s security framework, providing granular control over access to specific data objects. When combined with Row-Level Security (RLS), OLS offers a robust solution to safeguard sensitive information. However, it’s crucial to implement OLS carefully to avoid unintended access and ensure optimal performance.