A practical, step-by-step help-center guide explaining Dynamic Row Level Security (RLS) in Power BI what they are, when to use each, how to implement them (with DAX examples), how to test and deploy and common pitfalls to avoid.
What is RLS?
Row-Level Security (RLS) controls which rows of data a report user can see. In Power BI, RLS is implemented at the dataset level and filters data for users without changing the underlying data source. There are two common approaches:
- Static RLS: Roles are defined with fixed filters (e.g., Region= “West”). Assign specific user accounts to each role in the Power BI Service. Find complete: Guide on Static RLS.
- Dynamic RLS: Filters use DAX expressions that depend on the current user (e.g., USERPRINCIPALNAME()) so one role can serve many users with different data scopes.
In this article we will be learning about Dynamic RLS
Roles and filters
RLS implementation is based on three core elements:
- Roles: Logical groupings with defined access rules.
- DAX filters: Expressions that determine what data each role can access.
- User assignments: Configuration of which users or groups belong to which roles.
Dynamic RLS — Overview
Best for: large user populations where each user sees personalized data (e.g., each salesperson sees only their accounts), or where an external security table maps users to allowed rows. Dynamic RLS uses DAX functions that evaluate the user identity at runtime (e.g., USERPRINCIPALNAME() or USERNAME()) and matches that to a mapping table to produce a filter.
Step-by-step: Implement Dynamic RLS in Power BI Desktop
Sample Data:
For this example, I will use sample data imported from Excel . You can enter your data directly into Power BI by Enter Data feature. Dynamic security works with any data sources as long as we have related data rows in the tables For this example, we have two tables Salesperson and SalesTransactions. The Salesperson table contains individual salesperson details, while the transaction table stores the sales records Salesperson Table: 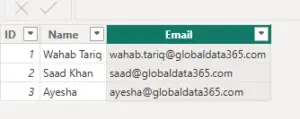 SalesTransaction Table:
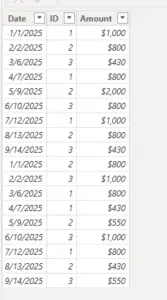
- Load tables into Power BI
- Create a simple report that includes a table visual and key summary visuals. Add a card visual to display total sales, a monthly column chart to show sales trends over time, and an additional card visual with a measure defined as USER = USERPRINCIPALNAME() to display the currently logged-in user.
DAX Functions : USERPRINCIPALNAME() returns the logged-in user’s email address and works consistently in both Power BI Desktop and Power BI Service. It is the recommended function for Dynamic Row-Level Security (RLS). USERNAME() returns the user’s login name (domainusername or email), but its output changes by environment, making it unreliable for RLS. For security filtering and user identification in Power BI, always use USERPRINCIPALNAME().
- Define a role :
- Go to Modeling > Manage Roles.
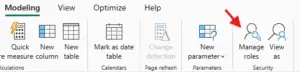
- Click the New button and name your role , e.g Users
- Select the table
- Enter the DAX expression that filters the Salesperson
[Email] = USERPRINCIPALNAME()
- Click Save
This is how your interface will look like;
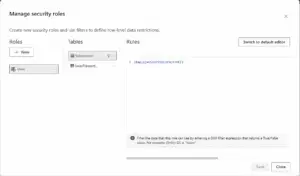 This filter simply means that the logged-in user will only see his/her records in the whole data set. As you remember, the username field in the Sales Rep table is defined as the usernames of Power BI accounts. And transactions table is also related to this table based on Sales Rep ID. So filtering one table will affect others. As a result, this single-line filter will enable dynamic row-level security in the whole Power BI solution here.
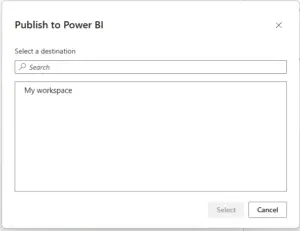
4. Publishing the report to Power BI Service
- In Power BI Desktop, click on Home > Publish > To Power BI.
- Choose the target workspace in your Power BI Service.
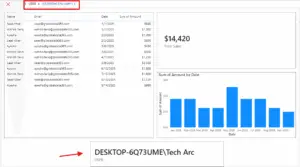
 Here’s what it looks like in Power BI Service .
 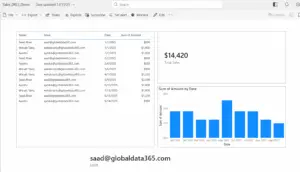 Publishing is a prerequisite for configuring RLS role assignments
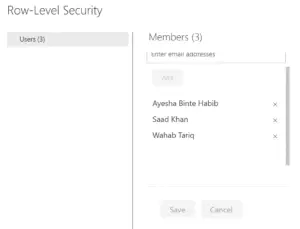
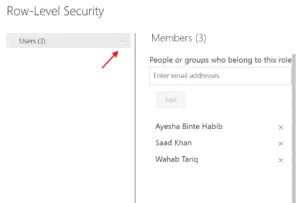
- Assign users to roles in Power BI Service:- Select the More options menu for your relevant semantic model. Click the ellipsis (…) next to the dataset and select Security. – You’ll see a list of roles defined in Power BI Desktop. – To assign users, enter their full email addresses in the text box under the desired role, press Enter, and click Add – To assign AAD groups, use the name of the group (e.g., Region_West, Finance Team). – Do ensure that the group is already defined and maintained in Azure Active Directory.

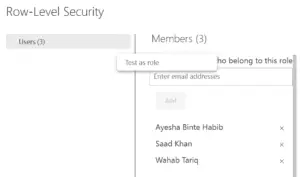
- Testing : In case you’re wondering why the report was not filtered when it was first published, it’s because I (saad@globaldata365.com) was the report owner. Report owners have full access to the data by default, so RLS is not enforced for them. To test the report as another user, you need to click the ellipses (⋯) next to the role and select Test as role.

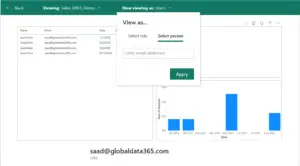
 Type in the email address for the user you want to test the report as.
  Click Apply.
- Share the Report or Dashboard
 Click Apply.
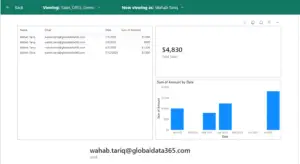
Other users should have access to the dashboard . You can share the report using any method that gives the user a read-only view. Here, I used the individual report-sharing option;  Now type in the email of the users , you want to send the report to and that’s it.
👉 Join our Power BI Training and gain hands-on skills to turn insights into action.
If other users open the report, and if their usernames match one of the entries in the Sales Rep table, they would see their names and data rows related to that in the report.