Top 10 Benefits of Power BI for Industry Analytics
Top 10 Benefits of Using Power BI for Industry-Specific Analytics
- Global Data 365
In a world where every industry runs on data, one-size-fits-all analytics simply doesn’t work. Each business sector, from finance and sales to hospitality and manufacturing, needs dashboards designed for its unique KPIs and workflows. That’s exactly where Power BI for industry comes in. Global Data 365’s Power BI Industry Dashboards deliver real-time insights, interactive visuals, and industry-tailored intelligence that help organizations turn data into strategic decisions.
1. Unified Industry Dashboards for Full Business Visibility
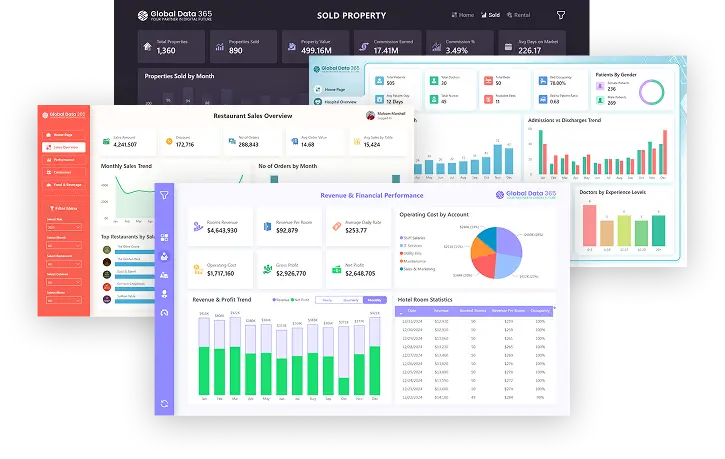
With dashboards like the Sales Dashboard, Customer Dashboard, Item Dashboard, Finance Dashboard, Hotel Dashboard and Manufacturing Dashboard offered by Global Data 365, you gain one central platform where cross-functional data converges. This holistic view enables you to identify performance interdependencies for instance: how manufacturing output affects item sales, or how hotel occupancy influences finance metrics.
Example: A Sales Dashboard instantly shows which products and regions drive revenue growth, giving managers visibility from order to profit — all in one place.
2. Industry-Specific KPIs Tailored to Each Domain
Each dashboard is built with metrics meaningful to its domain:
Finance Dashboard — profit & loss, working capital, budget variance.
Sales Dashboard — order trends, top customers, regional performance.
Item Dashboard — SKU movement, inventory turnover, margin by item.
Customer Dashboard — customer lifetime value, churn, segmentation.
Hotel Dashboard — occupancy rate, average daily room rate (ADR), guest spend.
Manufacturing Dashboard — production yield, scrap rate, throughput.
This precision means data insights are relevant and actionable.
3. Real-Time & Interactive Insights
These Power BI dashboards are interactive: you can filter, drill-down, and explore data in real time. For example, the Item Dashboard might let you click into a SKU and immediately see its sales trend, margin history and inventory status. This immediacy allows faster reaction to emerging issues or opportunities.
Example: In the Hotel Dashboard, live booking data automatically updates occupancy and revenue KPIs, letting hotel managers track daily room performance with accuracy.
4. Deep Drill-Down Analytics Across Industries
From a high-level view you can dive into specifics:
In the Sales Dashboard, click into a region to see top items using the Item Dashboard.
In the Hotel Dashboard, drill into a property or guest segment to see finance impacts in the Finance Dashboard.
Such linkage across dashboards ensures you’re not just looking at siloed data, but connected insights.
Example: The Real Estate Dashboard lets you drill from total revenue down to individual property performance, uncovering which properties generate the highest rental yields.
5. Forecasting & Trend-Spotting for Strategic Advantage
Industry-specific dashboards help spot patterns: in manufacturing you may detect yield declines; in hotels you may see an occupancy drop tied to guest reviews; in sales you could spot a SKU losing momentum. These insights help you proactively adjust strategy rather than react after the fact.
Example: The Project Management Dashboard uses historical data to predict upcoming project delays or cost overruns, empowering managers to take preventive actions.
6. Seamless Integration with Business Systems
Dashboards like those from Global Data 365 are built to integrate with ERP, CRM, PMS (for hotels), manufacturing systems, inventory systems etc. That means your Sales, Finance, Manufacturing, Hotel dashboards all pull live from core systems, reducing manual data work and boosting accuracy.
Example: The HR Dashboard automatically syncs employee data from your HRMS, giving you up-to-date insights on hiring trends and workforce performance.
7. Cross-Team Collaboration Made Visual
When each function uses a standardized dashboard (Sales, Item, Customer, Finance, Manufacturing, Hotel), different teams speak the same data language. Sales refers to the Sales Dashboard; operations references the Manufacturing Dashboard; finance looks at the Finance Dashboard. Shared understanding fosters collaboration and alignment.
Example: In the Hospital Dashboard, administrators and department heads can view shared KPIs like patient admission rates and bed occupancy, ensuring medical, finance and operations teams work in sync.
8. Strong Visualizations & Storytelling Power
Power BI’s visual capabilities (charts, heatmaps, slicers, drill-through) are leveraged deeply in Global Data 365’s industry dashboards. You’re not just seeing tables of numbers, you’re seeing visuals that tell a story: e.g., in the Hotel Dashboard a waterfall chart shows revenue by guest segment; in the Customer Dashboard a segmentation treemap highlights high-value groups.
Example: The Restaurant Dashboard uses color-coded visuals to show peak dining hours, top-performing menu items, and customer satisfaction scores, making trends instantly clear to management.
9. Scalable & Customizable for Growth
Whether you’re a single-site hotel or a global chain; a manufacturing plant or a multi-plant operation; a regional sales team or a global sales force the dashboards offered are designed to scale. You can customise them: add new KPIs, adjust visuals, filter by geography, adapt to new products. Global Data 365’s samples show this flexibility across domains.
Example: A Property Management Dashboard can scale from tracking 5 buildings to 500, giving real estate companies unified oversight across all assets.
10. Informed Decision-Making Across Industries
The ultimate benefit: with all these dashboards (Sales, Customer, Item, Finance, Hotel, Manufacturing) you can make data-driven decisions with confidence. Want to know how a drop in item inventory is impacting sales? Or how a shift in manufacturing yield is shaping cost of goods sold and finance margins? Or how guest behaviour in a hotel correlates with revenue trends? These dashboards tie it all together.
Example: The Logistics Dashboard helps identify delivery delays, optimize routes, and track shipment costs, enabling logistics managers to make real-time operational decisions that cut expenses and improve reliability.
Final Thoughts
Leveraging industry-specific dashboards from Global Data 365 built in Power BI isn’t just about better reporting, it’s about enabling actionable, domain-specific insights across your business. Whether you operate in sales, manufacturing, hospitality, or finance, you get tailored views, real-time data, visual storytelling and cross-department alignment.
Ready for Smarter Industry Decisions? Let’s Talk
Search Blog
Related Resources
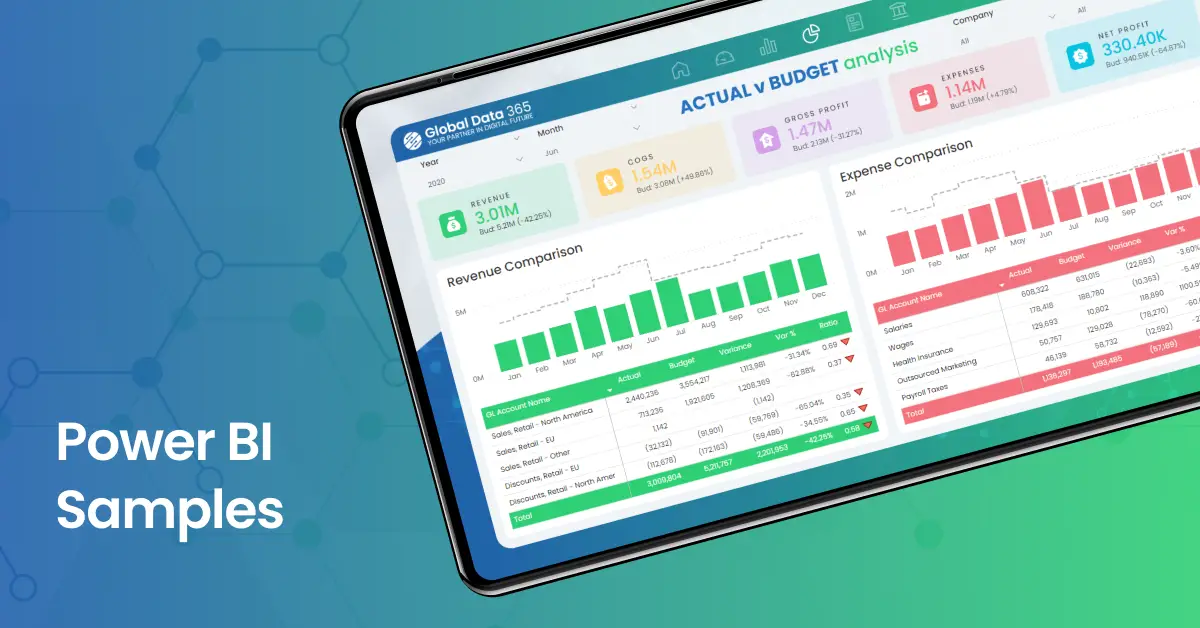
Power BI Samples

Why Power BI is a Better Choice than Excel for Analytics