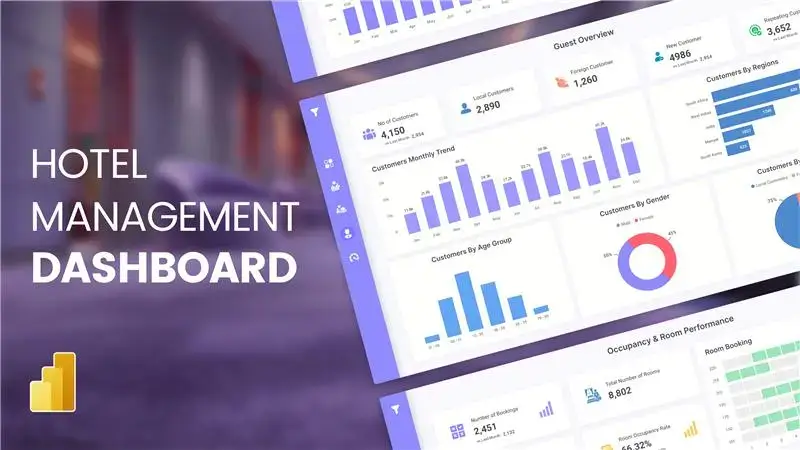
Property Management Dashboard
The Property Management Dashboard in Power BI provides a centralized view of real estate operations, offering real-time insights into property sales, rentals, and maintenance.
Maximize your profits by monitoring occupancy rates, revenue, and cost performance. This dashboard empowers businesses to streamline operations and enhance property management efficiency.
Experience Live Interaction With Property Management Dashboard.
Revolutionize the Way You Manage Properties
Get a custom dashboard for property management to manage and hnadle your properties with ease.
Transform Your Property Management Dashboard into a Smart and Interactive Experience
Unlock the full potential of your property business with our Power BI property management dashboard sample to gain actionable insights and maximize profitability.

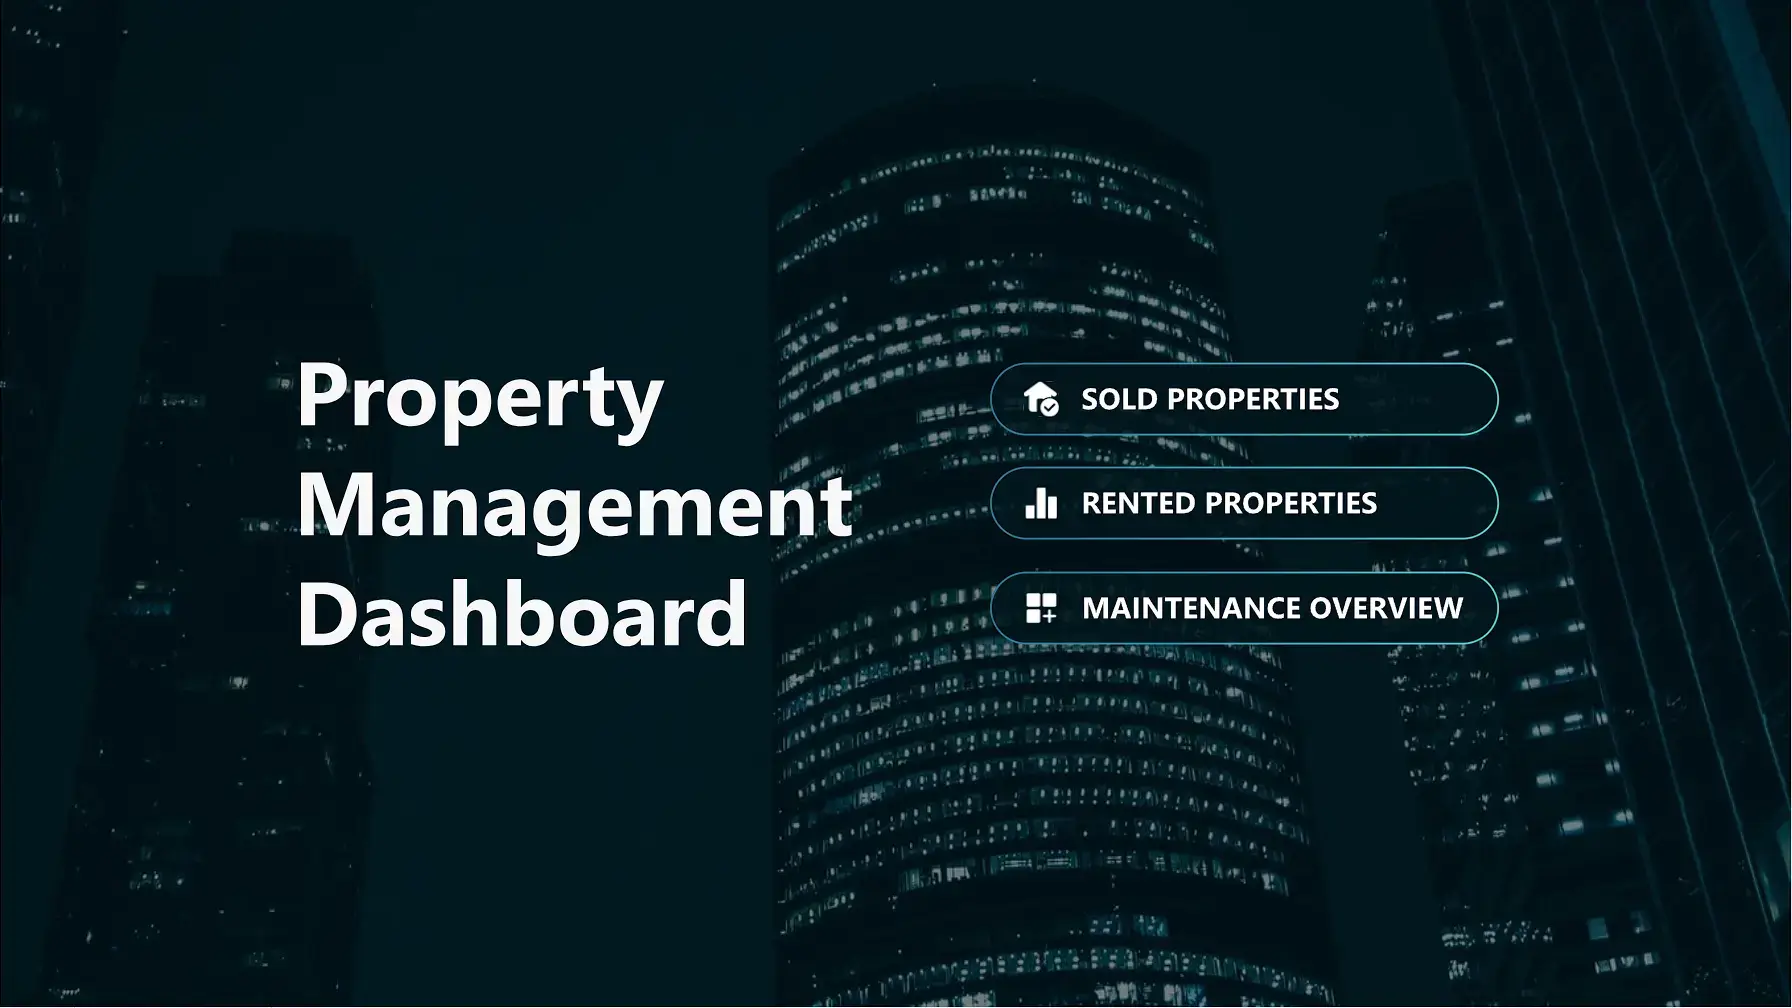
Front Page Property Management Dashboard
The front page of Power BI Property Management Dashboard offers a seamless gateway into property management data.
Effortlessly navigate between Sold Properties, Rented Properties, and Maintenance Overview to focus on key aspects of property operations. Unlock actionable insights, streamline decision-making, and optimize property management strategies with this dynamic dashboard.
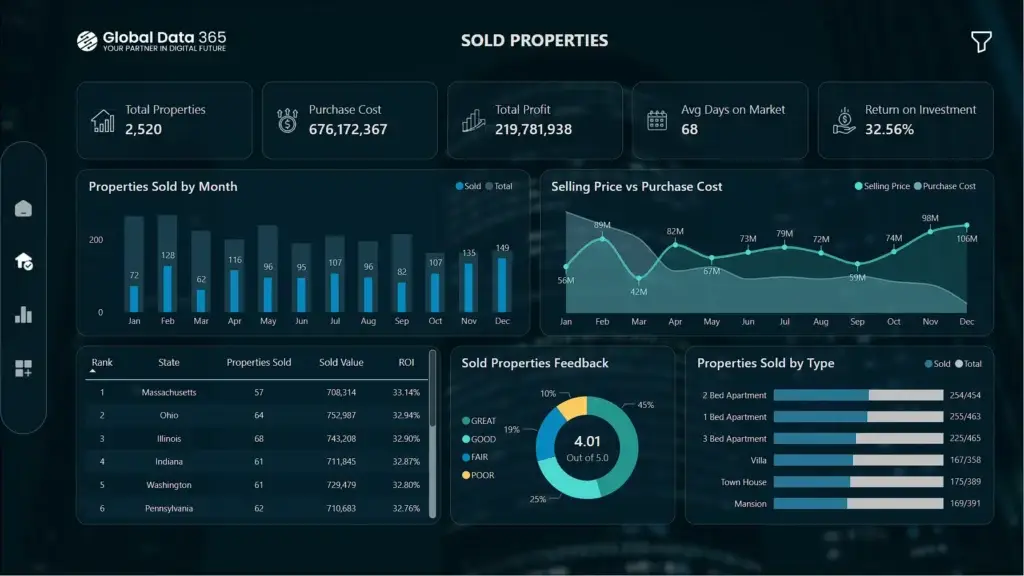
Sold Properties
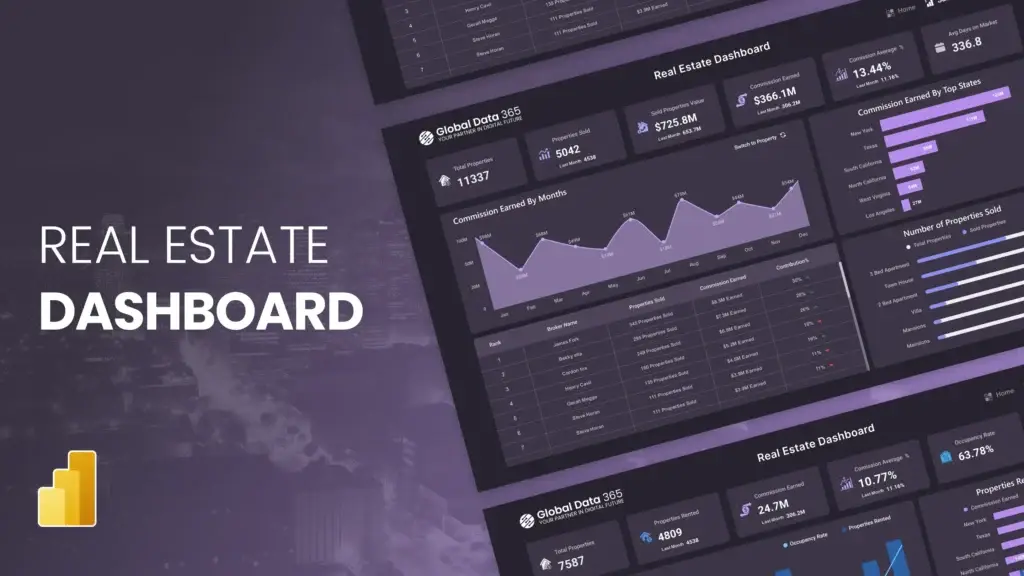
The Sold Properties Dashboard provides an overview of key sales metrics, offering insights into monthly sales performance and properties sold.
This dashboard help stakeholders, track the total number of properties sold, purchase costs, total profit, average days on market and return on investment (ROI). It highlights high occupancy months, selling vs. purchasing trends, most sold properties by state and by type. By visualizing these trends, businesses can optimize sales strategies, maximize profitability and make data-driven investment decisions.
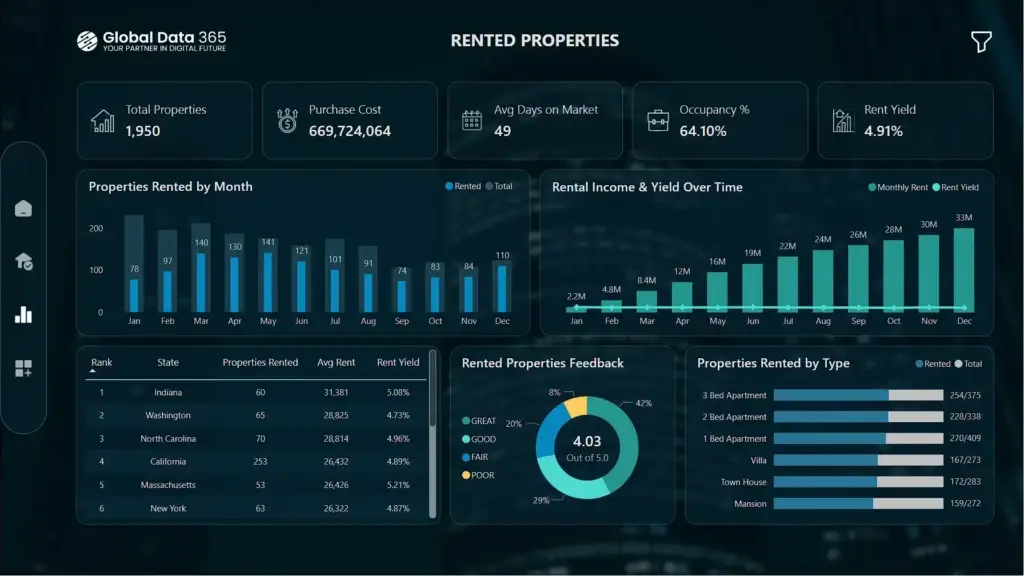
Rented Properties
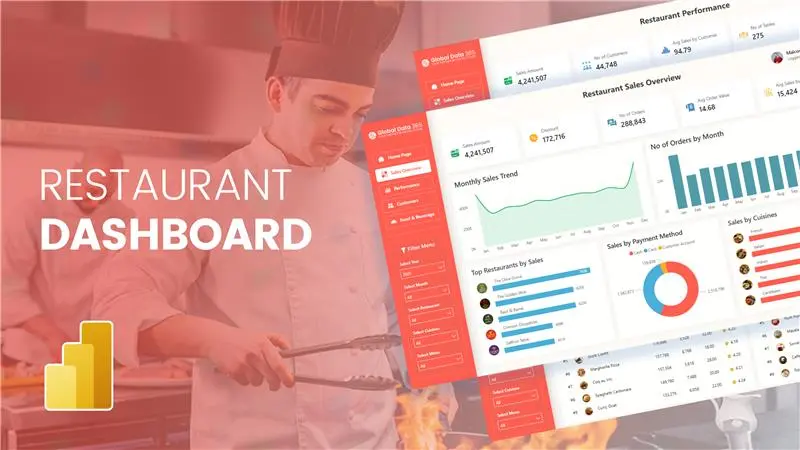
The Rented Properties Dashboard offers key insights into rental performance, occupancy, and financial metrics.
It tracks total properties rented, purchase costs, average days on market, occupancy rates and rental yield. The ultimate property dashboard highlights monthly rental income, occupancy rates of rentals over months, top-performing states, and the most rented property types, empowering property owners and professionals to refine strategies, enhance occupancy and boost profitability.
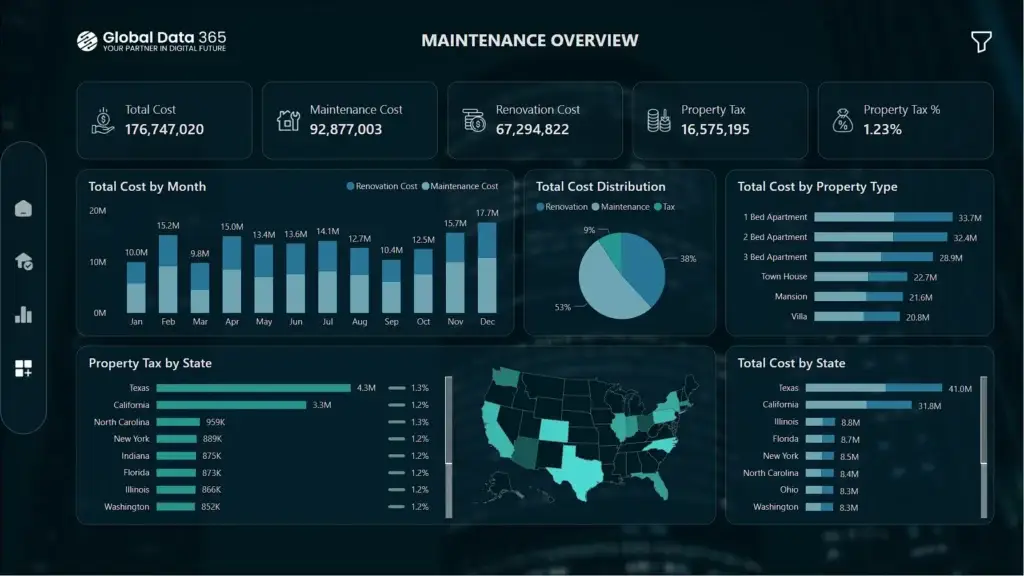
Maintenance Overview
The Maintenance Overview Dashboard provides a comprehensive view of property upkeep costs, including maintenance, renovation, and property tax expenses.
It tracks total costs over time, highlights cost distribution, and identifies high-expenditure property types and states. With insights into monthly trends and tax burdens, property managers can optimize budgeting and resource allocation efficiently.
Get expert help to build your dashboard
Our BI Professionals work with hundreds of companies across all industries including real estate, retail, manufacturing, technology, healthcare, and more.
FAQs on Property Management Dashboard
The Property Management Dashboards benefits property managers, real estate investors, and facility management teams by providing real-time property management data for informed decision-making. The property management admin dashboard streamlines operations by tracking maintenance costs, renovation expenses, and property taxes. Additionally, the property management KPI dashboard helps monitor key performance metrics, optimize budgets, and improve asset management efficiency.
The pricing for a real estate property management dashboard depends on the features and customization required. For a detailed quote, please contact our sales team.
Currently, a mobile version of the property dashboard is not available, but we can develop a customized mobile version upon request that will resonate with or power bi property management template.
Our property management dashboard design process begins with understanding your needs, whether it's tracking sold properties, rental performance, or maintenance overviews. After gathering your requirements, we create a layout in Figma for your feedback. Once approved, the design is replicated in Power BI with added functionalities for real-time data visualization.
The property management app dashboard integrates seamlessly with a mobile app built using Power Apps, enabling agents to log in, view their properties, and update data directly from their devices. Any changes made through the app are instantly reflected in the dashboard, ensuring decision-makers like owners and managers always have up-to-date insights for strategic planning and real-time monitoring.
More than 50+ companies trusted us to implement Power BI and transform their data into powerful insights


What Our Customers Have to Say About Us
We are incredibly impressed with the sales dashboard designed for us on Power BI by Global Data 365. The dashboard has provided us with valuable real-time insights into our sales performance. We would highly recommend their services to anyone looking to take their sales analysis to the next level.

Ahmad Hammad, MBA
BI & ERP Specialist at SYH Retail - IKEA
Working with Global Data 365 has been a fantastic experience. Their Power BI reports have completely transformed how we analyze and use our data. The insights are clear, actionable, and have made decision-making so much easier for our team.

Tres Nelson
Manager BI - Signature Systems
It was a genuine pleasure working with Global Data 365. They consistently demonstrated patience, professionalism, and attentiveness to my requirements. Their expertise in Power BI is impressive; they quickly comprehends the concepts I aim to communicate and promptly provides effective solutions.

Rana Yaseen
Accounting Manager - Boston Scientific
The supply chain dashboard on Power BI has revolutionized the way we manage our operations, providing real-time insights that enable us to optimize for maximum efficiency. They were highly professional and responsive throughout the process, and we highly recommend their services.

Mahmoud Mohsen
IT Administrator - Alif
Power BI has transformed our HR processes at the College of Excellence. Its real-time insights and interactive dashboards have streamlined reporting, empowered data-driven decisions, and provided a clear view of key HR metrics. A true game-changer for our organization!

Albaraa Arishi
IT Manager - Colleges of Excellence
Thanks to Global Data 365 for their outstanding Power BI service. We are grateful for the opportunity to work with Global Data 365’s team of talented and committed individuals

Mohammad Arshad
Financial Control & Reporting Assistant Manager - PepsiCo
Related Resources