Project Management Dashboard
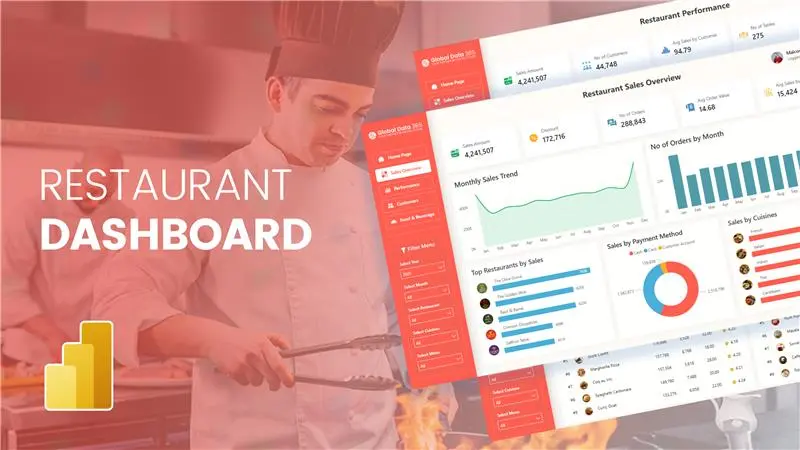
The Project Management Dashboard in Power BI provides real-time insights into critical performance metrics, helping you monitor overall project efficiency.
With a consolidated view of project status, task progress, and timeline tracking, this dashboard empowers managers to make data-driven decisions and optimize project delivery across teams.
Experience Live Interaction With Project Management Dashboard.
Empower Your Team with Project Management Dashboard
Get a tailored dashboard for project management designed for you helping you track progress, manage tasks and drive successful delivery.
Elevate Your Real Estate Dashboard for a More Engaging and Insightful Experience
Navigate your way to real estate success with our real estate dashboard example, leverage this powerful tool to make data-driven decisions and elevate your property performance.

Project Management Dashboard
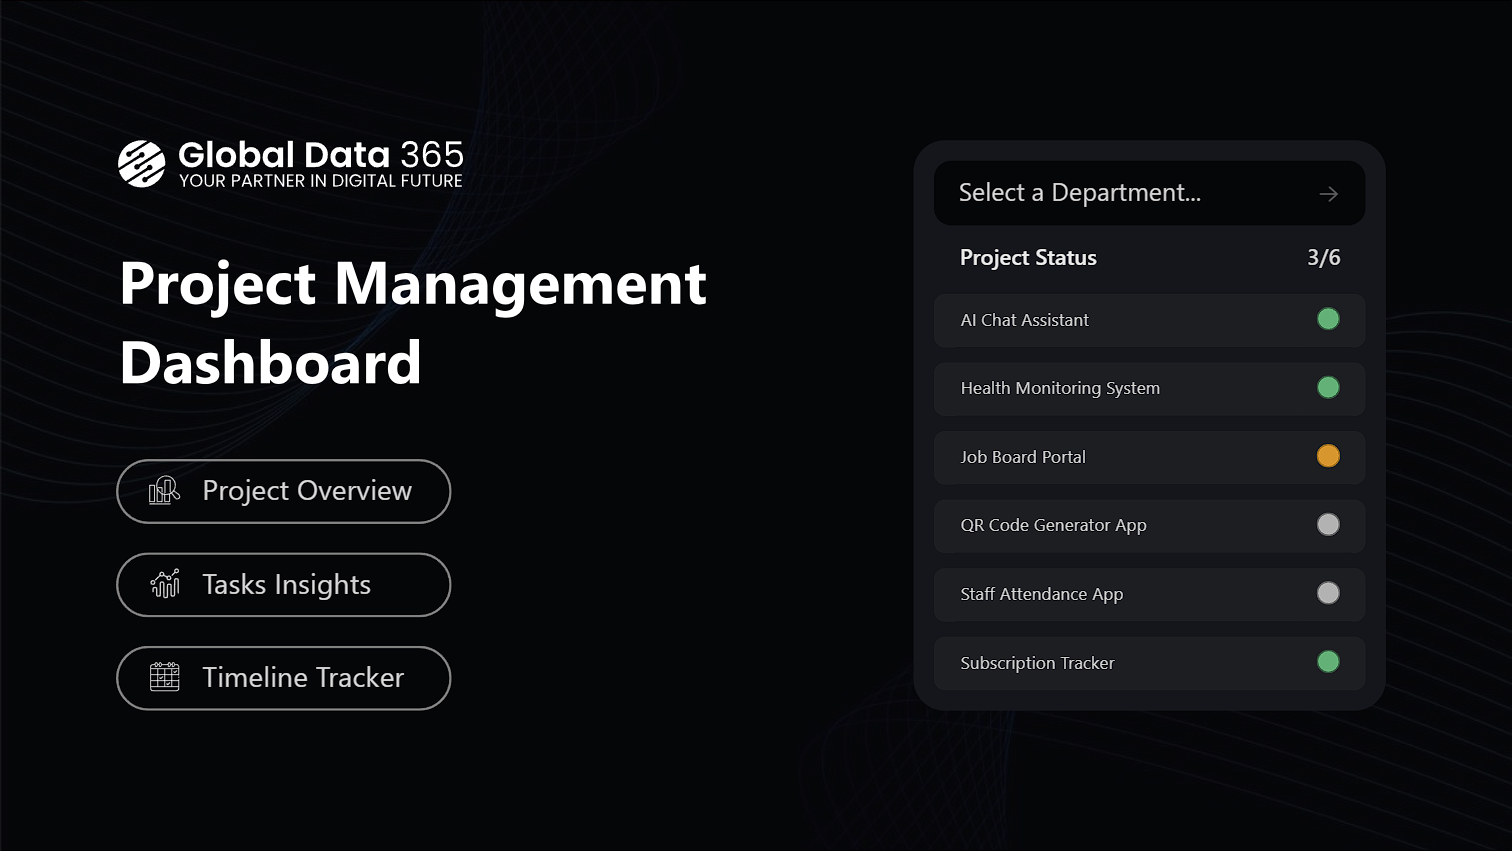
The Front Page of the Project Management Dashboard Power BI sets the stage for tracking project performance.
It connects Project Overview, Task Insights and Timeline Tracker, allowing users to navigate effortlessly between key insights. With a department filter, managers can focus on their own projects, track those nearing deadlines and monitor status in real time. Serving as a unified entry point, this page enables managers to quickly assess project progress and stay on top of priorities.
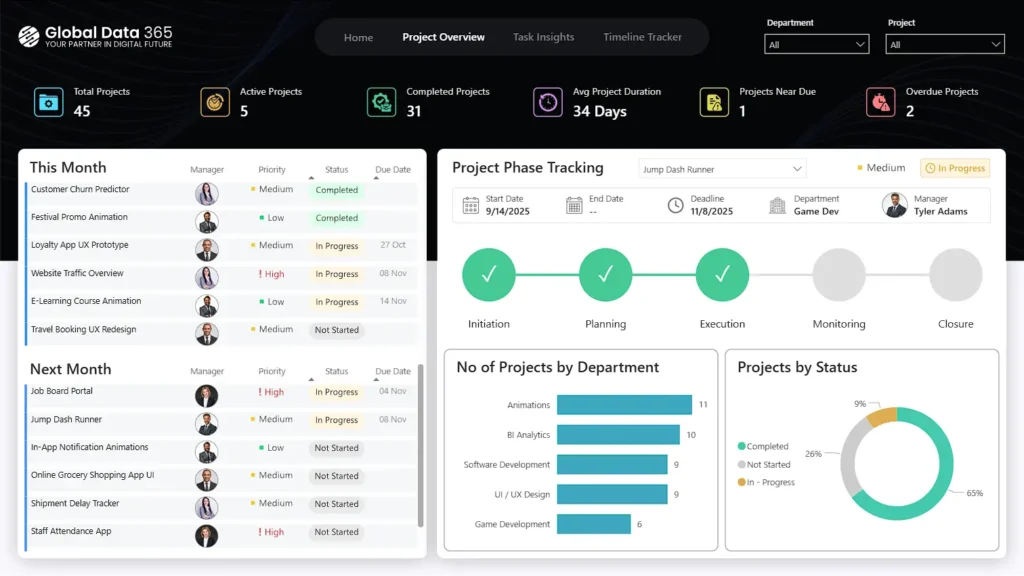
Project Overview
The Project Overview Dashboard provides a consolidated view of organizational projects and their progress.
It highlights total, active, completed, near-due, and overdue projects, along with the average project duration. With detailed visibility into project phases, department-wise distribution and project status, it enables managers to stay on top of deliverables. The monthly and upcoming project lists track priority, status, deadlines, and ownership, ensuring accountability and timely execution. This power bi project management dashboard empowers team leaders to balance workloads and drive projects to successful completion.
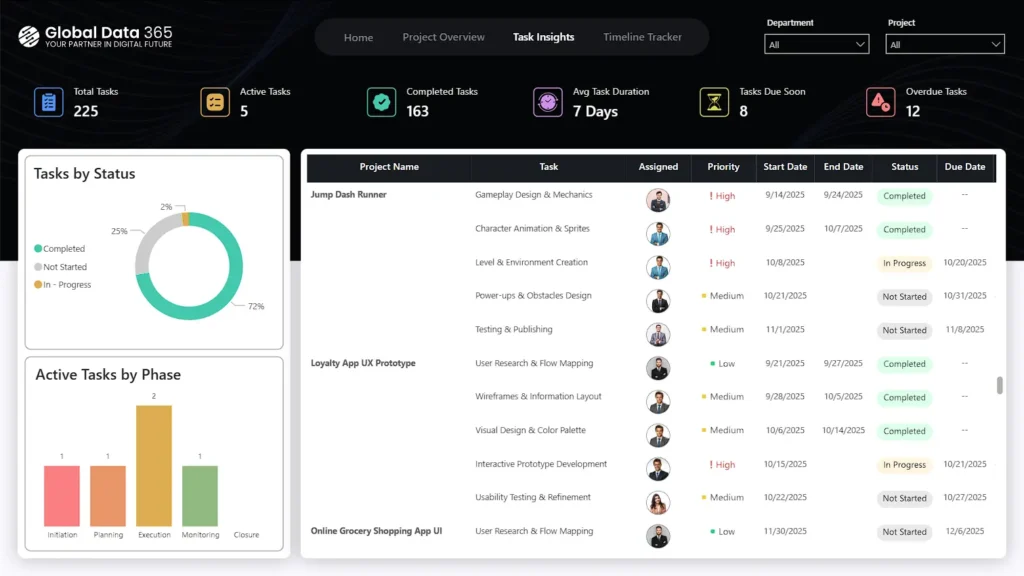
Task Insights
The Task Insights Dashboard provides a detailed breakdown of project tasks and their progress.
It highlights total, active, completed, due soon and overdue tasks, along with the average task duration. Clear visualizations of task status and phase distribution help managers track execution efficiency and identify bottlenecks. The task-level view captures priority, ownership, timelines and project status, helping managers ensure clarity and keep work on schedule. As a power bi project management dashboard, it also surfaces granular project details, offering deeper visibility into task execution.
Timeline Tracker
The Timeline Tracker Dashboard provides a clear view of project schedules and task timelines.
It highlights total and completed projects, overall project duration, total and overdue tasks. The Gantt chart maps out start and end dates for each project, showing progress across completed, in-progress and not-started tasks. With the ability to expand project details managers can track performance, monitor deadlines and ensure timely execution. By centralizing project schedules and task progress in one view, this dashboard empowers team leaders to anticipate delays and manage workloads effectively.
Get expert help to build your dashboard
Our Data Analysts work with hundreds of companies across all industries including hospitality, retail, manufacturing, technology, healthcare, marketing services, and more.
FAQs on Project Management Dashboard
A project management dashboard is a visual tool that provides a real-time overview of project progress, tasks, deadlines, KPIs and resources. It helps project managers and team leaders to monitor progress and directors to track manager's performance.
A dashboard provides transparency, reduces manual reporting, and enables quick decision-making. It helps teams stay aligned, managers monitor progress efficiently and get a clear view of project performance.
The pricing of power bi dashboard for project management depends on the features and customization required. For a detailed quote, please contact our sales team.
Currently, a mobile version of project management dashboard power bi template is not available, but we can develop a customized mobile version upon request.
Designing a dashboard for project management involves selecting a project management dashboard template or creating a custom layout in tools like Power BI, Excel, or Figma. Start by identifying key metrics such as project timelines, task completion rates, resource utilization, budget vs. actuals, and overall project health. You can use a project management dashboard design in Figma to plan the layout and ensure clarity before implementing it in Power BI or another tool. An effective project management dashboard provides real-time insights, simplifies tracking across multiple projects, improves decision-making, and ensures easy navigation for project managers, team members and directors.
Yes, a project management dashboard for multiple projects allows managers to view overall portfolio health, compare project timelines, monitor resource distribution, and prioritize critical initiatives across all active projects.
Project management KPIs (Key Performance Indicators) measure project performance. Common KPIs include on-time delivery, budget variance, task completion rate, and resource utilization. A KPI dashboard template displays these metrics in real time for quick evaluation.
More than 50+ companies trusted us to implement Power BI and transform their data into powerful insights


What Our Customers Have to Say About Us
The supply chain dashboard on Power BI has revolutionized the way we manage our operations, providing real-time insights that enable us to optimize for maximum efficiency. They were highly professional and responsive throughout the process, and we highly recommend their services.

Mahmoud Mohsen
IT Administrator - Alif
We are incredibly impressed with the sales dashboard designed for us on Power BI by Global Data 365. The dashboard has provided us with valuable real-time insights into our sales performance. We would highly recommend their services to anyone looking to take their sales analysis to the next level.

Ahmad Hammad, MBA
BI & ERP Specialist at SYH Retail - IKEA
Our finance dashboard from Global Data 365 has revolutionized the way we manage our finances, providing real-time insights that enable us to make informed decisions and drive business growth. The team was responsive and attentive throughout the design process, and we highly recommend their services.

Cesco Righetti
CFO - The Arts Club
Thanks to Global Data 365 for their outstanding Power BI service. We are grateful for the opportunity to work with Global Data 365’s team of talented and committed individuals

Mohammad Arshad
Financial Control & Reporting Assistant Manager - PepsiCo
It was a genuine pleasure working with Global Data 365. They consistently demonstrated patience, professionalism, and attentiveness to my requirements. Their expertise in Power BI is impressive; they quickly comprehends the concepts I aim to communicate and promptly provides effective solutions.

Rana Yaseen
Accounting Manager - Boston Scientific
Working with Global Data 365 has been a fantastic experience. Their Power BI reports have completely transformed how we analyze and use our data. The insights are clear, actionable, and have made decision-making so much easier for our team.

Tres Nelson
Manager BI - Signature Systems
Global Data 365 delivered an exceptional inventory dashboard for Baker Hughes. The Power BI solution provided real-time insights, streamlined inventory management, and improved decision-making across our operations.

Alan Siqueira
Inventory Manager - Baker Hughes
Related Resources