Logistics Dashboard
The Logistics Dashboard in Power BI provides real-time insights into key operational, financial and delivery metrics, helping you monitor the overall efficiency of your supply chain.
With a comprehensive view of shipment performance, delivery time and transport mode comparison, this dashboard empowers logistics managers to make data-driven decisions and optimize operations across domestic and international routes.
Experience Live Interaction With Logistics Dashboard.
Revolutionize Your Logistics Operations
Get a customized dashboard for logistics designed to optimize shipment visibility and drive faster, data-backed decisions.
Elevate Your Real Estate Dashboard for a More Engaging and Insightful Experience
Navigate your way to real estate success with our real estate dashboard example, leverage this powerful tool to make data-driven decisions and elevate your property performance.

Home Page
The front page of the Power BI Logistics Dashboard serves as the gateway to intelligent, data-driven logistics management.
Easily navigate between Overview, Domestic and International sections to monitor every stage of your supply chain. From tracking shipment performance and delivery efficiency to comparing transport modes and location-wise operations, this dashboard empowers logistics teams to make informed and smarter decisions for seamless delivery management.
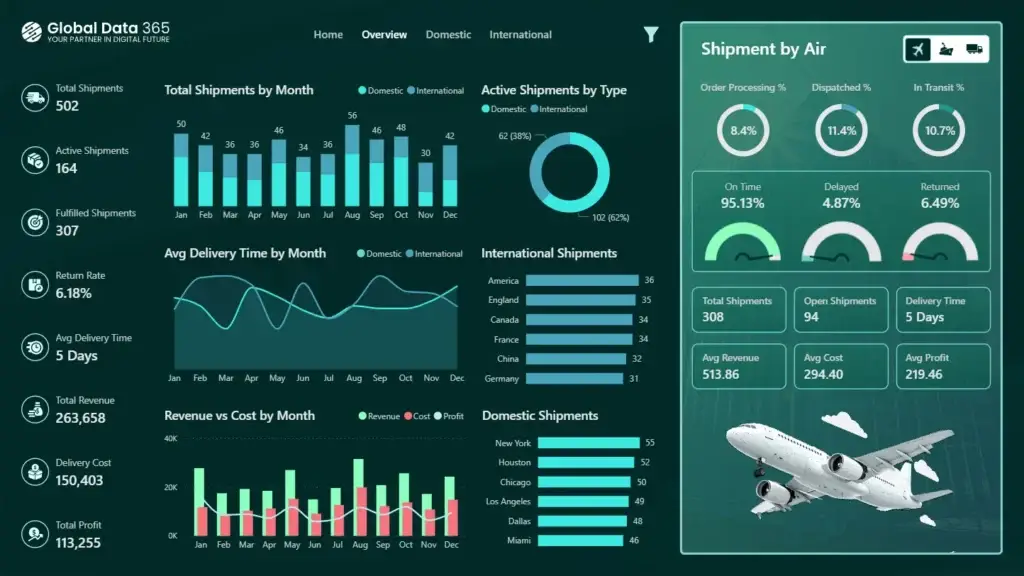
Logistics Overview
The Logistics Overview Dashboard Power BI provides a complete snapshot of shipment performance and supply chain operations.
It highlights total, active and fulfilled shipments, along with key metrics like return rate, average delivery time, total revenue and delivery cost. With visual insights into shipment activity such as monthly shipment trends, delivery time analysis, revenue vs. cost comparison and shipment breakdown by region and type. The filter card compare delivery types by transport mode to identify the most efficient routes, this power bi logistics dashboard empowers logistics managers to track delivery operations.
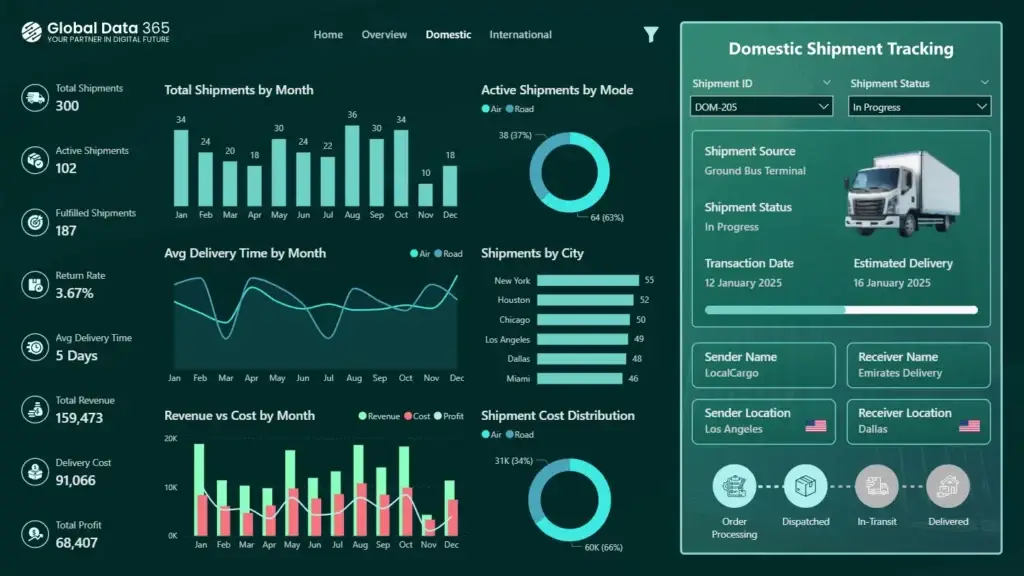
Domestic Insights
The Domestic Shipment Dashboard Power BI provides an in-depth view of local shipment performance and delivery operations.
It highlights total, active, and fulfilled shipments, with KPIs such as return rate, average delivery time, total revenue and delivery cost. With visual insights into monthly shipment trends, delivery time analysis, revenue vs. cost comparison and shipment breakdown by city and transport mode. The shipment tracking card displays detailed delivery progress, from order processing to dispatch and in-transit status, for complete visibility and across local shipment to help logistics teams evaluate domestic efficiency.
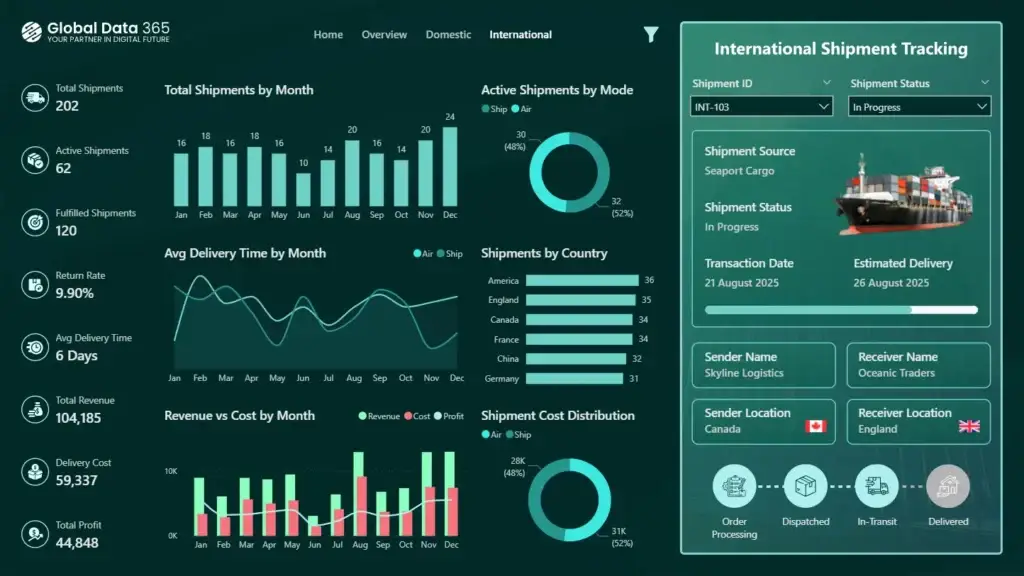
International Tracking
The International Shipment Dashboard Power BI provides a detailed overview of global shipment performance and cross-border operations.
It highlights total, active and fulfilled shipments, including KPIs such as return rate, average delivery time, total revenue and delivery cost. With visual insights into monthly shipment trends, delivery time comparisons, revenue vs. cost analysis and shipment breakdown by country and transport mode, this dashboard helps monitor international performance. The shipment tracking card allows users to follow each shipment’s journey, from port dispatch to delivery, for control across all international routes.
Get expert help to build your dashboard
Our Data Analysts work with hundreds of companies across all industries including hospitality, retail, manufacturing, technology, healthcare, marketing services, and more.
FAQs on Logistics Dashboard
ChatGPT said:
Yes, the Logistics Dashboard is designed to support both domestic and international shipment tracking. It provides a unified view of all shipments, local or global, allowing users to monitor delivery status, performance metrics and regional insights within a single platform. With filters for transport mode, region and shipment type, managers can easily compare and analyze logistics operations across borders for better visibility and control.
The pricing of power bi dashboard for logistics depends on the features and customization required. For a detailed quote, please contact our sales team.
Currently, a mobile version of logistic dashboard power bi template for shipments is not available, but we can develop a customized mobile version upon request.
A Logistics Dashboard in Power BI improves supply chain visibility by providing real-time insights into shipment performance, delivery times and transportation costs. It helps logistics managers track total, active and fulfilled shipments while identifying delays or inefficiencies across routes. With interactive visuals and automated analytics, teams can compare transport modes, reduce costs and enhance delivery accuracy. Moreover, this Shipment Dashboard Power BI enables data-driven decision-making through trend analysis and KPI monitoring helping organizations streamline operations and boost overall logistics efficiency.
Designing a dashboard for the logistics industry involves selecting a logistics dashboard template or building a custom layout in tools like Power BI or Figma. Begin by identifying key metrics such as total shipments, on-time delivery rate, transport cost, and return rate. Use logistics dashboard UI designs to visualize shipment performance, delivery trends, and route efficiency. An effective logistics dashboard design offers real-time insights, streamlines supply chain operations, and helps managers make data-driven decisions for improved delivery performance.
More than 50+ companies trusted us to implement Power BI and transform their data into powerful insights


What Our Customers Have to Say About Us
It was a genuine pleasure working with Global Data 365. They consistently demonstrated patience, professionalism, and attentiveness to my requirements. Their expertise in Power BI is impressive; they quickly comprehends the concepts I aim to communicate and promptly provides effective solutions.

Rana Yaseen
Accounting Manager - Boston Scientific
The supply chain dashboard on Power BI has revolutionized the way we manage our operations, providing real-time insights that enable us to optimize for maximum efficiency. They were highly professional and responsive throughout the process, and we highly recommend their services.

Mahmoud Mohsen
IT Administrator - Alif
Our finance dashboard from Global Data 365 has revolutionized the way we manage our finances, providing real-time insights that enable us to make informed decisions and drive business growth. The team was responsive and attentive throughout the design process, and we highly recommend their services.

Cesco Righetti
CFO - The Arts Club
Global Data 365 delivered an exceptional inventory dashboard for Baker Hughes. The Power BI solution provided real-time insights, streamlined inventory management, and improved decision-making across our operations.

Alan Siqueira
Inventory Manager - Baker Hughes
Working with Global Data 365 has been a fantastic experience. Their Power BI reports have completely transformed how we analyze and use our data. The insights are clear, actionable, and have made decision-making so much easier for our team.

Tres Nelson
Manager BI - Signature Systems
Thanks to Global Data 365 for their outstanding Power BI service. We are grateful for the opportunity to work with Global Data 365’s team of talented and committed individuals

Mohammad Arshad
Financial Control & Reporting Assistant Manager - PepsiCo
We are incredibly impressed with the sales dashboard designed for us on Power BI by Global Data 365. The dashboard has provided us with valuable real-time insights into our sales performance. We would highly recommend their services to anyone looking to take their sales analysis to the next level.

Ahmad Hammad, MBA
BI & ERP Specialist at SYH Retail - IKEA
Related Resources