D365 Finance and Operations (F&O) Dashboard: 5 Best Practices
- Ayesha Binte Habib
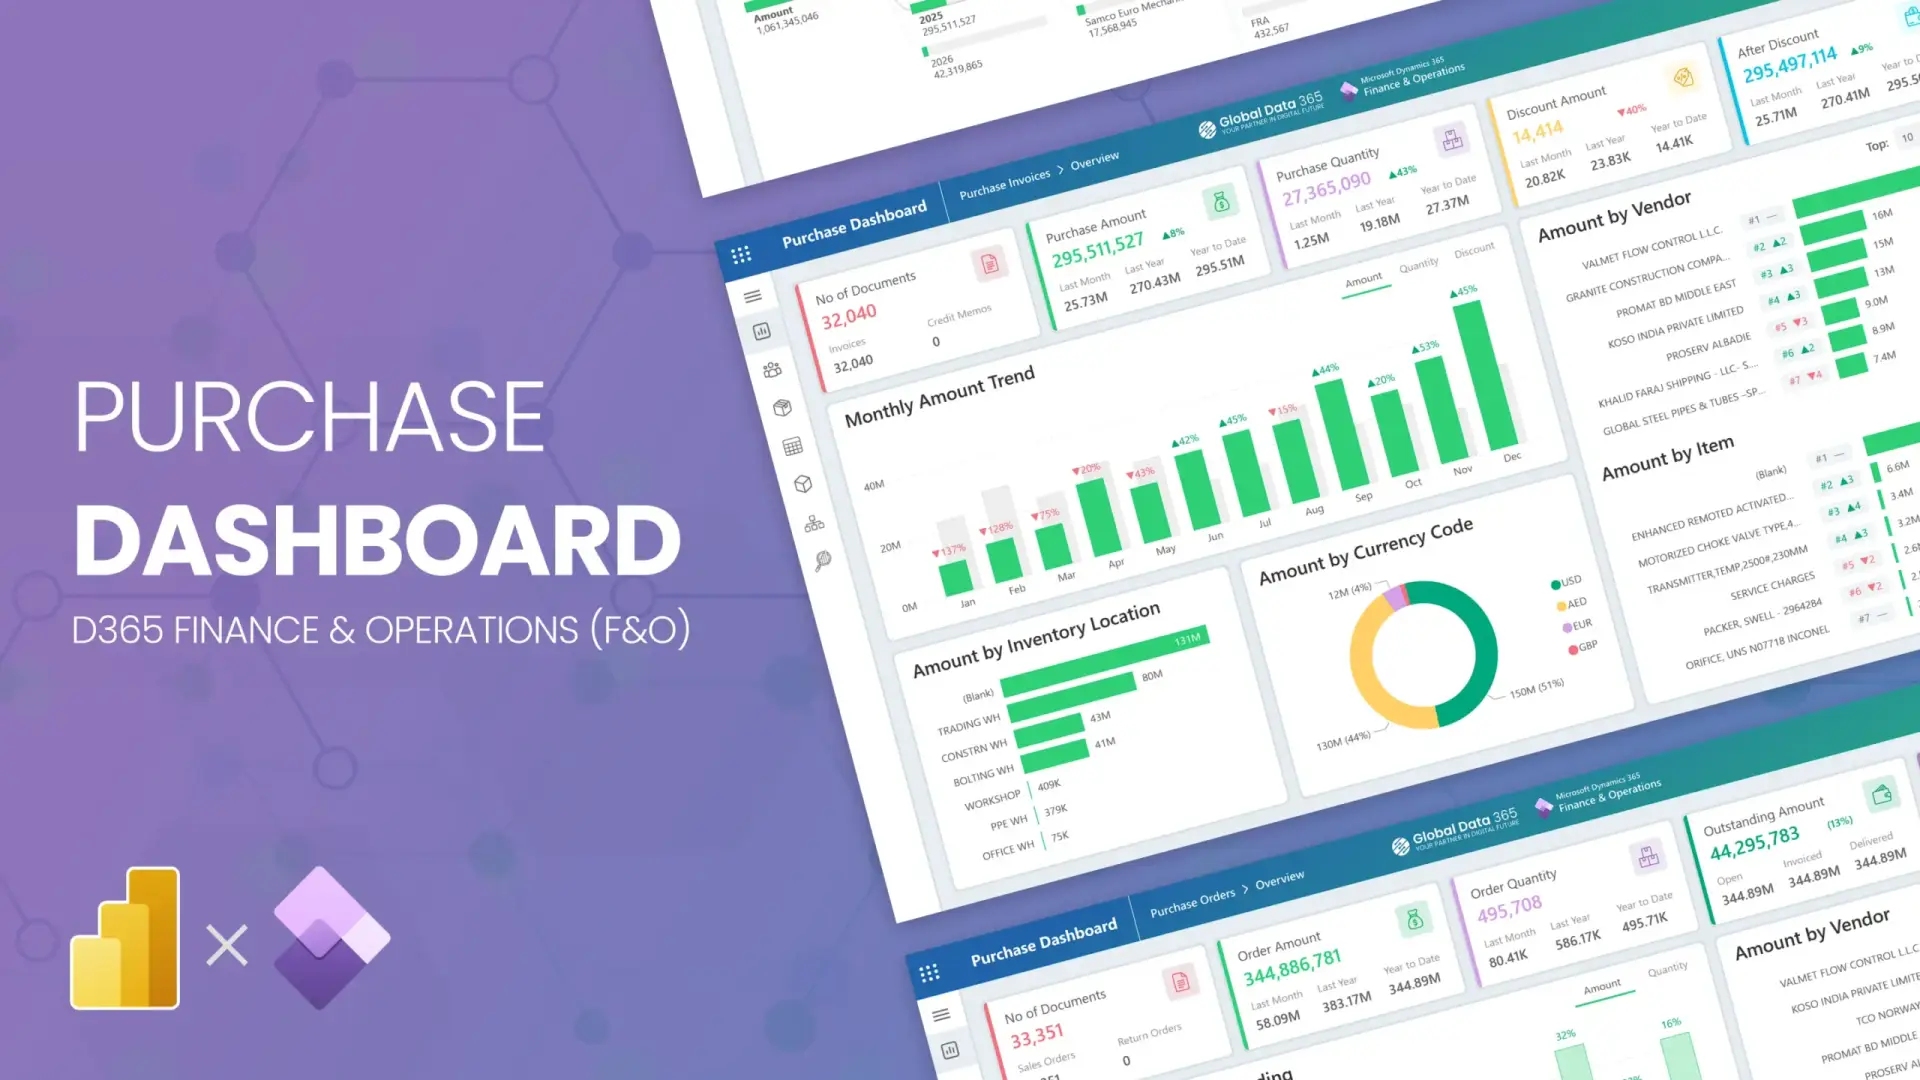
Most Dynamics 365 Finance and Operations environments do not have a reporting problem. They have a dashboard problem. Every financial transaction is in D365 F&O. General ledger entries, vendor invoices, customer receipts, intercompany postings, fixed asset movements, it is all there. What finance teams are missing is a finance operations dashboard that surfaces that data in a form the CFO can act on.
The gap is not the ERP. It is the dashboard built on top of it. In practice, most D365 F&O finance dashboards fail for the same three reasons: the schema is not cleaned before the data model is built, too much data is pulled and the output is built for a finance analyst rather than a CFO. Our guide covers what a correctly built Dynamics 365 finance operations dashboard includes and what gets left out.
What a Finance Operations Dashboard for D365 F&O Should Show?
A finance operations dashboard for Dynamics 365 has two distinct audiences. The mistake most implementations make is trying to serve both in the same view.
Executive layer — built for the CFO and leadership team:
- Live cash position by legal entity — current bank balances from D365 F&O treasury, refreshed daily. Not a month-end snapshot. Not a manually updated figure. A live number that reflects today’s position across every entity.
- Revenue vs budget variance — actual posted revenue against approved budget by business unit, with threshold-triggered highlighting when variance exceeds tolerance. The CFO sees exceptions, not every line.
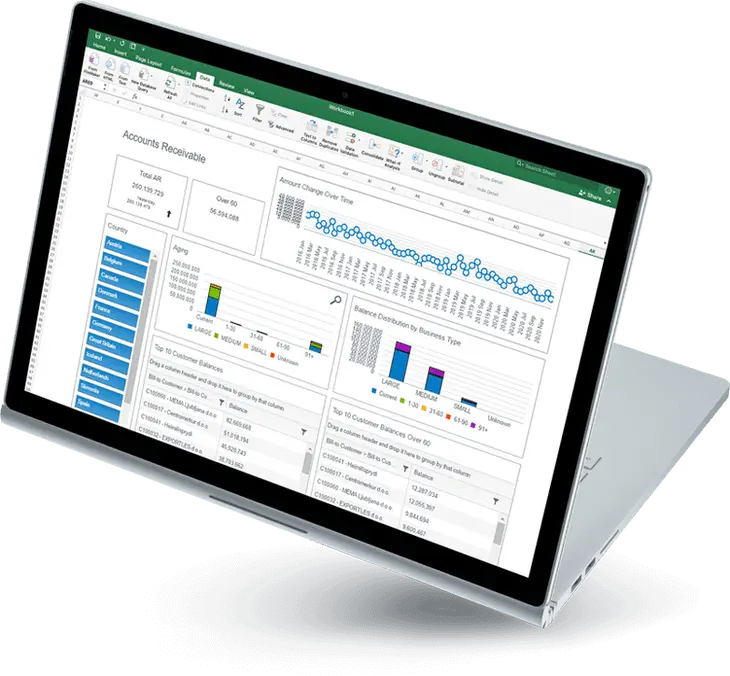
- Accounts receivable ageing with DSO trend — outstanding balances by ageing bucket (0–30, 31–60, 61–90, 90+) with a 12-period DSO trend line. A rising DSO is a cash flow warning signal that should be visible before month-end.
- Upcoming AP obligations — payment liabilities due in the next 7, 14, and 30 days. Essential for cash flow planning in multi-entity D365 F&O environments running centralised treasury.
- Net profit margin by entity — actual margin against plan, by legal entity and consolidated, refreshed on posted transactions.
Operations layer — built for finance managers and controllers:
- Period-close status — open periods, posted vs unposted journals, outstanding accruals, unreconciled bank lines. The checklist view that tells the controller exactly what is blocking close.
- Cost centre spend vs budget — actual expenditure against budget by cost centre and department, with drill-through to the D365 F&O transaction behind every figure.
- Vendor payment performance — average days to pay, early payment discounts captured vs missed, overdue exposure by vendor.
- Intercompany reconciliation status — open intercompany balances across legal entities, flagged by amount and days outstanding. In multi-entity environments, unreconciled intercompany positions are frequently six or seven figures and entirely invisible without a dedicated view.
None of these require custom development in D365 F&O. Every figure comes from standard F&O tables. The work is in building the D365 F&O reporting data model that joins these sources correctly.
See how we build finance operations dashboards for D365 F&O →
Dynamics 365 KPI Dashboard: Which Metrics Belong and Why
A Dynamics 365 KPI dashboard that tries to show everything shows nothing. Those dashboards with more than 12 KPIs at the executive layer get abandoned because finance leadership cannot extract a decision from 30 metrics on a screen.
One KPI that almost every client has requested and almost no one uses after go-live: forecasting. It looks essential in a demo. In practice, it requires clean historical data, consistent input discipline and a finance team with time to maintain it, even if it’s live it is just there to check whether the forecast is met or not and the clear set of actions are never generated by yes or no but the true numbers that present data shows over other kpis. The dashboards that get opened daily are built around what finance already trusts and needs to make a decision regarding strategy like posted actuals, live cash and real variance against budget.
Here are some common KPIs that were requested from us with a specific decision it was meant to support:
| KPI | Source in D365 F&O | Decision It Drives |
|---|---|---|
| Days Sales Outstanding (DSO) | AR transaction ledger | Collections prioritisation, credit policy review |
| Days Payable Outstanding (DPO) | AP transaction ledger | Working capital optimisation, supplier terms review |
| Budget Utilisation % | Budget register vs GL actuals | Overspend intervention before period close |
| Operating Cash Flow | Cash flow statement module | Treasury positioning, short-term borrowing decisions |
| Cost-to-Revenue Ratio | GL actuals by business unit | Efficiency benchmarking, headcount decisions |
| Fixed Asset NBV vs Depreciation | Fixed assets module | Capital planning, asset refresh scheduling |
| Intercompany Open Balance | Intercompany accounting | Month-end close risk, legal entity cash concentration |
| Gross Margin by Product Line | Sales + COGS from inventory | Pricing decisions, product mix review |
D365 F&O Reporting: Why Financial Reporter Cannot Build This?
Financial Reporter handles statutory outputs like audit-ready trial balance, fixed-format income statement. It is not adequate for D365 F&O reporting at the pace a finance team operates:
- Cannot join across modules. A finance operations dashboard combining AR, AP, cash, GL, and budget in a single view requires Power BI. A financial reporter produces one module at a time.
- Produces numbers, not decisions. A CFO sees a variance in Financial Reporter and opens another report to find out why. A properly built D365 finance operations dashboard lets them click that variance and drill to the transaction in two clicks.
- OData queries slow at scale. DirectQuery against D365 F&O OData degrades at high transaction volumes. The correct architecture is Power BI import mode with incremental refresh, dashboards open in under two seconds regardless of ledger volume.
- Row-level security is not automatic. D365 F&O and Power BI have separate security models. RLS must be built explicitly mapped to your legal entity and cost centre structure, before deployment. A D365 F&O reporting implementation that skips this creates data visibility problems that surface quietly, every day, until someone notices.
Book a scoping call, we’ll map what your D365 F&O data can support before you commit →
The Real Reason D365 Finance Operations Dashboard Fail
After dozens of implementations across the UAE, Saudi Arabia, and the United States, the same root cause appears when a dashboard is abandoned within 20 days of go-live.
It is not the visuals. It is not the KPI selection. It is the data model underneath.
The most common problem: the schema was not cleaned before the data model was built. Too much data was pulled from D365 F&O into Power BI, unfiltered, unjoined, with no star schema structure. The result is wrong numbers. The two figures that appear inflated most often are sales amount and receivables both double-counted because transactions are pulled from multiple tables without deduplication logic.
A finance team that sees their receivables figure overstated by 30% on day one will not open that dashboard again.
The second reason dashboards stop being used: they were built for accuracy, not clarity. A dashboard that is technically correct but shows 25 KPIs and three scrolling tables will not be opened before a board call. Clear insights retain users. Accurate figures alone do not.
The CFO’s measure of a successful finance dashboard is simple: they no longer need to ask the finance team or IT what the company’s financial position is, everything at their fingertips before anyone is called.
5 Best Practices for Building a D365 Finance Operations Dashboard That Gets Used
- Star schema before visuals. Fact tables for GL entries, AR, AP, budget, and cash. Dimension tables for date, legal entity, cost centre, vendor, and customer. Visuals built on flat D365 F&O exports produce wrong aggregations under any filter combination.
- Import mode, not DirectQuery. Pre-aggregate the data. Use incremental refresh to keep it current. A dashboard that takes 15 seconds to load will not be opened before a board call.
- Design for two audiences separately. Executive layer: 8–10 KPIs, no tables, no scrolling, one screen. Operations layer: full drill-through with transaction-level detail. One report trying to serve both serves neither.
- RLS on day one. Controllers see their legal entity. Regional heads see their cluster. The CFO sees everything. Never retrofitted.
- Train finance, not just IT. A dashboard that requires an IT request to change a date filter will stop being used within 90 days.
What Global Data 365 Delivers
We build Power BI finance operations dashboards for Dynamics 365 Finance and Operations, star schema data model, full KPI layer, drill-through reports, RLS configuration, and finance team training so your team owns it post go-live.
Delivered across MEA and North America within standard timeline: 1-2 weeks.
Request a finance operations dashboard → · Request a price →
Get Atlas for Dynamics 365 Reporting
Search Blog
Related Resources