Fixed Assets Dashboard
Gain complete visibility into your asset lifecycle with the Fixed Assets Dashboard in Power BI, empowering you to track acquisitions, depreciation, disposals, and changes in net book value through dynamic visuals.
Effortlessly track change in fixed assets and analyze overall net book value all within a single, interactive, insights-driven dashboard.
Experience Live Interaction With Our Fixed Assets Dashboard.
Get your Customized
Fixed Assets Dashboard
We craft a custom dashboard that makes tracking your stock simple and helps you make informed decisions with confidence!
Optimize Every Stage of Your Asset Lifecycle
Streamline asset management with a Power BI Fixed Assets dashboard that delivers real-time visibility into asset performance to optimize asset utilization for smarter, cost-effective decision-making.
Fixed Assets Dashboard
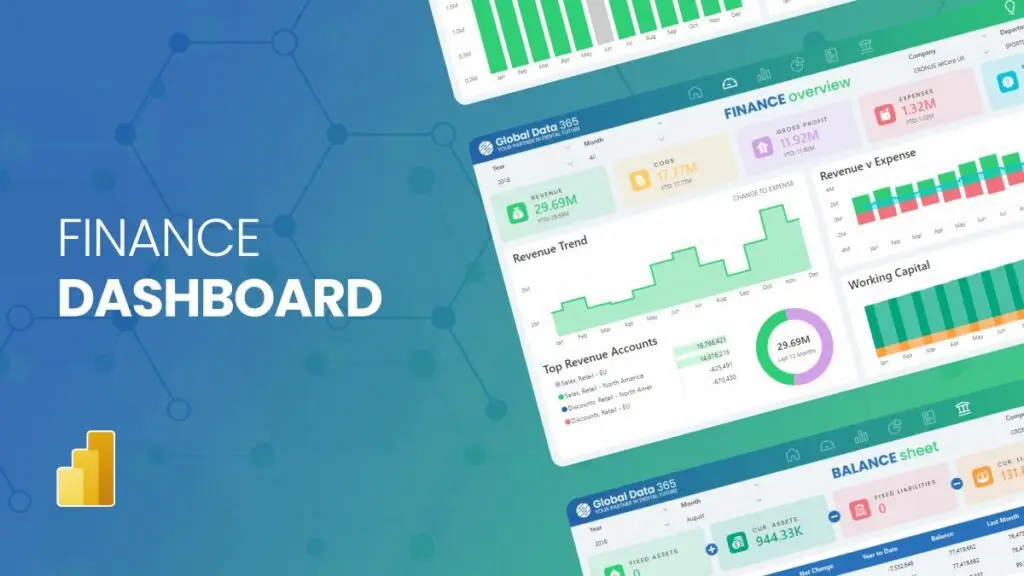
The Fixed Assets Dashboard delivers key KPIs at a glance, helping you monitor beginning amounts, acquisitions, depreciation, disposals and net book value. It highlights changes over time, enabling quick identification of trends and shifts in asset value throughout the lifecycle.
Interactive visuals allow you to explore each KPI in detail, with breakdowns by month, asset group, and location. The dashboard provides a clear, flexible view to support informed asset management decisions.


Fixed Assets Details
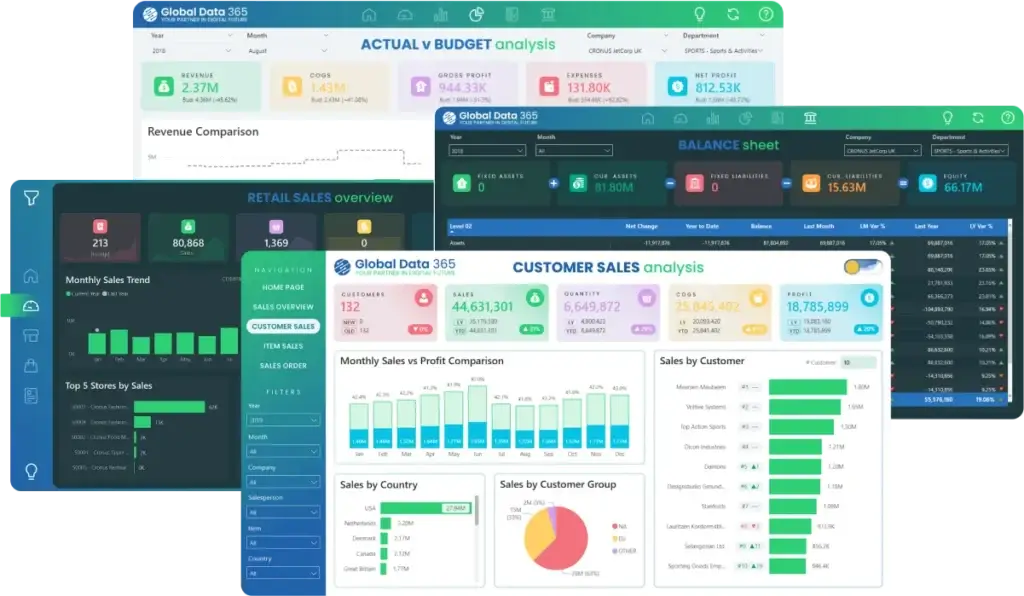
This detailed table in the Fixed Assets Dashboard offers a complete view of each asset’s lifecycle, presenting key metrics such as Beginning Amount, Acquisition, Depreciation, Disposal and Net Book Value. With intuitive filters by year, quarter, month, asset, group, and location, users can dive deep into the data for precise analysis.
The breakdown supports stakeholders in tracking asset performance, evaluating depreciation impact, and making confident, data-driven decisions for capital planning and asset management.
Get expert help to build your dashboard
Our BI Professionals work with hundreds of companies across all industries including retail, manufacturing, technology, healthcare, marketing services, and more.
FAQs on Fixed Assets Dashboard
The cost of the dashboard is tailored to your specific requirement and customization needs. Please contact our sales team for more information.
The implementation time for the dashboard varies based on project's scope and no. of pages. Typically, it can take between 3 to 10 days.
Yes, the dashboard design is fully customizable. You can personalize colors, fonts, and layout to match your brand identity.
To get started with the power bi dashboard for fixed assets, please reach out to our sales team. They will guide you through the onboarding process, including set up, customization and training.
It provides real-time visibility into asset value, fixed assets depreciation, and acquisitions, helping you optimize asset usage, reduce waste, streamline audits, and support smarter financial planning.
The customization process involves discussing your specific requirement with our team, defining the scope of customization and then implementing the changes. We ensure the dashboard meets your unique business needs.
More than 50+ companies trusted us to implement Power BI and transform their data into powerful insights


What Our Customers Have to Say About Us
It was a genuine pleasure working with Global Data 365. They consistently demonstrated patience, professionalism, and attentiveness to my requirements. Their expertise in Power BI is impressive; they quickly comprehends the concepts I aim to communicate and promptly provides effective solutions.

Rana Yaseen
Accounting Manager - Boston Scientific
Our finance dashboard from Global Data 365 has revolutionized the way we manage our finances, providing real-time insights that enable us to make informed decisions and drive business growth. The team was responsive and attentive throughout the design process, and we highly recommend their services.

Cesco Righetti
CFO - The Arts Club
Working with Global Data 365 has been a fantastic experience. Their Power BI reports have completely transformed how we analyze and use our data. The insights are clear, actionable, and have made decision-making so much easier for our team.

Tres Nelson
Manager BI - Signature Systems
Thanks to Global Data 365 for their outstanding Power BI service. We are grateful for the opportunity to work with Global Data 365’s team of talented and committed individuals

Mohammad Arshad
Financial Control & Reporting Assistant Manager - PepsiCo
We are incredibly impressed with the sales dashboard designed for us on Power BI by Global Data 365. The dashboard has provided us with valuable real-time insights into our sales performance. We would highly recommend their services to anyone looking to take their sales analysis to the next level.

Ahmad Hammad, MBA
BI & ERP Specialist at SYH Retail - IKEA
Global Data 365 delivered an exceptional inventory dashboard for Baker Hughes. The Power BI solution provided real-time insights, streamlined inventory management, and improved decision-making across our operations.

Alan Siqueira
Inventory Manager - Baker Hughes
The supply chain dashboard on Power BI has revolutionized the way we manage our operations, providing real-time insights that enable us to optimize for maximum efficiency. They were highly professional and responsive throughout the process, and we highly recommend their services.

Mahmoud Mohsen
IT Administrator - Alif
Related Resources