How Power BI Enhances Microsoft Dynamics 365 Business Central Reporting
- Global Data 365
Having accurate financial data is necessary but understanding what that data actually means is what drives a company forward. Microsoft Dynamics 365 Business Central serves as a powerful tool for tracking your inventory, vendor payments, and daily cash flow. Yet, trying to identify growth opportunities by staring at endless rows of numbers will be a little difficult for any business owner. In this context, Power BI unlocks the true potential of your ERP data. This dedicated analytics tool connects directly to your Business Central data to produce clear, colorful visual metrics. It helps your team gain instant clarity to spot trends and fix hidden issues.
Throughout this blog, let us look at the specific technical features, the practical aspects, and how this visual tool upgrades your data strategy and enhances your daily business reporting.
How Power BI Connects Natively to Business Central Data
In the past, connecting an ERP system to a visual reporting tool required significant technical work. IT departments had to write custom scripts to get data, or finance teams had to export CSV files manually every single week. This meant business reports were always delayed. Because Microsoft developed both of these platforms, they share a unified technical environment. Power BI uses pre-built API connectors to link directly to your Business Central database. You do not need to hire programmers to build a custom bridge.
Once the connection is authorized, the business intelligence platform automatically refreshes your data based on a schedule you define. You can configure the system to refresh your financial dashboards every morning or even multiple times throughout the day.
With data automatically syncing, accountants no longer need to export and consolidate reports manually.
Using Power BI Interactive Visuals to Replace Static Reports
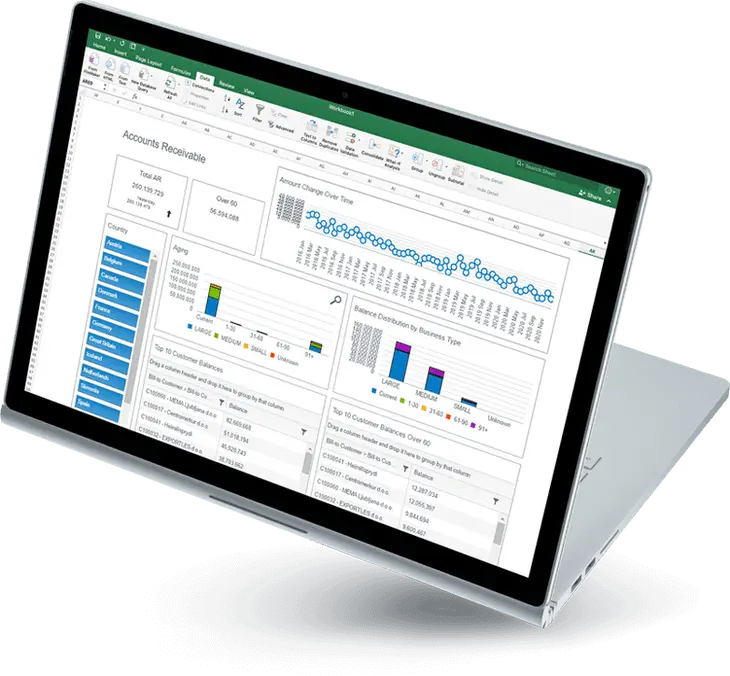
A standard financial report generated directly from an ERP is usually a static document. It only displays a fixed set of numbers. If a manager reviews a static sales report and sees a sudden drop in revenue for a specific product line, the report cannot explain the reason behind the drop. The manager has to request a completely new document to investigate the issue.
Power BI avoids these hassles with interactive visual workspaces. The software features a function called cross-filtering. If you look at a digital dashboard containing a revenue bar chart, a regional map, and a list of top customers, these visuals work together dynamically.
When you click on a specific product category in the bar chart, the regional map instantly updates to show where that specific product is selling. The customer list also shifts to display only the buyers who purchased that item. This drill-down capability allows any user to filter data intuitively and find the root cause of a business trend in seconds.
While this level of interaction makes internal accounting and ERP data highly powerful to explore, a complete business view cannot depend on ERP data alone. Much of the essential information also comes from external sources that work outside the core accounting system. However, valuable business insights often require data beyond the ERP system itself.
How Does Power BI Blend External Data With Business Central Ledgers?
Your ERP platform is the financial core of your company, but it rarely holds every piece of operational data. Some companies use separate software applications for email marketing, customer relationship management and website analytics. Keeping these data sets separated creates blind spots for the management team. You cannot easily see how your marketing efforts affect your actual sales.
Power BI acts as a central hub that can blend data from hundreds of different external sources. It allows you to build a single data model that combines your Business Central ledgers with information from outside platforms.
For instance, you can import your monthly digital advertising spend from a marketing tool and display it directly next to the invoiced sales data provided by your accounting software. By viewing the marketing costs and the resulting revenue on the exact same screen, your management team can accurately calculate the return on investment for their advertising campaigns. Blending multiple data sources provides a complete view of company performance.
Once these different data sources are unified, you get a clear and reliable view of current business performance. The next step is to go beyond understanding the present and start using this combined data to anticipate future outcomes.
Leveraging Power BI Predictive Analytics for Financial Forecasting
Reviewing historical sales data is necessary for compliance, but predicting future cash flow is what actually keeps a business secure. Doing manual forecasting using spreadsheets is incredibly difficult. It requires complex formulas and a lot of guesswork regarding seasonal trends and customer payment habits.
Power BI includes built-in predictive analytics and forecasting algorithms that take the guesswork out of planning. The tool analyzes the historical data stored inside Business Central to identify hidden patterns.
You can apply a forecasting feature to a standard line chart tracking your monthly revenue. The system will look at your past performance, factor in seasonal dips and draw a projected path for the upcoming quarter. It even displays a shaded confidence interval to show the high and low estimates of the prediction. This feature helps procurement managers identify inventory consumption trends and support replenishment planning when relevant operational data is available. This gives them enough time to place new vendor orders before a stockout occurs.
While forecasting strengthens planning for inventory and cash flow, its value is maximized only when these insights are distributed throughout the organization with proper security controls.
Securing Your Reports With Power BI Row-Level Security
Distributing financial reports always presents a security challenge. Sending Excel files through email or printing out physical packets makes it very easy for sensitive organizational data to be leaked or accessed without permission.
Power BI solves this administrative burden through a feature known as Row-Level Security. This security feature allows your IT team to create a single master dashboard for the entire company.
When an employee logs into their online portal or mobile app, the system checks their identity. It then filters the data on the dashboard based on their specific security clearance. A regional sales manager can open the dashboard and only see the revenue figures for their specific territory. The overall corporate totals and the data for other regions remain completely hidden.
This lets you distribute powerful reporting tools across your organization without compromising data privacy.
Beyond secure access, Power BI dashboards are available through web browsers, tablets, and mobile devices. This allows executives, finance teams, and department managers to monitor key performance indicators, review financial metrics, and respond to operational issues even when they are away from the office. Having access to critical business insights from anywhere helps decision-makers stay informed and act quickly when circumstances change.
Wrapping Up
The main goal of any accounting system is to clearly show where your business stands at any point in time. Microsoft Dynamics 365 Business Central captures and records financial details with precision, while Power BI turns that raw data into clear, visual insights that are easy to understand at a glance and use for better decision-making.
When these two systems work together, it removes the need for repeated manual data exports and keep reporting continuously up to date. It also allows you to combine internal financial data with external sources like marketing performance, giving a more complete picture of business performance and enabling more accurate cash flow forecasting. For management teams, this creates a stronger ability to plan ahead with confidence rather than react after the fact.
At the same time, row-level security ensures that each user only sees the data relevant to their role, protecting sensitive information without limiting access to insights. With this combination of real-time visibility, integrated data, and controlled access, teams can quickly identify small issues early and address them before they grow into costly problems.