Power BI Manufacturing Dashboards for Dynamics 365 Business Central
- Ayesha Binte Habib
Manufacturing companies running Dynamics 365 Business Central have all the data they need. Production orders, inventory movements, purchase receipts, sales shipments, it’s all in there. What most don’t have is a way to see it.
Standard Business Central reports were built for compliance, not operations. They show you what happened. They don’t show your plant manager why output dropped last week, or show your CFO which product lines are eroding margin.
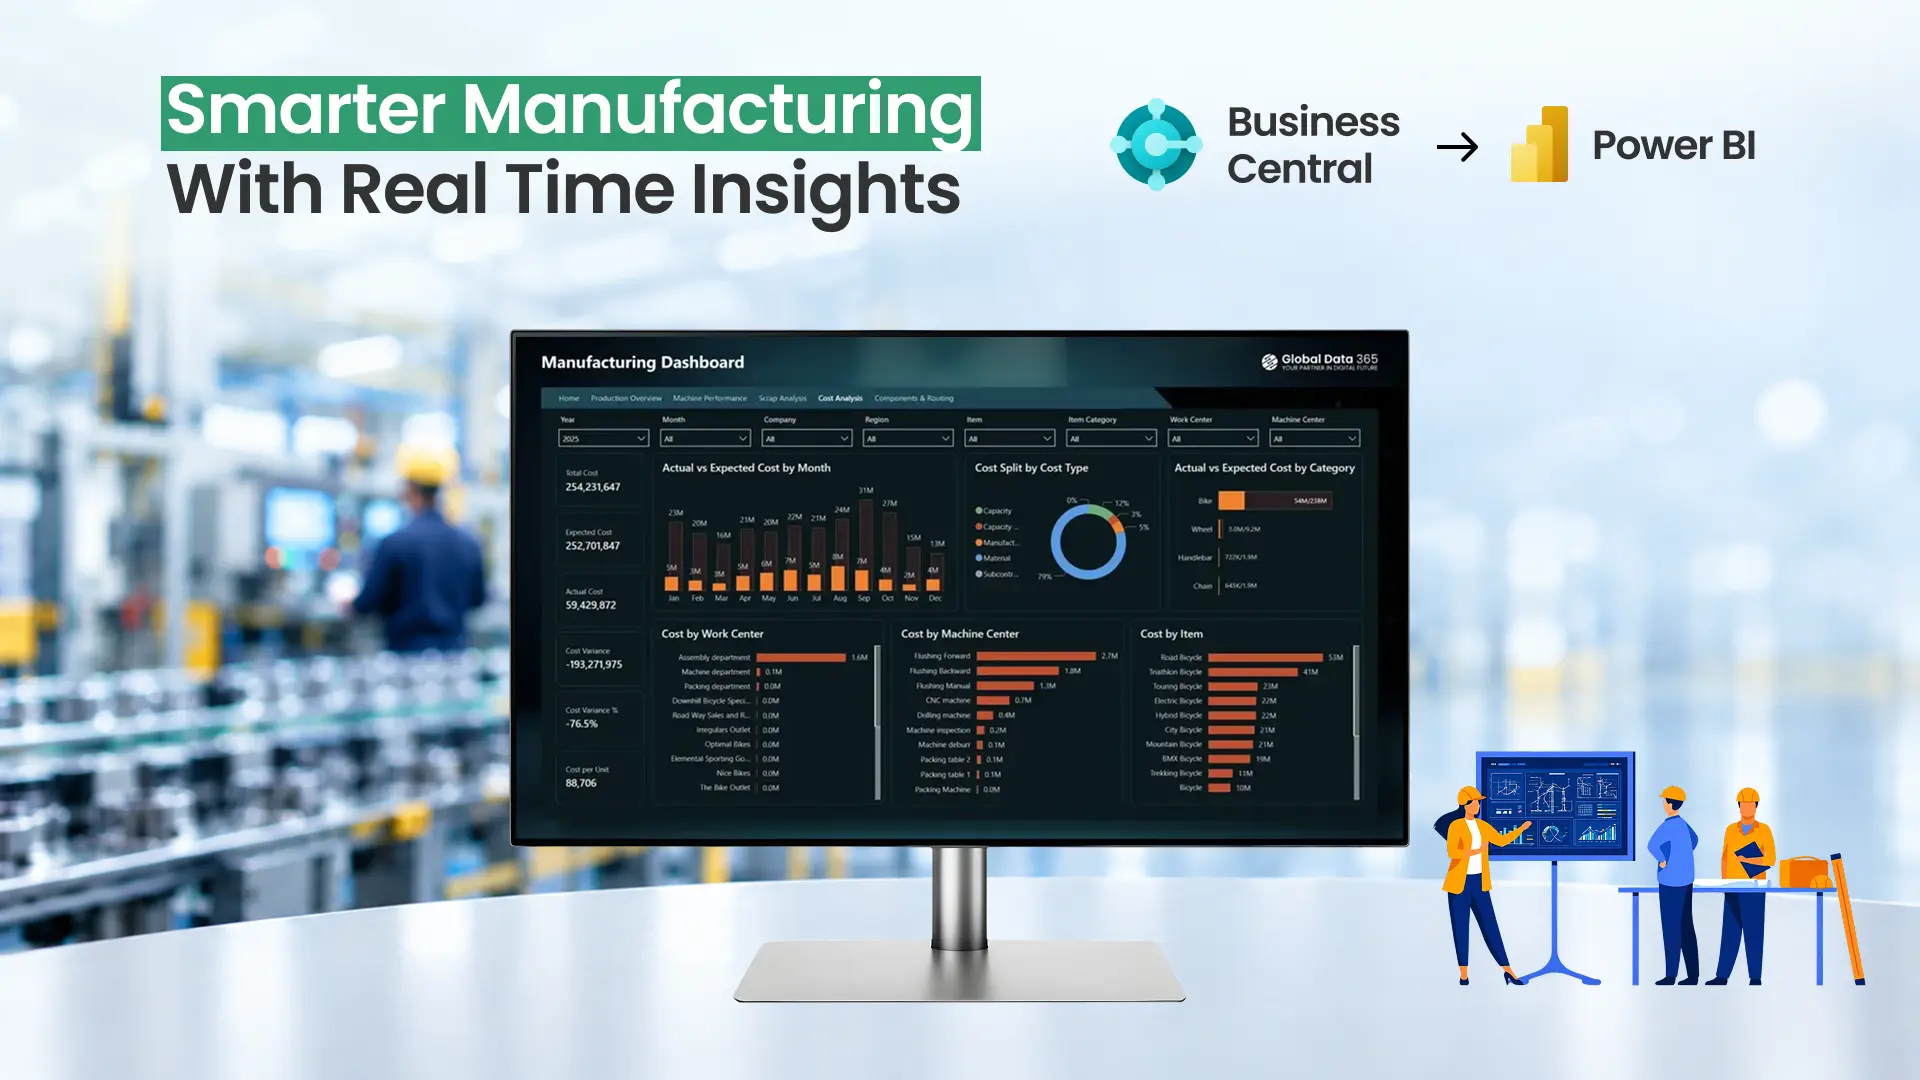
That’s the gap a Power BI manufacturing dashboard closes and it’s the most common engagement we deliver for manufacturing clients on Business Central across the UAE, Saudi Arabia, and the United States.
What a Power BI Dashboard for Manufacturing Should Show?
A dashboard built for manufacturing operations has two audiences: the plant floor and the boardroom. The metrics that matter to each are different, but they pull from the same Business Central data.
Operations layer – what the plant manager needs:
- OEE (Overall Equipment Effectiveness):
Availability × Performance × Quality, calculated from production order actuals vs. planned. BC holds the inputs; Power BI does the math in real time. - Production output vs. plan:
Actual units produced against the production order target, by line, by shift, by day. Variances highlighted automatically. - WIP (Work in Progress):
Open production orders by status, planned, released, finished with time in status and expected completion dates. - Scrap and defect rate:
Finished item quantity vs. output quantity, with drill-through to the specific production order and the responsible work centre.
Finance and leadership layer – what the CFO needs:
- Inventory turns by item category:
Calculated from BC’s item ledger. Slow-moving stock identified by exception, not by digging through reports. - Material cost variance:
Actual material consumption vs. standard cost, by production order. This is where margin leaks in manufacturing and where most BC clients have no visibility. - Purchase-to-production lead time:
Average days from purchase order to item availability, by vendor and item. Feeds directly into production scheduling decisions. - Revenue by product line:
Sales shipments mapped back to manufactured item groups, with margin overlay where standard cost is configured in BC.
None of these require custom development in Business Central. Every number comes from standard BC tables. The work is in building the right Power BI data model to surface them cleanly.
Why Standard Business Central Reports Don't Cover This?
BC’s native reporting, the built-in role centres, the RDLC reports, even the Excel export was designed around transaction verification, not operational analytics. A few specific problems manufacturing clients hit:
– No cross-entity joins.
Business Central reports one entity at a time. A dashboard that combines production orders, item ledger entries, and sales shipments in a single view requires Power BI’s data model layer it cannot be done natively in BC.
– No real-time aggregation.
BC’s built-in analytics run on-demand queries that slow under load. A Power BI import model pre-aggregates everything so dashboards open in under two seconds regardless of transaction volume.
– No visual drill-through.
A BC report shows a number. A Power BI business central manufacturing dashboard lets a plant manager click an OEE figure and drill to the specific work centre, then to the specific production order, in two clicks.
See a sample manufacturing dashboard built on Business Central →
What We Deliver as Power BI Dashboard for Manufacturing Companies?
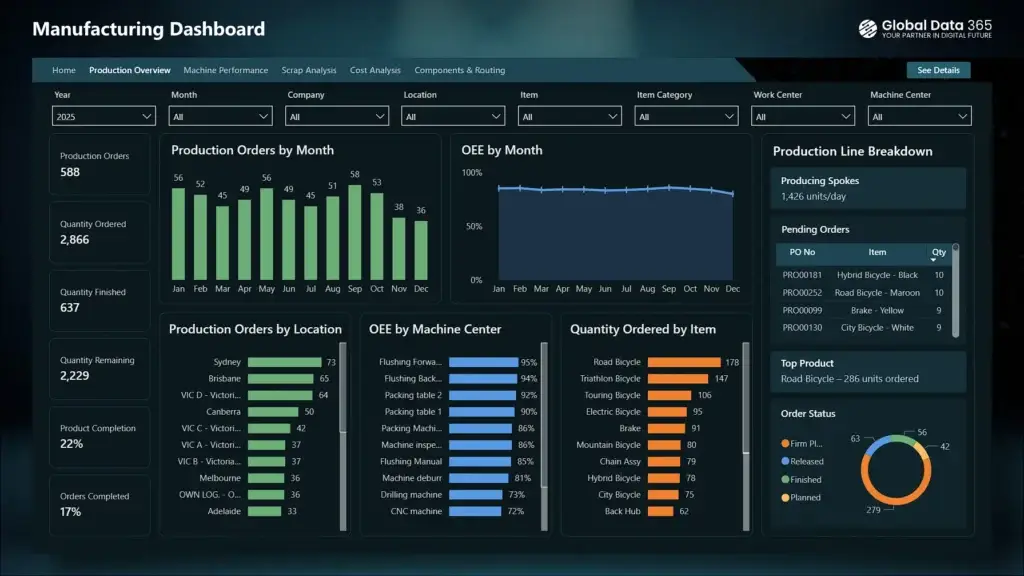
Our Power BI manufacturing dashboard service for Business Central clients covers:
- Data model build:
Star schema connecting production orders, item ledger, capacity ledger, purchase receipts, and sales shipments. Optimised for import mode with incremental refresh. - OEE calculation layer:
Custom DAX measures for availability, performance, and quality rates mapped to your specific production setup in BC. - KPI dashboard:
Executive-facing view with the 8–10 metrics your leadership team reviews weekly. - Operational drill-through reports: Plant-level views with shift-by-shift breakdown and work centre performance.
- Row-level security:
Plant managers see their lines; the CFO sees everything. - Training:
Your team learns to build their own views and modify existing reports we don’t leave you dependent on us for every change.
Delivery timeline is typically 3–5 weeks depending on the complexity of your production setup and whether your BC data is clean.
Request a manufacturing dashboard for your Business Central environment →
Who This Is For?
This engagement is the right fit if:
- You’re running Dynamics 365 Business Central (cloud or on-premise) with production orders active
- Your operations team is still pulling data manually into Excel for weekly reporting
- You’ve tried BC’s built-in role centre and found it too limited for your reporting needs
- You want live visibility into production performance without waiting for month-end
If you’re running Dynamics 365 F&O on the manufacturing side, we deliver the same solution set the data model is different but the approach is identical.
Get Your Business Central Dashboards Delivered in Days
We’ve delivered Power BI dashboards for manufacturing companies running Business Central across the Middle East and North America. The same methodology, the same data model patterns, adapted to your production setup.
Book a 30-minute scoping call, we’ll confirm what’s buildable from your BC data before you commit →
Get a quote on Power BI Manufacturing Dashboard
Search Blog
Related Resources
Business Central Dashboards with Power BI
Power BI Business Central Integration 2026

Power BI Training for Dynamics 365
D365 Business Central Power BI Dashboard in Texas