Claude Dashboard vs Traditional BI Reporting: Working, Problem Gaps and 17 Key Differences
- Ayesha Binte Habib
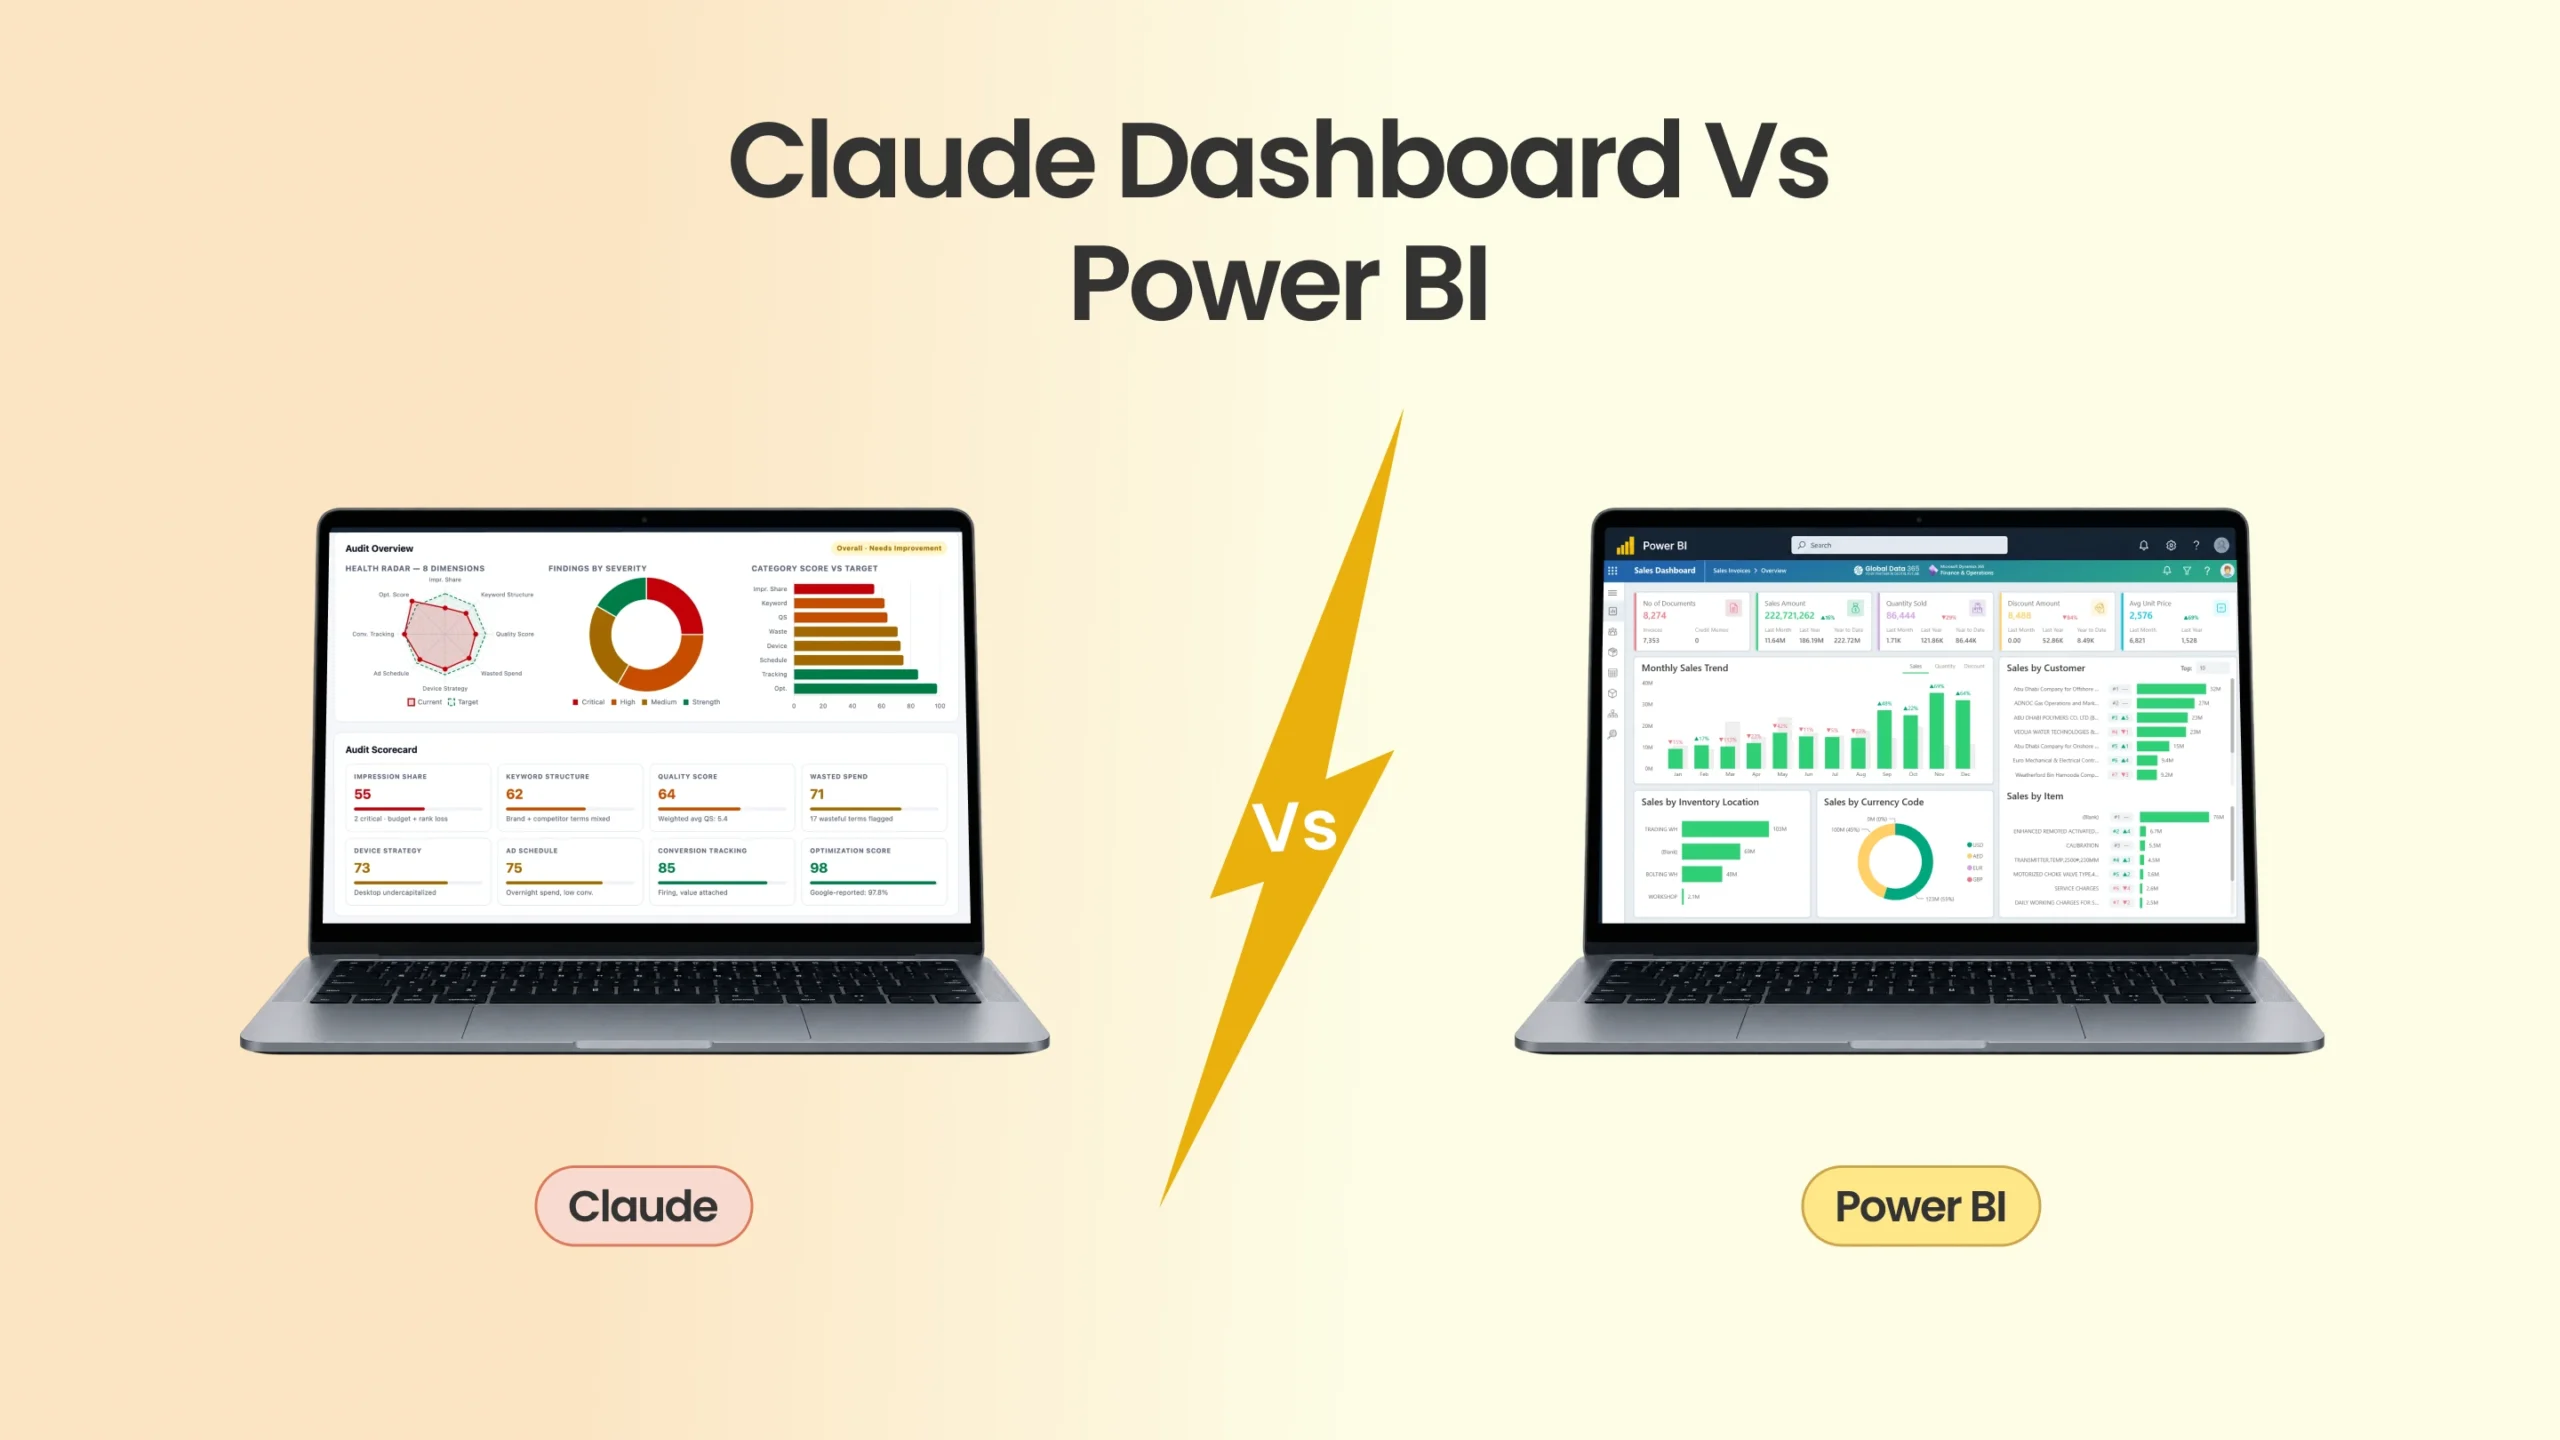
Claude Dashboards launched on 8 October 2026 and they are more capable than most initial coverage suggests. They can connect live to Power BI semantic models through the Power BI MCP server. They display the query behind every number. They are shareable within an organisation with a link. For exploratory questions and prototype analyses, they are genuinely fast and useful. For enterprise reporting such as month-end close, board packs, statutory accounts, multi-entity consolidation, they introduce governance, data integrity and compliance risks that a traditional BI reporting pipeline built on business intelligence tools like Power BI, Jet Reports, Wands or Jet Analytics does not. This article explains exactly what the risks are with claude dashboard and why the governed BI reporting pipeline remains the correct infrastructure for every decision that gets signed off.
What Claude Dashboards Actually Are and What They Can Now Do
Claude Dashboards are shareable HTML artifacts built through a conversation with Claude. Each dashboard has one page and one or more datasets. The datasets can be static file extracts or live query connections. Every value in the dashboard must trace back to a dataset and you can click any number and see the query or file behind it, along with when the data was last refreshed.
The live connection capability is what makes this more interesting than early summaries suggested. Using the Power BI MCP server (currently in preview), Claude Dashboards can query a Power BI semantic model directly. This means a Claude Dashboard can pull from the same governed semantic layer that a Power BI report uses; same measures, same dimension tables, same row-level security applied per viewer identity.
That is a meaningful step. For organizations that have already invested in a correctly built Power BI semantic model on any type of data or even Dynamics 365 data, Claude Dashboards becomes a faster front end for ad hoc exploration on top of a governed data foundation, not a replacement for it.
For organizations that have not yet built that semantic model, Claude Dashboards exposes the gap immediately.
The Semantic Model Problem: When Claude Recalculates Instead of Reusing
Here is the governance risk that no summary covers.
When Claude builds a dashboard, it can query a semantic model through the Power BI MCP server but it can also recalculate metrics itself using page-level logic written in d3 and JavaScript. These page-level calculations run entirely outside the semantic model. They are not DAX measures. They are not reviewed or governed. They do not enforce the business logic your team spent weeks defining and validating.
In practice, this means that when Claude is asked to show “gross margin by product category,” it may use the governed DAX measure that correctly applies cost allocation logic or it may calculate what it interprets as gross margin using a different aggregation path that produces a different answer. The dashboard will look identical. The numbers may not be.
For a traditional Power BI report built on a semantic model, this problem does not exist. Every visual in the report uses a predefined DAX measure. Like gross margin is always calculated the same way, under every filter, for every user, on every refresh. The formula has been reviewed and signed off. When the CFO and the controller open the same report on the same morning, they see the same number because the calculation is identical not because Claude interpreted the same prompt the same way twice.
Jet Reports operates on the same principle: financial statements pull directly from Business Central posting tables using predefined report layouts. The period-close income statement, the balance sheet, the budget-versus-actual every figure is the same number the ERP holds, because the extraction logic is fixed.
The Data Residency and Compliance Gap
Let’s take finance teams as example. For finance teams operating under GDPR, UAE PDPL or Saudi PDPA, there is a compliance issue that sits before the governance question.
Query data processed through Claude Dashboards on Consumer and Team plans is handled by Anthropic and processed in the United States. There is no EU data residency and no zero data retention commitment on these plans. For organizations with financial data that must remain within specific jurisdictions, this is not a configuration problem, it is a plan-level limitation.
A Power BI implementation on Dynamics 365 data processes and stores everything within the organization’s own Microsoft tenant, governed by the organisation’s own data residency settings in Microsoft Fabric. For UAE and Saudi-based organisations with data sovereignty requirements, this distinction matters in every procurement decision.
No Source Control. No CI/CD. No Audit Trail for the Report Itself.
Enterprise BI governance is not only about whether the numbers are correct but it is about whether the report itself can be tracked, versioned, reviewed and recovered.
A Power BI report is a code artefact. It lives in a git repository. Changes are version-controlled. A new measure can be peer-reviewed before it goes into production. A deployment pipeline can push a change from development to test to production environments with sign-off at each stage. When an auditor asks what the receivables report looked like on 31 March, the answer is in source control.
A Claude Dashboard has version history but the underlying code cannot be downloaded or inspected. There is no git integration, no CI/CD pipeline, no peer review process for a measure change. The dashboard lives in a Claude account, not in a managed BI workspace. If the person who built it leaves the organisation, the governance question becomes acute.
For finance teams preparing for audit, managing regulatory reporting or running controlled period-close processes, the absence of source control and a deployment pipeline is not a minor inconvenience; it is a fundamental gap in the reporting infrastructure.
Claude Dashboards vs Traditional BI Reporting: 17 Key Comparisons
| Capability | Claude Dashboards | Traditional BI Pipeline |
|---|---|---|
| Setup time | Minutes | Weeks (semantic model, DAX, RLS) |
| Power BI semantic model connection | Yes, via Power BI MCP server (preview) | Native |
| Dynamics 365 BC / F&O direct connection | Not direct, requires warehouse or semantic model | Native via OData or connectors in Power BI |
| Metric calculation | Claude may recalculate outside DAX | Always uses governed DAX or specific formula |
| Calculation consistency | Can vary, d3/JS page logic vs. semantic model | Fixed pipeline, deterministic |
| Data residency (Consumer/Team plans) | US-only, no EU residency | Within your Microsoft tenant |
| Source control | None | Git-integrated, full version history |
| CI/CD deployment pipeline | None | Supported in Fabric deployment pipelines |
| Report code accessible | Not downloadable | Full PBIX + model accessible |
| Multi-entity consolidation | Not available | Standard with correct data model |
| Intercompany eliminations | Not available | Supported in Power BI + F&O pipeline |
| Excel-native financial output | Not available | Jet Reports, native Excel delivery |
| Row-level security | Per-viewer identity (live mode) | Configurable per user and role at model level |
| Month-end close reporting | Not suited | Primary use case |
| Audit trail for report logic | Query shown per number | Full DAX lineage, source control |
| Board-ready custom formatting | Limited (d3 defaults) | Full custom theming |
| Writeback to ERP | Not available | Available via specific connectors |
Where Claude Dashboards Earn Their Place?
The Tabular Editor team, who build tooling for Power BI semantic models, identify three legitimate uses for Claude Dashboards and they are right.
– Exploratory prototyping on governed data.
If your organization has a well-built Power BI semantic model, a Claude Dashboard can run ad hoc questions against it through the Power BI MCP server and produce a visual answer in seconds. The prototype reveals which measures are missing from the model. Those missing measures can then be added to the semantic model properly using Tabular Editor or the Power BI model editor and the formal report is built from them. Claude is the sketch pad. Power BI is the final deliverable.
– Team briefings and visual explainers.
For a quick internal analysis “show me this week’s pipeline by region” that gets shared in a meeting and then archived, a Claude Dashboard is faster than raising a BI development ticket. The key word is archived: these are not production reports.
– Rapid iteration before formal build.
For organisations commissioning a new Power BI dashboard, a Claude Dashboard prototype can align stakeholders on layout and metrics before the formal implementation begins. It reduces rework because the requirements are validated visually before the governed model is built.
For everything else that goes to an auditor, a board, a regulator or a finance director who will stake their name on the figure, the governed BI pipeline is the only correct answer.
Why Enterprise Reporting Still Requires the Governed Pipeline?
The finance teams that get this right in 2026 are not choosing Claude Dashboards over BI tools like Power BI or Jet Reports. They are making a clear distinction between two different categories of work: exploratory analysis and governed production reporting.
The governed production reporting like month-end close, statutory accounts, budget variance, multi-entity P&L, AR ageing for credit committees, requires a pipeline that an organization owns, controls and can audit. The semantic model defines the business logic once. The deployment pipeline controls what goes into production. The source control repository holds the history. Row-level security controls what each user can see at the dataset level. The numbers reconcile to the ERP because the extraction logic is fixed.
Claude Dashboards even with the Power BI MCP server connection cannot provide the source control, the deployment pipeline, the data residency guarantees or the guarantee that every calculation uses the governed measure rather than a page-level recalculation. These are not gaps that will be resolved by a feature update, they are architectural differences between an exploratory tool and a production reporting platform.
For Dynamics 365 Business Central and Dynamics 365 Finance & Operations environments, the implementation work that makes governed reporting possible is a one-time investment: star schema data model, predefined DAX measures, row-level security, multi-entity consolidation logic, Jet Reports layout definitions. Once that infrastructure is in place, it serves the finance team reliably for years and it provides the governed semantic model that Claude Dashboards can query when fast exploratory analysis is needed.
That is the architecture that delivers both: a governed foundation the business can stake its decisions on and a fast front end for the questions that do not need to be production-quality.
The Conclusion
Global Data 365 builds Power BI financial reporting implementations and Jet Reports / Jet Analytics deployments for Dynamics 365 Business Central and Finance & Operations clients across the UAE, Saudi Arabia and the United States. Our implementations deliver the governed semantic model, star schema data architecture, multi-entity consolidation and production reporting layer that enterprise finance teams need including the foundation that makes tools like Claude Dashboards safe to use on top of it.
Request a Power BI dashboard for your Dynamics 365 environment →
Get a Free Demo for your BI Reporting Solution
Search Blog
Related Resources