BI Solutions

power bi vs jet reports

Power BI vs. Jet Reports: 11 Key Differences

Power BI vs. Jet Reports: 11 Key Differences

power bi vs jet reports

Power BI vs. Jet Reports: the ultimate comparison between two powerful tools that cater to different aspects of data analysis and reporting, each with its strengths and unique features. 


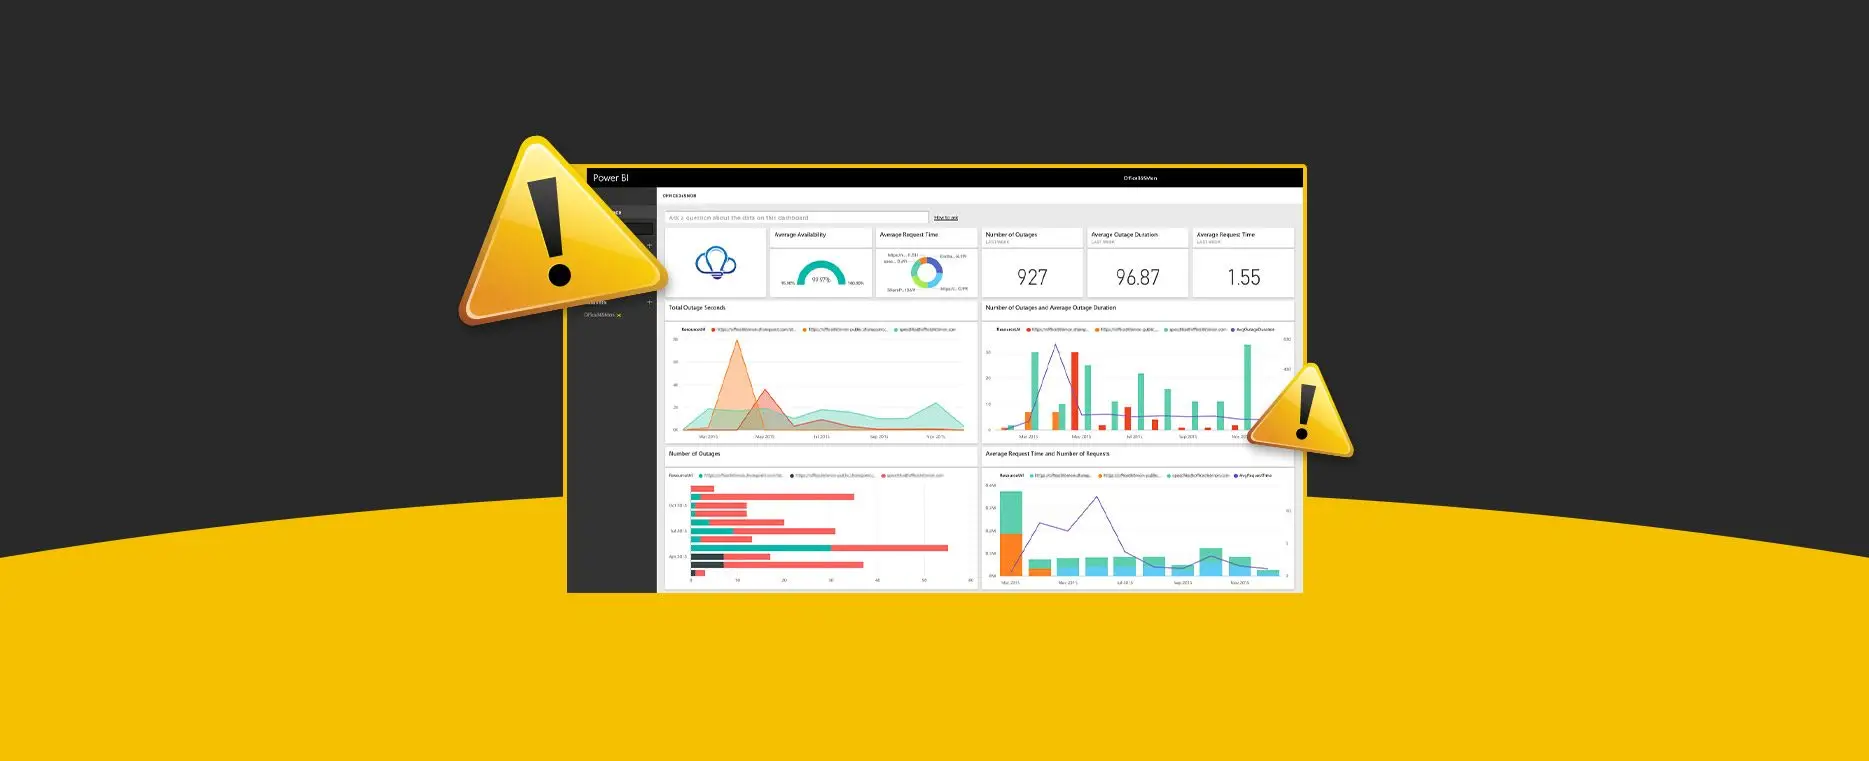
Power BI, developed by Microsoft, is a comprehensive business analytics tool that enables users to visualize and analyze data through interactive reports and dashboards. It excels at creating interactive dashboards and reports for tailored insights. However, Power BI does have some limitations when it comes to financial and operational reporting. Creating reports is complex, requiring DAX scripting and technical knowledge. It lacks drill-down capability to Dynamics NAV/365 Business Central, and needs detailed transactions in the data model. 


While Jet Reports is a business reporting solution designed to work with Microsoft Dynamics ERP systems, such as Dynamics NAV and Dynamics 365 Business Central. It provides fast, flexible financial and business reporting within Excel environment. It simplifies access to information by enabling real-time reporting on Microsoft Dynamics data and allows easy sharing of reports across your organization. 

Power BI and Jet Reports: What's the difference?

Both Power BI and Jet Reports are complementary tools in the realm of data analysis and reporting, but they have core differences in their functionality and focus. 

Aspects 

Power BI 

Jet Reports 

Purpose

Microsoft’s robust analytics, best for data visualization and dashboards with interactive visuals.

Focused on detailed financial and operational reporting from Dynamics ERP.

Interface  

Uses Power BI Desktop, requires learning for new users.

Integrates with Excel, familiar for finance professionals.

Visualization

Offers rich, interactive visuals with numerous chart types.

Basic visualizations, prioritizing details on transactions.


Data Integration  

Connects to various on-premises, cloud, and third-party sources.

Optimized for Microsoft Dynamics ERP data.

Customization

Strong visual customization, limited for detailed formatting.

High flexibility in formatting and layout via Excel.


User Base

Used by executives and analysts for high-level insights.

Preferred by finance teams for detailed reporting.


Security 

Robust security with role-based access and Azure integration. 

Utilizes the NAV-BC security model, eliminating the need to manage a separate security model. 

Real Time Reporting

Supports live data and frequent refreshes.

Real-time data from Dynamics ERP. 

Drill-down Capabilities 

Advanced drill-down on interactive dashboards.

Excel-based drill-down functionality.

Report Scheduling and Distribution 

Automates report sharing via Power BI Service.

Reports scheduled and distributed directly from Excel.

Dimensions 

Supports dimensional analysis for detailed data slicing.

Works seamlessly with Dynamics dimensions.


In Conclusion

In conclusion of Power BI vs. Jet Reports; both offer valuable solutions for data analysis and reporting, each has its own strengths and focus. Power BI is a comprehensive tool suitable for users working with diverse data sources, offering advanced data visualization and analysis capabilities. On the other hand, Jet Reports, is specifically designed for reporting of Microsoft Dynamics ERP systems, providing a more streamlined and tailored reporting solution. 


The core differences between Power BI and Jet Reports lie in their functionality and integration capabilities. Power BI requires manual or scheduled refreshes for its data model and lacks real-time reporting directly from the ERP. In contrast, Jet Reports enables real-time reporting by directly refreshing reports against the live ERP system, providing a more seamless and integrated reporting experience within the Dynamics environment. 


Ultimately, the choice between Power BI and Jet Reports depends on the organization’s specific needs and requirements. Power BI is ideal for users who require extensive data visualization and analysis capabilities, while Jet Reports is more suitable for users within the Dynamics ERP environment who need a specialized reporting solution. Integrating these tools can enhance an organization’s data analysis and reporting capabilities, especially for those leveraging Microsoft Dynamics ERP systems. 


Still exploring which solution is right for you? Our experts are here to help! Contact us today to discuss your unique business needs and find the perfect fit. 


Our team will guide you through the features and benefits of both Power BI and Jet Reports, helping you understand how each solution aligns with your goals. Whether you need advanced data visualization and analysis capabilities or a specialized reporting tool for Microsoft Dynamics ERP systems, we’ll help you make an informed decision. 


Don’t let uncertainty hold you back. Contact us today and discover which tool; Power BI vs. Jet Reports leads you to winning data transformation!

Unlock Powerful Insights: Get Your Free Jet and Power BI Demo!

Share this blog on:

Search Blog

About Us

Global Data 365 is composed of highly skilled professionals who specialize in streamlining the data and automate the reporting process through the utilization of various business intelligence tools.

Follow us on:

Related Resources

Transform Business with BI Tools

Get Free Personalized Consultation Today!

Project Management Dashboard Power BI

Interact Live with Dashboards

Increase efficiency and deliver success now with Microsoft Power BI. Enjoy a 20% discount on all Power BI services.

dashboards

Subscribe to Our Newsletter

Power BI vs. Jet Reports: 11 Key Differences Read More »

Limitations of Power BI

Limitations of Power BI – Are They Risky?

Limitations of Microsoft Power BI

Limitations of Power BI

If your business is considering implementing Microsoft’s Power BI analytics framework, you must understand the level of complexity and limitations of Power BI involved in successful integration. Power BI is a many-month software project based on a complex mix of technological elements, not just a device you install and customize. To get it right, you’ll need a lot of preparation and the highest level of management skills. So, what is Power BI and what are some limitations of Power BI?

Power BI

Microsoft’s Power BI is a cloud-based business intelligence service package. It uses insightful visualizations and tables to transform raw data into usable information. Data can be processed and used to make strategic business decisions in a short amount of time. Power BI is a set of business intelligence and data visualization tools that includes software services, applications, and data connectors. Power BI is a user-friendly tool with versatile drag-and-drop design and self-service capabilities. Power BI can be used on both on-premises and cloud systems.

So, what are the limitations of Power BI that you can avoid?

What is Jet Reports?

Jet Reports, on the other hand, is a dynamic business intelligence tool that goes beyond conventional financial reporting. With its user-friendly interface and Jet Dashboard Designer, organizations can leverage its capabilities for comprehensive financial reporting and analysis. Jet Reports is known for its adaptability and ease of use, making it an asset for businesses aiming to enhance their reporting processes. 

We are going to give you three scenarios where a user should consider switching to Jet Reports or Jet Analytics: 

Complexity Involved with Power BI

Most of us have become used to applications that can be downloaded in minutes or even hours in the case of more advanced systems. That’s a fairly straightforward scenario. At the other side of the curve are items that entail some configuration and are designed and implemented by a team of specialized experts to overcome the limitations of Power BI. A full Power BI implementation must solve a slew of design issues. The answers to those questions will affect efficiency, productivity, and adaptability in the long run. Some of the major differences between a Power BI cloud deployment and an on-premise deployment. For instance:


– What features should you run, where should they run, and how will they all interact?


– What level (or levels) of security do you incorporate?


– Will you be using SQL Server Analysis Services to model your results, or will you use the Power BI desktop tool?


– Should you use Power BI’s Direct Query function or import data?


– Will a gateway component be needed, and if so, where will it be installed?


All these are technical questions, but the solutions have long-term consequences, and it’s always difficult to adjust later. This level of complexity necessitates upkeep, which entails additional costs and disruption.

Power BI: Toolset not a Complete Solution

There are no reports included with Power BI out of the box. In fact, Power BI reporting necessitates a substantial upfront expenditure, not just in terms of constructing the technological infrastructure, but also in terms of deciding how you access the data, how and when data must be converted or pre-processed, where you archive them, and so on. After you have answered those design considerations and limitations of Power BI, you will need to put in a lot of time to set up the data access and data flow.


Data access is becoming more complex in this age of cloud computing. This is particularly true of Microsoft Dynamics 365 products, which no longer require unlimited reporting access. Microsoft has suggested some possible workarounds, but all of them require major compromises. Microsoft has introduced an indirect layer of “data entities” in Microsoft Dynamics 365 Finance & Supply Chain Management (D365 F&SCM), for instance, that developers can use to obtain entry to ERP data. Personalizing Power BI can be very costly. Since every company is different and has its own set of requirements, customization is unavoidable. Recurring costs arise from the ongoing maintenance of such customizations.

Power BI as a Dashboard Visualization Tool

Power BI was developed to be used as a dashboard visualization tool. It does an adequate job of producing conventional tabular reports, lists of individual records with several columns and subtotals, and it does a great job of providing an insightful visual analysis of what is happening in the market. Traditional banking statements are not generated by Power BI because they are somewhat different from other forms of reports. Some more limitations of Power BI such as Filtering, masking, or grouping GL sums by account column, for example, is commonly required when creating a P&L statement. This is often done in different ways for each row in the report.


Columns in the report may be sorted by organizational agency or division, or they can be used to reflect various time spans, budget vs. real, or variance amounts or percentages. Since Limitations of Power BI has a little method of controlling such distinctions, having it generate a comparatively straightforward P&L is a very costly custom programming activity.

Power BI without the Limitations

Global Data 365 offers self-service, user-friendly analytics and reporting tools, as well as collaboration with Power BI and Excel. With the help of Jet Analytics, we hold the guesswork out of Power BI by automating the process of developing a data warehouse with pre-built connectors for over 140 different ERP systems, allowing business leaders and analysts to have the data they demand, when they need it, without any need for specific commands or the complexity and limitations of Power BI stack.


Need to overcome the limitations of Power BI, opt for our Power BI Training program today.

Register Now and Get 25% on Power BI Training!

Share this blog on:

Search Blog

About Us

Global Data 365 is composed of highly skilled professionals who specialize in streamlining the data and automate the reporting process through the utilization of various business intelligence tools.

Follow us on:

Want to try Power BI?

Get a Free Consultation Today!
power bi dashboard

Subscribe to Our Newsletter

Limitations of Power BI – Are They Risky? Read More »

Why-Power-BI-Is-a-Better-Choice-than-Excel-for-Analytics

Why Power BI is a Better Choice than Excel for Analytics

Why Power BI is a Better Choice than Excel for Analytics?

Why-Power-BI-Is-a-Better-Choice-than-Excel-for-Analytics

Modern businesses depend on data, and we’re producing more of it than ever before. However, accumulating vast volumes of digital data is useless unless companies can leverage it effectively. Business intelligence tools, such as Power BI and Excel, can play a crucial role in this process.


Are you planning to introduce a platform to assist you in extracting valuable, actionable insights from your data? You have arrived at the right place. By harnessing the capabilities of Power BI and Excel, you can transform raw data into meaningful visualizations and reports, empowering your organization to make informed decisions based on real-time analytics.


Explore how Power BI and Excel can work together to unlock the full potential of your data, streamline your reporting processes, and enhance your business strategies. Let’s embark on this journey to data-driven success! We will go over the fundamentals of Microsoft’s flagship BI app, Power BI, in this article, like what it can do, what it costs, and what changes it can provide to your company.

Characteristics of Power BI Desktop

– Can link to several different data sources. With the Auto-Refresh option, you can keep this data up to date.

– It aids in the rapid modelling of data.

– Using the drag and drop map, it is possible to generate interactive reports.

Characteristics of Power BI Service

– It is a web portal that allows users to monitor and view reports generated with Power BI Desktop.

– Reduce the amount of time spent moving and sharing information.

– Data can be imported from a variety of on-premise sources (Excel, DB, CSV, etc.) or directly documented from a variety of cloud web services, including Azure, MailChimp, Zendesk, and Salesforce.

Why should you Choose Power BI over Excel?

Power BI has many benefits to offer compared to Excel. Listed below are some of the benefits.

- Convenience and Data Size

Power BI can handle massive amounts of raw data as well as several data tables. The analytical tool is capable of loading and processing large amounts of data into a single PBIX file. Multiple tables can be configured and, if necessary, combined based on common fields. In terms of user interface and ease of use, the Power Query Editor and Data Modeling parts are easier to use.

- Data Connectivity and Auto Refresh

One of the key reasons to use Power BI is that it can link to a broad range of data sources, including databases, online sites like Facebook, and Salesforce reports, among others. When compared to the previous data, the data is automatically inserted into the Power BI Workbook. Excel’s ODBC Driver takes up a lot of time.


Power BI has a great choice for keeping data in alignment with the source called Auto Refresh. To have all the reports updated, Power BI Desktop has a Refresh option, and Power BI Service has a Refresh Now, as well as a Scheduled Refresh option. When you choose Refresh, the data in the file’s model is replaced with the most recent information from the original data source. This form of a refresh, which takes place entirely inside the Power BI Desktop program, varies from Power BI’s Refresh Now and Scheduled Refresh solutions.


Power BI uses the information in the database to link to the data sources identified for it, search for updated data, and then upload the updated data into the dataset when you refresh data in a dataset, whether using Refresh Now or setting up a refresh schedule. In Power BI, unlike Excel, the dashboard can be refreshed.

- Reporting and Cross-Filtering

Power BI reporting is much more advanced and engaging than Excel reports, and a single graph can provide numerous perspectives. In Excel, cross-filtering is not possible, but it is possible in Power BI. This has an impact on how users want the filtering for data with table relationships to move.

- Alerts and Emails

To submit a mail and a reminder in Excel, a user has to use the VBA Editor to generate a macro. In Power BI, creating a warning and sending an email when a condition (such as a threshold value) is met has never been easier. This will keep users updated when on the move, and they will be able to view the report at any time and from any place.


Some other features include:


  • Natural Language Query (NLQ): By asking a common person question in Power BI Service, everyone can get a fast response from the current insights. It’s helpful when someone isn’t familiar with the data model but needs fast answers to questions about the insights. Furthermore, this saves a lot of time.
  • Deeper Insights: The backend program, which is driven by intelligence and algorithms, can generate interactive insights at the touch of a button. It will help you save time and interpret data more quickly.
  • Dashboards and Customized Reports: The reports produced can be modified to achieve the desired outcomes. On the dashboard, the report tiles can be rearranged and relocated as desired.

  • Sharing Reports and Access: The reports and dashboards may be shared with the public or only a small group of associates.
  • Downloading and Exporting Dashboards: The Power BI Service lets you download and transfer dashboards in various formats. The dashboards can be submitted as a .PBIX file or exported as a PowerPoint presentation, PDF, or event print.

In Conclusion

In today’s data-driven environment, a fast and efficient data analytics tool is needed. Power BI makes use of business intelligence to ensure that all reports are produced efficiently and provide a wealth of information. Changes in time and technology necessitate the use of a versatile tool like Power BI, which makes work easier and saves time while delivering the best performance. Get a suitable power bi training for your needs or for more information, contact us today!

Register Now and Get 25% Off on Power BI Training.

Share this blog on:

Search Blog

About Us

Global Data 365 is composed of highly skilled professionals who specialize in streamlining the data and automate the reporting process through the utilization of various business intelligence tools.

Follow us on:

Transform Business with Power BI

Get Free Consultation Today!

power bi inventory dashboard

Subscribe to Our Newsletter

Why Power BI is a Better Choice than Excel for Analytics Read More »

Increase Revenue with Financial Reporting Tools in 2021

Increase your Revenue with Financial Reporting Tools

Increase Revenue with Financial Reporting Tools

Increase Revenue with Financial Reporting Tools in 2021

Profitable companies recognize that technology can be a strong competitive game-changer. Technology is widely thought of as a crucial enabler of performance. It is, but software technology also provides new revenue streams. Financial Reporting tools and technologies are an underrated key to unlocking value as businesses aim to maximize sales, expand their customer base, and retain customer loyalty. 


Listed below are the five main strategies for increasing profit using your ERP system and comprehensive financial reporting tools. 

- Drive Sales Team

There is a gap between different silos within a company in far too many cases. For example, between sales and finance or between sales and supply chain management. When information isn’t passed back and forth effectively, revenue opportunities are often lost. Think about what happens when a user attempts to order an item that is no longer available. Sales should, in principle, have good visibility into planned delivery dates and be able to position orders on an available-to-promise (ATP) level without compromising customer satisfaction. This fits well if the ATP numbers are reliably correct, but if they aren’t, it can lead to missed delivery dates, cancelled orders, and disappointed customers. 


If a business is mindful of the problem, sales can be notified, and consumers can be directed to alternative products. Direct replacement object feature is available in many modern ERP systems. MD365 Finance & Supply Chain Management (Microsoft Dynamics 365 Finance & Supply Chain Management) is a Microsoft Dynamics 365 Finance; it is referred to as an alternate item (F&SCM), but the effect is the same. However, without good insight into ATP accuracy and missed delivery dates, management can be unaware that a problem exists. 


What percentage of delivery dates are missed due to incorrect ATP numbers, and what is the root cause? Off-the-shelf ERP reports are unlikely to provide you with enough detail to determine if this is happening, why it is taking place, and whether it needs to be addressed. Both the sales and finance divisions have good insight into the program’s success by closely tracking it with custom reports. 

- Customer Demands Compliance

Customers usually also create vendor specifications to simplify the management of incoming inventory. Electronic Data Interchange (EDI) is the default for obtaining the sales order and delivering advanced shipping notices (ASNs) to customers used by big-box retailers. Larger consumers also enforce barcoding conditions. Although those are well-known examples, large companies are increasingly requiring suppliers to adhere to other requirements as well. Walmart declared its plan to reduce CO2 emissions in 2017. Project Gigaton, as the program is called, aims to reduce the company’s carbon footprint across the supply chain. In other words, Walmart will demand that its suppliers keep track of the carbon footprint of the goods they sell to the company. 


Only a few ERP vendors have built processes into their software to monitor this type of data. It is starting to happen in the biggest, most costly programs, but for most organisations, the problem can be solved with a blend of custom user-defined fields and versatile financial reporting tools. Whatever potential requirements can entail, reporting tools may help companies remain in compliance. 


Only a few ERP vendors have built processes into their software to monitor this type of data. It is starting to happen in the biggest, most costly programs, but for most organisations, the problem can be solved with a blend of custom user-defined fields and versatile financial reporting tools. Whatever potential requirements can entail, reporting tools may help companies remain in compliance. 

- Understanding Customer Demands

From the day of the outbreak of the COVID-19 pandemic, most firms ramped up their efforts to boost customer loyalty, with a particular emphasis on their biggest and most profitable customers. Smart companies searched for ways to diversify sales and preserve consumer loyalty as a wave of shutdowns and rapid swings in demand swept the economy. Understanding who the most valued clients are is the first step in attending to them. 


Basic ERP reports aren’t designed to include that degree of complexity and depth. The data is available, but it may be distributed around your organization. When many software systems are involved, it’s difficult to get a comprehensive picture of the situation. Nonetheless, having that exposure is important for customer-focused companies. It’s possible thanks to reliable reporting tools. In addition, having easy access to consumer data opens up new possibilities. 


The situation has drastically changed in the global marketplace. Although determining the effectiveness of media ads and direct mail remains difficult, digital marketing has revolutionized the business world with possibilities for targeting customers with highly targeted messages and assessing the effectiveness of such promotions quickly. 


To provide a basis for digital marketing automation, a new generation of CRM software has emerged. Despite this, many businesses also regard ERP and CRM as separate roles. As a response, there are untapped opportunities to recognize buying habits and common desires among subsets of consumers and create revenue-generating marketing strategies to meet their needs. The correct reporting tools can act as a catalyst for data to be aligned through multiple silos within an enterprise. 

- E-commerce Integration

With the arrival of COVID-19, online shopping has exploded. Many forward-thinking businesses were already trying to strengthen their e-Commerce capabilities before the pandemic. The coronavirus, on the other hand, was a call to action for anyone with a small online presence. Many ERP vendors have taken the finest integration approach to e-Commerce, allowing consumers to choose from among a variety of online sale platforms. 


This allows sellers more versatility and, in certain cases, provides new business possibilities (via Amazon or eBay, for example), but that also makes it more difficult to get a clear picture of product revenue across platforms. When businesses use the automated reporting tools offered by each e-commerce platform provider, they get a much-distorted vision of their online business. Business executives will obtain consistent visibility into all their sales operations, through all sales channels, including e-commerce, by putting data together under one platform and then validating it so that it offers an apples-to-apples comparison. 

- Data Visualization

Efficient reporting tools ensure that important performance metrics are accessible across the entire enterprise. It is more important than ever for business leaders to have a real-time understanding of what is going on. Management needs to know whether the supply chain isn’t running smoothly, whether backorders are piling up, or whether consumer quotes aren’t converting into purchase orders. 


Simple ERP and CRM report also provide routine preliminary data, but they fall short when it comes to calculating the distinctive numbers and features that are specific to each sector. The ability to run ad hoc queries, ask questions specific to your company, and receive answers that represent reliable, up-to-date data from your ERP, CRM, and other systems is critical to running a successful business in today’s fast-paced world. 

- Automate Processes

Reporting takes up a lot of time for most organisations because it requires time-consuming manual procedures such as copying and pasting data from exported CSV files or device reports or manually inserting data into Excel spreadsheets. These types of processes often create errors, resulting in a lack of trust in the data being recorded. Business leaders often share dissatisfaction with their software systems’ inability to provide clear information on time. If an organisation has straightforward, reliable, and timely information based on real-time data, everybody in the organization will function on the same collection of facts. As a result, the management team will be able to spend less time discussing numbers and more time-solving issues and improving business outcomes. 

In Conclusion

Global Data 365 connects to over 140 different ERP systems to provide financial reporting tools. For nearly three years, we have been assisting business leaders in obtaining the data they need effectively, reliably, and efficiently to improve financial knowledge and increase sales. Contact us today for a live demo if your company wants to boost sales in the coming year 

Get 30 days free upgrade to Jet Reports.

Share this blog on:

Search Blog

About Us

Global Data 365 is composed of highly skilled professionals who specialize in streamlining the data and automate the reporting process through the utilization of various business intelligence tools.

Follow us on:

Interact Live with Dashboards

Increase efficiency and deliver success now with Microsoft Power BI. Enjoy a 20% discount on all Power BI services.

dashboards

Subscribe to Our Newsletter

Increase Revenue with Financial Reporting Tools Read More »

global-data-365-logo
Talk to Our BI Experts!