power bi

Automate Reporting from Dynamics GP

How To Automate Reporting From Dynamics GP?

How To Automate Reporting From Dynamics GP?

Automate Reporting from Dynamics GP

If you do not fully understand the complex underlying data structure of over 1300+ tables and 22500+ fields, then automate reporting from Dynamics GP can prove to be a problem. Recently, Microsoft Dynamics ERP software has evolved to Dynamics 365 Business Central cloud, and it brings versatility and easy access for small businesses throughout the world. Reporting challenges are bound to arise due to the complex nature of the data structure field. All ERP solutions are made of back-ends that are hard to operate for anyone who is not a specialized expert or administrator.


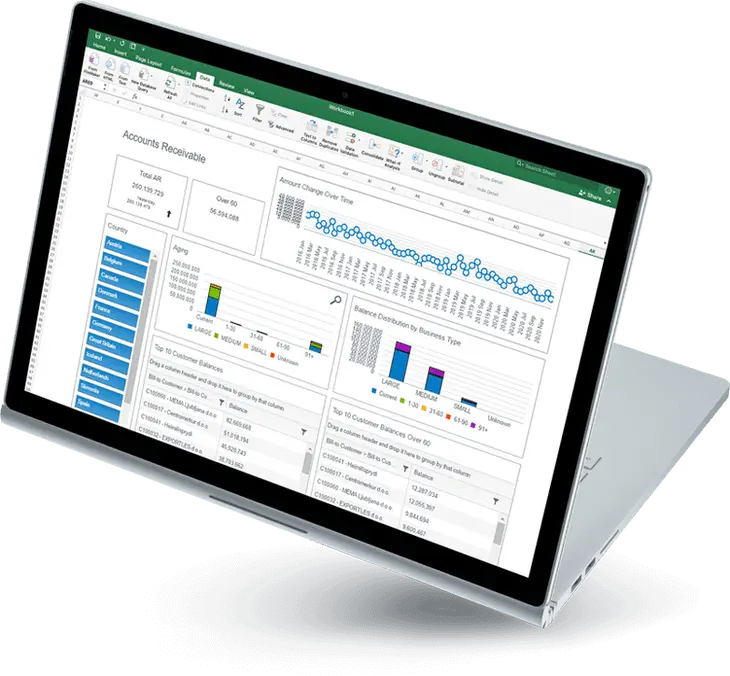
ERP solutions, like Dynamics GP, are designed to optimize business processes and data storage. Its main focus is on storing data, not extracting it. Microsoft Dynamics GP has advanced and evolved in the ways users receive their reports. Management Reporter has advanced to the new setting providing an Excel-integrated tool known as Jet Basics; Smart List has for a long time provided the export-to-spreadsheet option, and Power BI is coming out as a great tool for data visualization. Similar to other Microsoft Dynamics solutions, Dynamics GP is evolving when it comes to providing built-in and extra tools for users to get data visualization.


According to the feedback received from thousands of users from across the globe, users complain about the reporting and analytics in Dynamics GP, as it fails to meet functional reporting requirements outside of financial reporting. The reason behind this could be the complex GP data structure or the unavailability of specialized experts. In any way, depending on these tools is costing users their time and money. Companies are forced to recruit Dynamics GP experts because of the lack of access to one organized, instant visualization of the data.


If you face limitations in your financial systems while regularly using Dynamics GP to optimize processes, then the main challenges that you may be facing in operational reporting are:

Challenges in reporting from Dynamics GP

The four main challenges faced by businesses in reporting from Dynamics GP are:

– SSRS Programming:
Programming in SSRS is costly and slow due to a large amount of data, intricate linking tools, and the programming skill needed to form a report.

– Managing Unorganized Data in Excel:
In a company, every person has their own spreadsheets, which can result in unreliable data and security risks. As every department has different approach in completing its operations.

– Power BI Views:
Power BI can be difficult to navigate for someone who is not a technical expert due to the compilation of data that results in a single view and the rewriting needed to change the views.

– Constructing OLAP Data Cubes:
Constructing OLAP data cubes can be hard and time-consuming as it requires a specialized expert who is familiar with both SSAS data cubes and Dynamics GP.

Keeping these challenges in mind, Global Data 365 has a solution to overcome your Dynamics GP users’ time, money, and effort, all the while creating better reports. It begins with Jet Analytics, the fundamental Dynamics GP data solution.

How Global Data 365 helps with Reporting in Dynamics GP?

Global Data 365 provides better services and implementation to address the obstacles using dynamics that lead your business to success. Without the need for developers and costly experts, Jet Analytics is a complete business intelligence solution designed to obtain quick, customizable reports and dashboards in Excel. And it is possible to do it yourself. Jet Analytics puts all the Dynamics GP data into one and organized it in one location using a pre-built data warehouse, OLAP data cubes, and dashboards to automate reporting in Dynamics GP.

If it is paired with a user-based front-end reporting tool, it makes it possible for users to view, assemble, and prepare the data, so you can benefit from the robust data visualization tools of Power BI and be more effective with operational reporting and analysis. The Jet Data Manager is used as a back-end tool by Jet Analytics to configure turnkey data warehouses and OLAP cubes to assist you monitor and organize your Dynamics GP data.


Jet Analytics provides users to use Excel for all your reporting requirements with one operating location for your reporting, but it offers one source and data management system to handle the delivery, security, business measures, calculations, and run-time of such reports. So, do not let your existing obstacles in operational reporting keep you from receiving immediate insight into your data. Companies can now improve the visibility of real-time data to help automate reporting from Dynamics GP users turn efficient and enjoy Jet Analytics full capabilities.


We, at Global Data 365, offers free one month license of Jet Analytics for you to test it with your Dynamics GP database and see the value it brings into your reporting process. Contact Us to order your trial license now.

Get 30 days free upgrade to Jet Reports.

Share this blog on:

Search Blog

About Us

Global Data 365 is composed of highly skilled professionals who specialize in streamlining the data and automate the reporting process through the utilization of various business intelligence tools.

Follow us on:

Still using Jet Basics?

Get Free Upgrade
to Jet Reports

jet services

Subscribe to Our Newsletter

How To Automate Reporting From Dynamics GP? Read More »

Business Intelligence with Power BI

Business Intelligence with Power BI

Business Intelligence with Power BI: Unlock Data Insights

Business Intelligence with Power BI

Business Intelligence is a crucial aspect for companies to make informed decisions and stay ahead of the competition. Business Intelligence with Power BI offers a simple and fast solution for efficient data visualization, real-time reporting, and predictive analytics, Power BI can turn data into actionable insights.  


The platform is user-friendly interface and ability to integrate with a wide range of data sources make it easy for companies to get started. Adopting Power BI business intelligence can help organizations make data-driven decisions, improve operational efficiency, and drive growth. Start leveraging the power of Business Intelligence with Power BI today. 


Maximize the potential of your data and gain valuable business insights with Power BI services. As a powerful data visualization and reporting tool, Power BI can help you turn raw data into actionable insights, empowering you to make data-driven decisions with confidence. With its interactive dashboards and insightful reports, you can uncover patterns, trends, and opportunities in your data, and transform your business for growth.  

Business Intelligence with Power BI: Key Advantages

There are many options available for organizations for business intelligence then Why Power BIPower BI have edge over other tools when it comes to effective business intelligence. Microsoft Power BI takes lead over other tools because advantages of Power BI are immense that it offers to organizations. Below are the five advantages of Power BI that results in effective business intelligence which will ultimately bring effective results.

- Data Integration with Power BI

Data integration in Power BI is more advanced compared to other tools due to its seamless integration with other Microsoft products and its ability to handle large amounts of data. Power BI allows for easy import of data from various sources such as Excel, SQL Server, and cloud-based platforms.  


Additionally, Power BI’s Direct Query technology allows for real-time data analysis and visualization, providing users with up-to-date insights. Power BI’s powerful data integration capabilities make it an ideal choice for organizations looking to centralize and make sense of their data. 

- Drag and Drop Interface

The drag and drop interface of Power BI allows users to effortlessly manipulate data to create customized visualizations and reports. Unlike other BI tools that require coding or complex data structures, Power BI’s intuitive interface makes it easy for users of all skill levels to explore and analyze data.  


The ability to drag and drop data sources and instantly see visual representations differentiates Power BI from other BI tools, enabling users to quickly gain insights and make data-driven decisions without having to rely on IT support. 

- Power BI Data Modeling

Data Modeling in Power BI allows users to create relationships between different data sets and create a unified view of the data. This helps in easy data analysis and decision making. So, the next time you consider adding a new facility, Power BI will assist you in analyzing the impact it will have on its suppliers. It allows a person to observe the current world while still planning for the future. 


It also integrates with other Microsoft tools, making it a part of a larger data ecosystem, which can be useful for organizations that use multiple Microsoft products. Additionally, Power BI provides a wide range of data visualization options and interactive dashboards, which can help make data insights more accessible to stakeholders. 

- Ease of Use

Power BI is known for its ease of use, as it offers a simple, intuitive interface for data visualization and business intelligence. This makes it accessible to users with a variety of technical backgrounds, allowing them to easily create and share interactive dashboards and reports. 

- Real-Time Collaboration

Power BI offers real-time collaboration features that allow teams to work together and make data-driven decisions in real-time. With Power BI, users can access and share real-time data dashboards, reports, and visualizations from anywhere, on any device. Power BI also provides robust collaboration tools, including comments, annotations, and co-authoring, which enable teams to discuss and make decisions based on the latest data insights.  


Additionally, Power BI’s cloud-based architecture ensures that all team members have access to the most up-to-date data and insights. With its real-time collaboration capabilities, Power BI empowers organizations to make data-driven decisions faster and more effectively. 

- Data Visualization with Power BI

Data Visualization with Power BI allows businesses to turn data into interactive and shareable insights. Power BI stands out from other tools by offering a comprehensive suite of data visualization, reporting, and business intelligence capabilities in one package. With Power BI, users can easily connect to a variety of data sources, perform data transformations, and create interactive dashboards and reports with a simple drag and drop interface. 


The tool also provides collaboration features such as shared dashboards and data stories, enabling teams to work together and make data-driven decisions. Power BI’s advanced data visualization options, such as its 3D map and custom visualizations, set it apart from other data visualization tools, providing a more immersive and engaging way to explore data. 

Learn how to leverage Business Intelligence with Power BI

Global Data 365 is a leading provider of Power BI services for effective business intelligence in the Middle East and Africa. Our team of experts help organizations streamline their data management, gain valuable insights and drive better business decisions. With a focus on delivering customized solutions or required trainings, our services are designed to meet the unique needs of each client and maximize the impact of Power BI on their overall success. 

Schedule a Demo with our Power BI Experts

Share this blog on:

Search Blog

About Us

Global Data 365 is composed of highly skilled professionals who specialize in streamlining the data and automate the reporting process through the utilization of various business intelligence tools.

Follow us on:

Interact Live with Power BI Dashboards

Increase efficiency and deliver success now with Microsoft Power BI. Enjoy a 20% discount on all Power BI services.

dashboards

Subscribe to Our Newsletter

Business Intelligence with Power BI: Unlock Data Insights Read More »