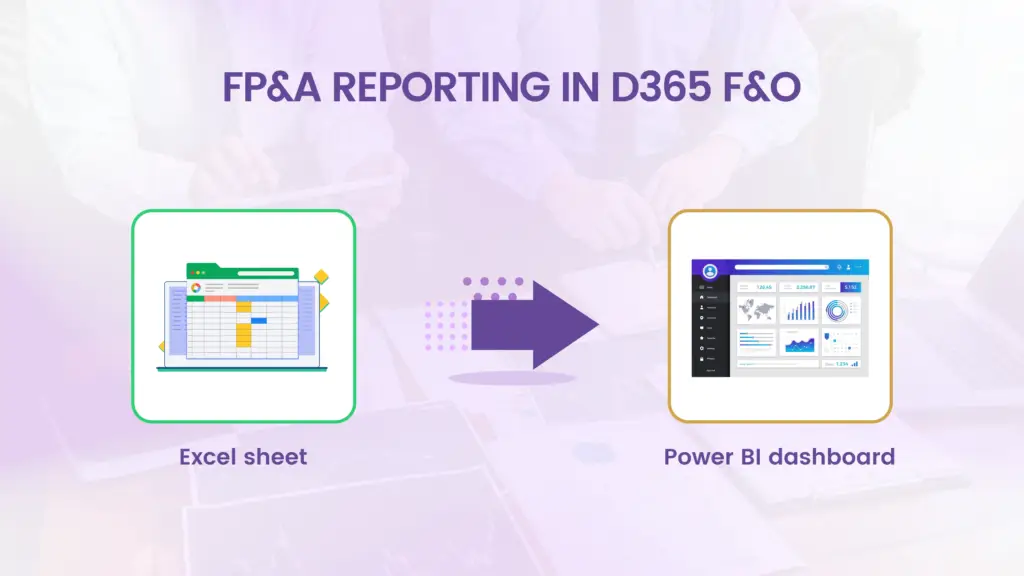
FP&A Reporting in D365 F&O: From Spreadsheets to Live Insights
- Ayesha Binte Habib
If your finance team still starts every month by pulling data out of Dynamics 365 Finance & Operations into Excel, stitching together reports, and chasing department heads for numbers, you’re not alone. And you’re not wrong for doing it that way. That’s just how FP&A has always worked in most organizations. But it doesn’t have to stay that way. Modern FP&A reporting in D365 F&O isn’t about replacing your finance team’s instincts, it’s about giving them live, structured, trustworthy data so they can spend less time building reports and more time analyzing what the numbers actually mean.
This blog breaks down what FP&A reporting really involves inside D365 F&O, why it matters more than ever, what dashboards and KPIs your team should be tracking module by module, and how companies are moving from spreadsheet chaos to real time insight
What Is FP&A Reporting and Why Does It Matter?
Financial Planning & Analysis (FP&A) is the function inside every finance team responsible for budgeting, forecasting, variance analysis, and strategic financial reporting. It answers the questions leadership actually cares about:
- Are we on track to hit our targets this quarter
- Where are we overspending and why?
- What does next year look like if revenue drops 10%?
- Which business unit is dragging down overall profitability?
These are not questions you can answer from a static report that’s already two weeks old. FP&A requires data that is current, connected across departments, and structured in a way that lets finance teams slice it, drill into it, and build scenarios on top of it.
The Problem with Traditional FP&A in D365 F&O
Dynamics 365 Finance & Operations holds an enormous amount of financial and operational data. But most finance teams access it the same way they did a decade ago through exports, manual queries, and spreadsheet models that need to be rebuilt every month.
The result is a reporting cycle that looks something like this:
- Month end close happens
- Someone exports GL, AP, AR, and budget data from F&O
- The data gets cleaned, merged, and formatted in Excel
- Reports get distributed sometimes days after the close
- Leadership makes decisions based on numbers that are already stale
The average finance team spends 60 70% of their time collecting and formatting data. Less than 30% goes to actual analysis. FP&A reporting tools flip that ratio.
Why FP&A Reporting Is Now Business Critical?
In high growth or high complexity organizations, especially those running multi entity or multi-currency operations in D365 F&O slow reporting isn’t just inefficient. It’s a strategic risk.
Budget overruns get caught too late to course correct
Revenue forecasts are based on incomplete pipeline data
Cash flow projections miss payable and receivable timing
Leadership loses confidence in the numbers and in finance
Real time FP&A reporting doesn’t just save time. It changes how finance teams are perceived from report generators to strategic advisors.
FP&A Reporting Across D365 F&O Modules
| Module by Module: FP&A Dashboard Overview | |
|---|---|
📊 Finance Dashboard
| 💰 Sales Dashboard
|
📦 Inventory Dashboard
| 🛒 Procurement Dashboard
|
🏭 Production Dashboard
| 🧾 Accounts Payable Dashboard
|
💳 Accounts Receivable Dashboard
| 🗂 Project Dashboard
|
👥 HR Dashboard
| |
Every one of these dashboards connects back to your D365 F&O data automatically, in real time, without manual exports
The FP&A Reporting Stack: What Tools Work Best with D365 F&O?
There is no single tool that works for every finance team. The right approach depends on your team size, data complexity, and how deep you need to go. Here’s how the three main options compare for FP&A in D365 F&O:
Atlas - Live Excel for FP&A Teams
If your FP&A team lives in Excel building models, running scenarios, doing variance analysis Atlas is built exactly for you. It’s an Excel add in that connects directly to D365 F&O’s data entities, pulling live data into your spreadsheets without any manual export.
- Build live financial statements, P&L, and balance sheets in Excel
- Run budget vs actual analysis with data that updates automaticall
- No copy paste, no stale numbers, no version conflicts
- Respects D365 F&O role based security each user only sees what they should
Atlas is the answer to: ‘Can we keep using Excel but stop wasting time on exports?’ Yes and the data will always be current.
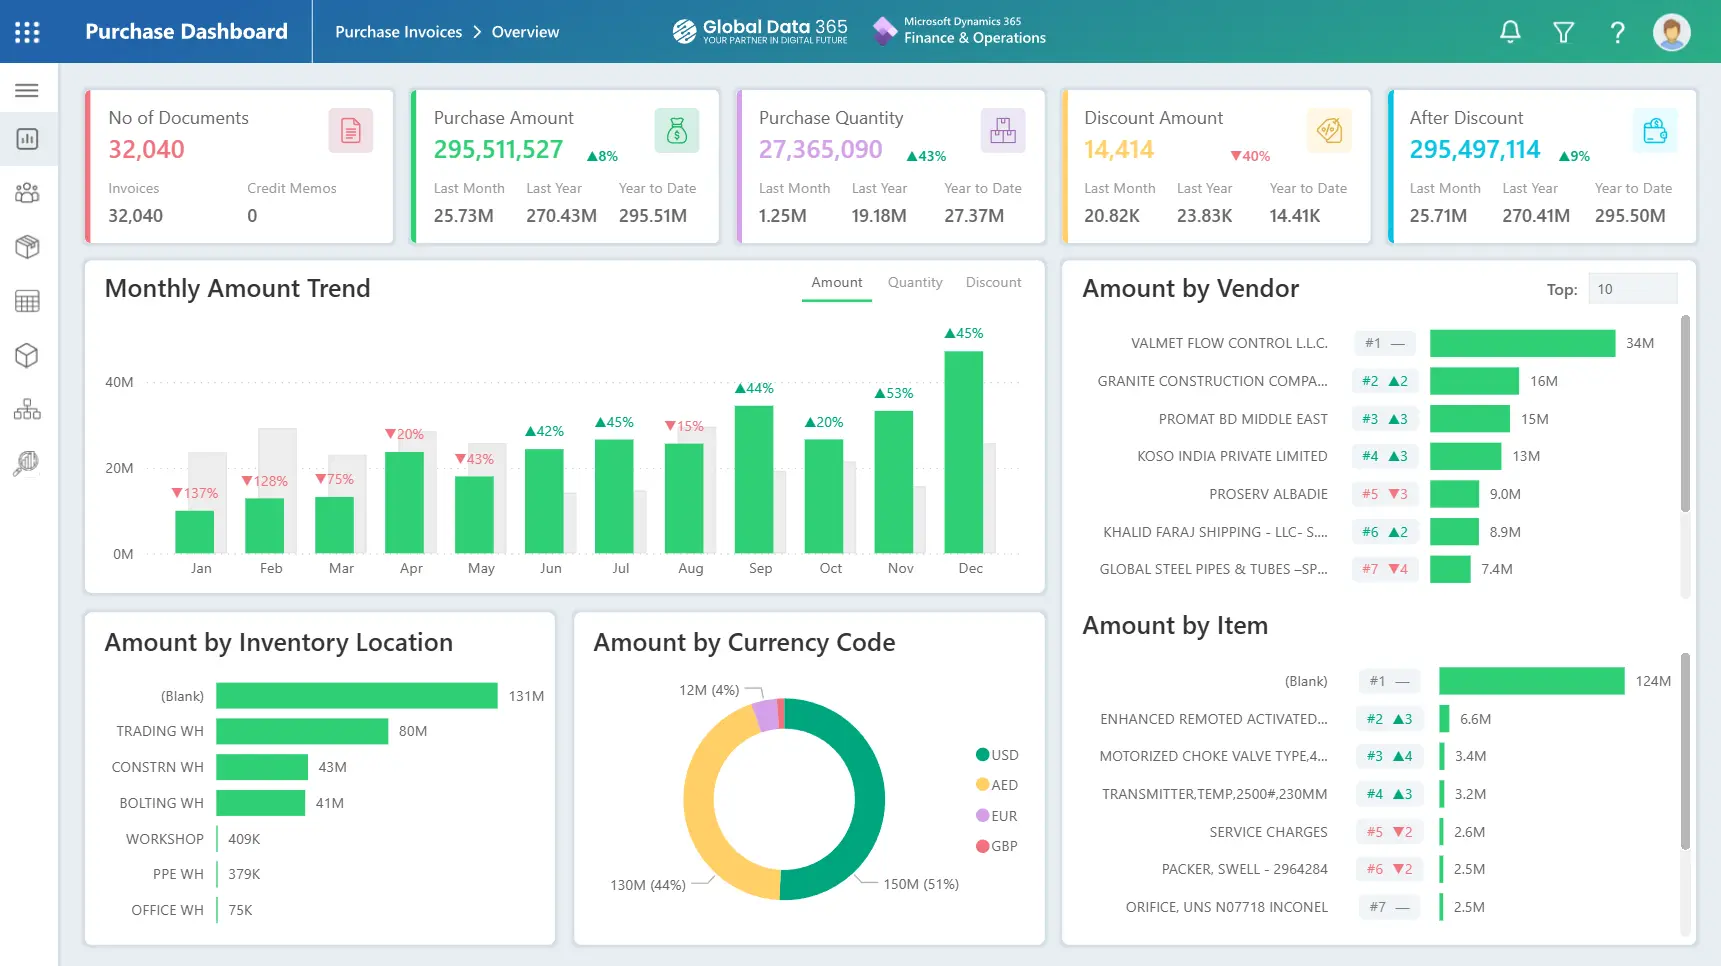
Power BI - Visual Dashboards for Finance & Leadership
When FP&A outputs need to be shared with leadership, department heads, or the board, Power BI turns your F&O data into clean, interactive dashboards that anyone can use.
- Connect D365 F&O via Data Entities or OData feeds
- Build custom P&L, cash flow, and variance dashboards
- Drilldowns from company level → business unit → cost centre → GL account
- Schedule automatic data refresh no manual intervention needed
- Share reports securely with leadership via the Power BI service
Jet Analytics - Enterprise FP&A Data Warehouse
For large organizations, with multi entity structures, multiple ERPs, or high data volumes, Jet Analytics provides the most robust FP&A foundation. Data from D365 F&O flows via Azure Synapse Link into a centralized data warehouse, where it’s structured, cleaned, and optimized for reporting.
- Consolidate financials across multiple entities, currencies, and legal entities
- Integrate budget data, actuals and forecasts in one model
- Power BI and Excel both connect to the same centralized data source
- Historical data preserved for trend analysis and multi year planning
- Enterprise grade governance, trusted data that the whole organization relies on
Jet Analytics is the right choice when you need one version of truth across a complex, multi entity organization not just for FP&A, but for every function that touches financial data.
From Spreadsheets to Live Insights: What the Shift Actually Looks Like
The move from traditional Excel based FP&A to live D365 F&O reporting isn’t just a technology change. It changes how the finance function operates day to day.
Before: The Old Way
- Month end report takes 5 7 days to produce after close
- Finance team spends Monday Wednesday every week updating spreadsheets
- Different departments have different versions of the same numbers
- Budget vs actual analysis is done manually, one entity at a time
- Leadership asks for a number and finance has to ‘go and check’
After: With Live F&O Reporting
- Dashboards update automatically finance reviews insights, not raw data
- Variance reports are available the moment the period closes
- One centralised model no more version conflicts between teams
- CFO can drill into any number in a board deck before the meeting starts
- FP&A team focuses on scenario modelling and strategic input, not report building
The goal isn’t to automate FP&A. It’s to give FP&A teams back the time they need to do what they’re actually good at thinking about the numbers, not moving them around.
Key FP&A KPIs Your D365 F&O Dashboards Should Always Show
Regardless of industry or company size, every FP&A team working on D365 F&O should have visibility into these core metrics at all times:
Financial Performance
Revenue vs Budget – by period, YTD, and full year forecast
Gross Margin % – by product, business unit, and region
EBITDA – actual vs plan with variance explanation
Expense Ratio by Department
Cash & Liquidity
Cash Flow Forecast – 13 week rolling
DSO, DPO, and Cash Conversion Cycle
Working Capital Movement
Budget & Forecast
Budget Consumption Rate- how much of the annual budget has been used
Forecast Accuracy – how close previous forecasts were to actuals
Scenario Comparison – base case vs upside vs downside
Operational Finance
- Cost Centre P&L – profitability by department or function
- Headcount Cost vs Budget
- Capex vs Opex Spend – actual vs approved
The move from traditional Excel based FP&A to live D365 F&O reporting isn’t just a technology change. It changes how the finance function operates day to day.
Ready to Modernize FP&A Reporting in Your D365 F&O Environment?
Search Blog
Related Resources
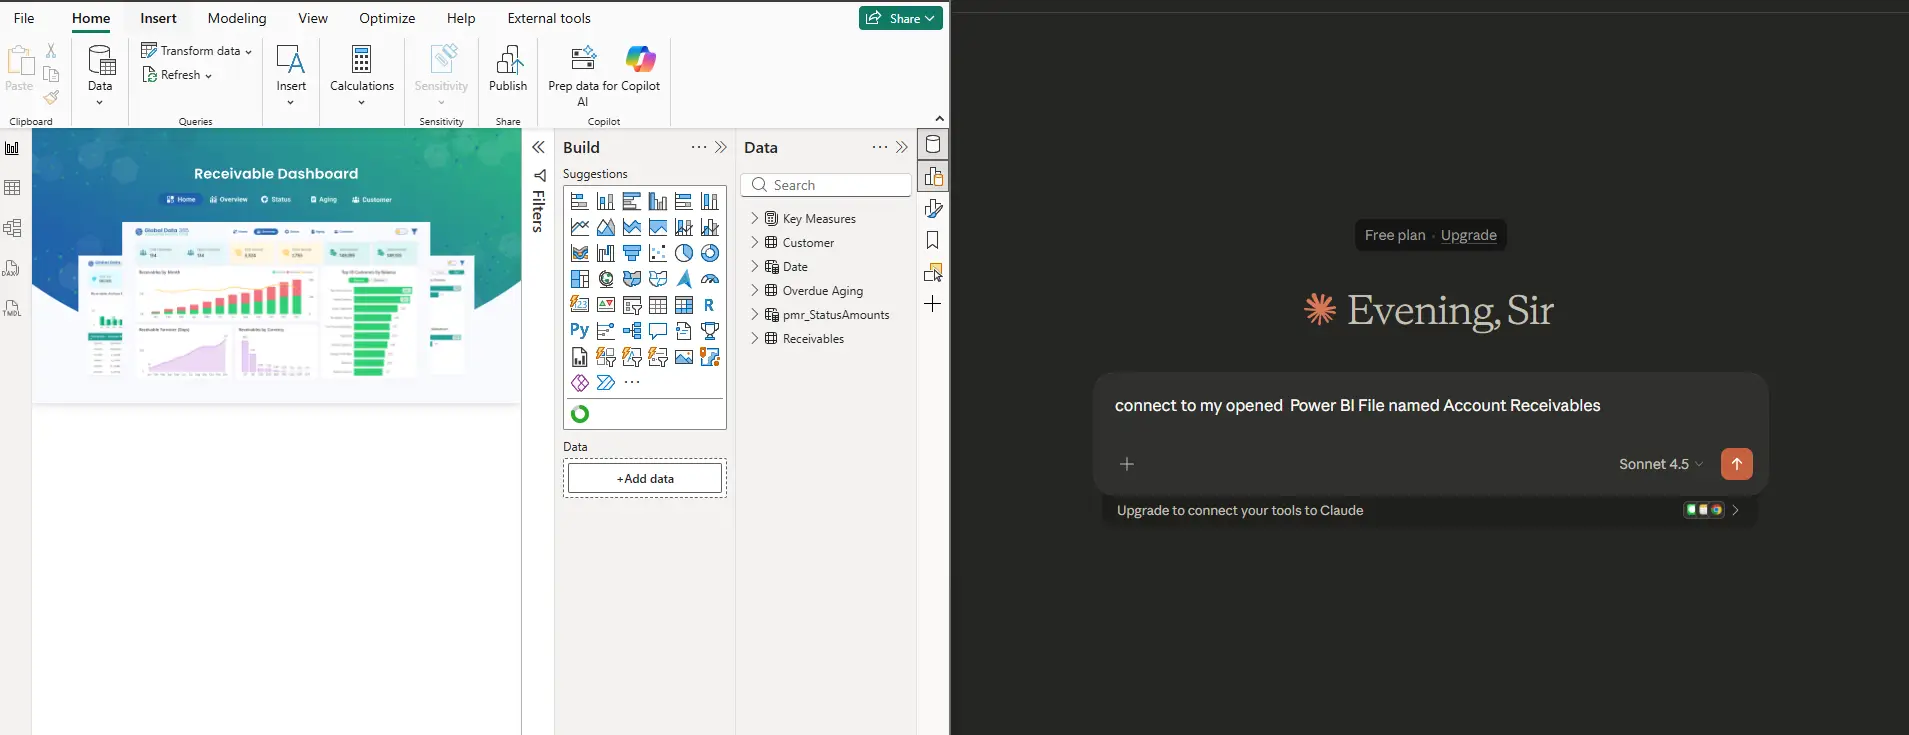
Connect Power BI MCP Server to Claude Desktop