Claude Dashboard vs Power BI: Which Is Right for Your Team?
- Ayesha Binte Habib
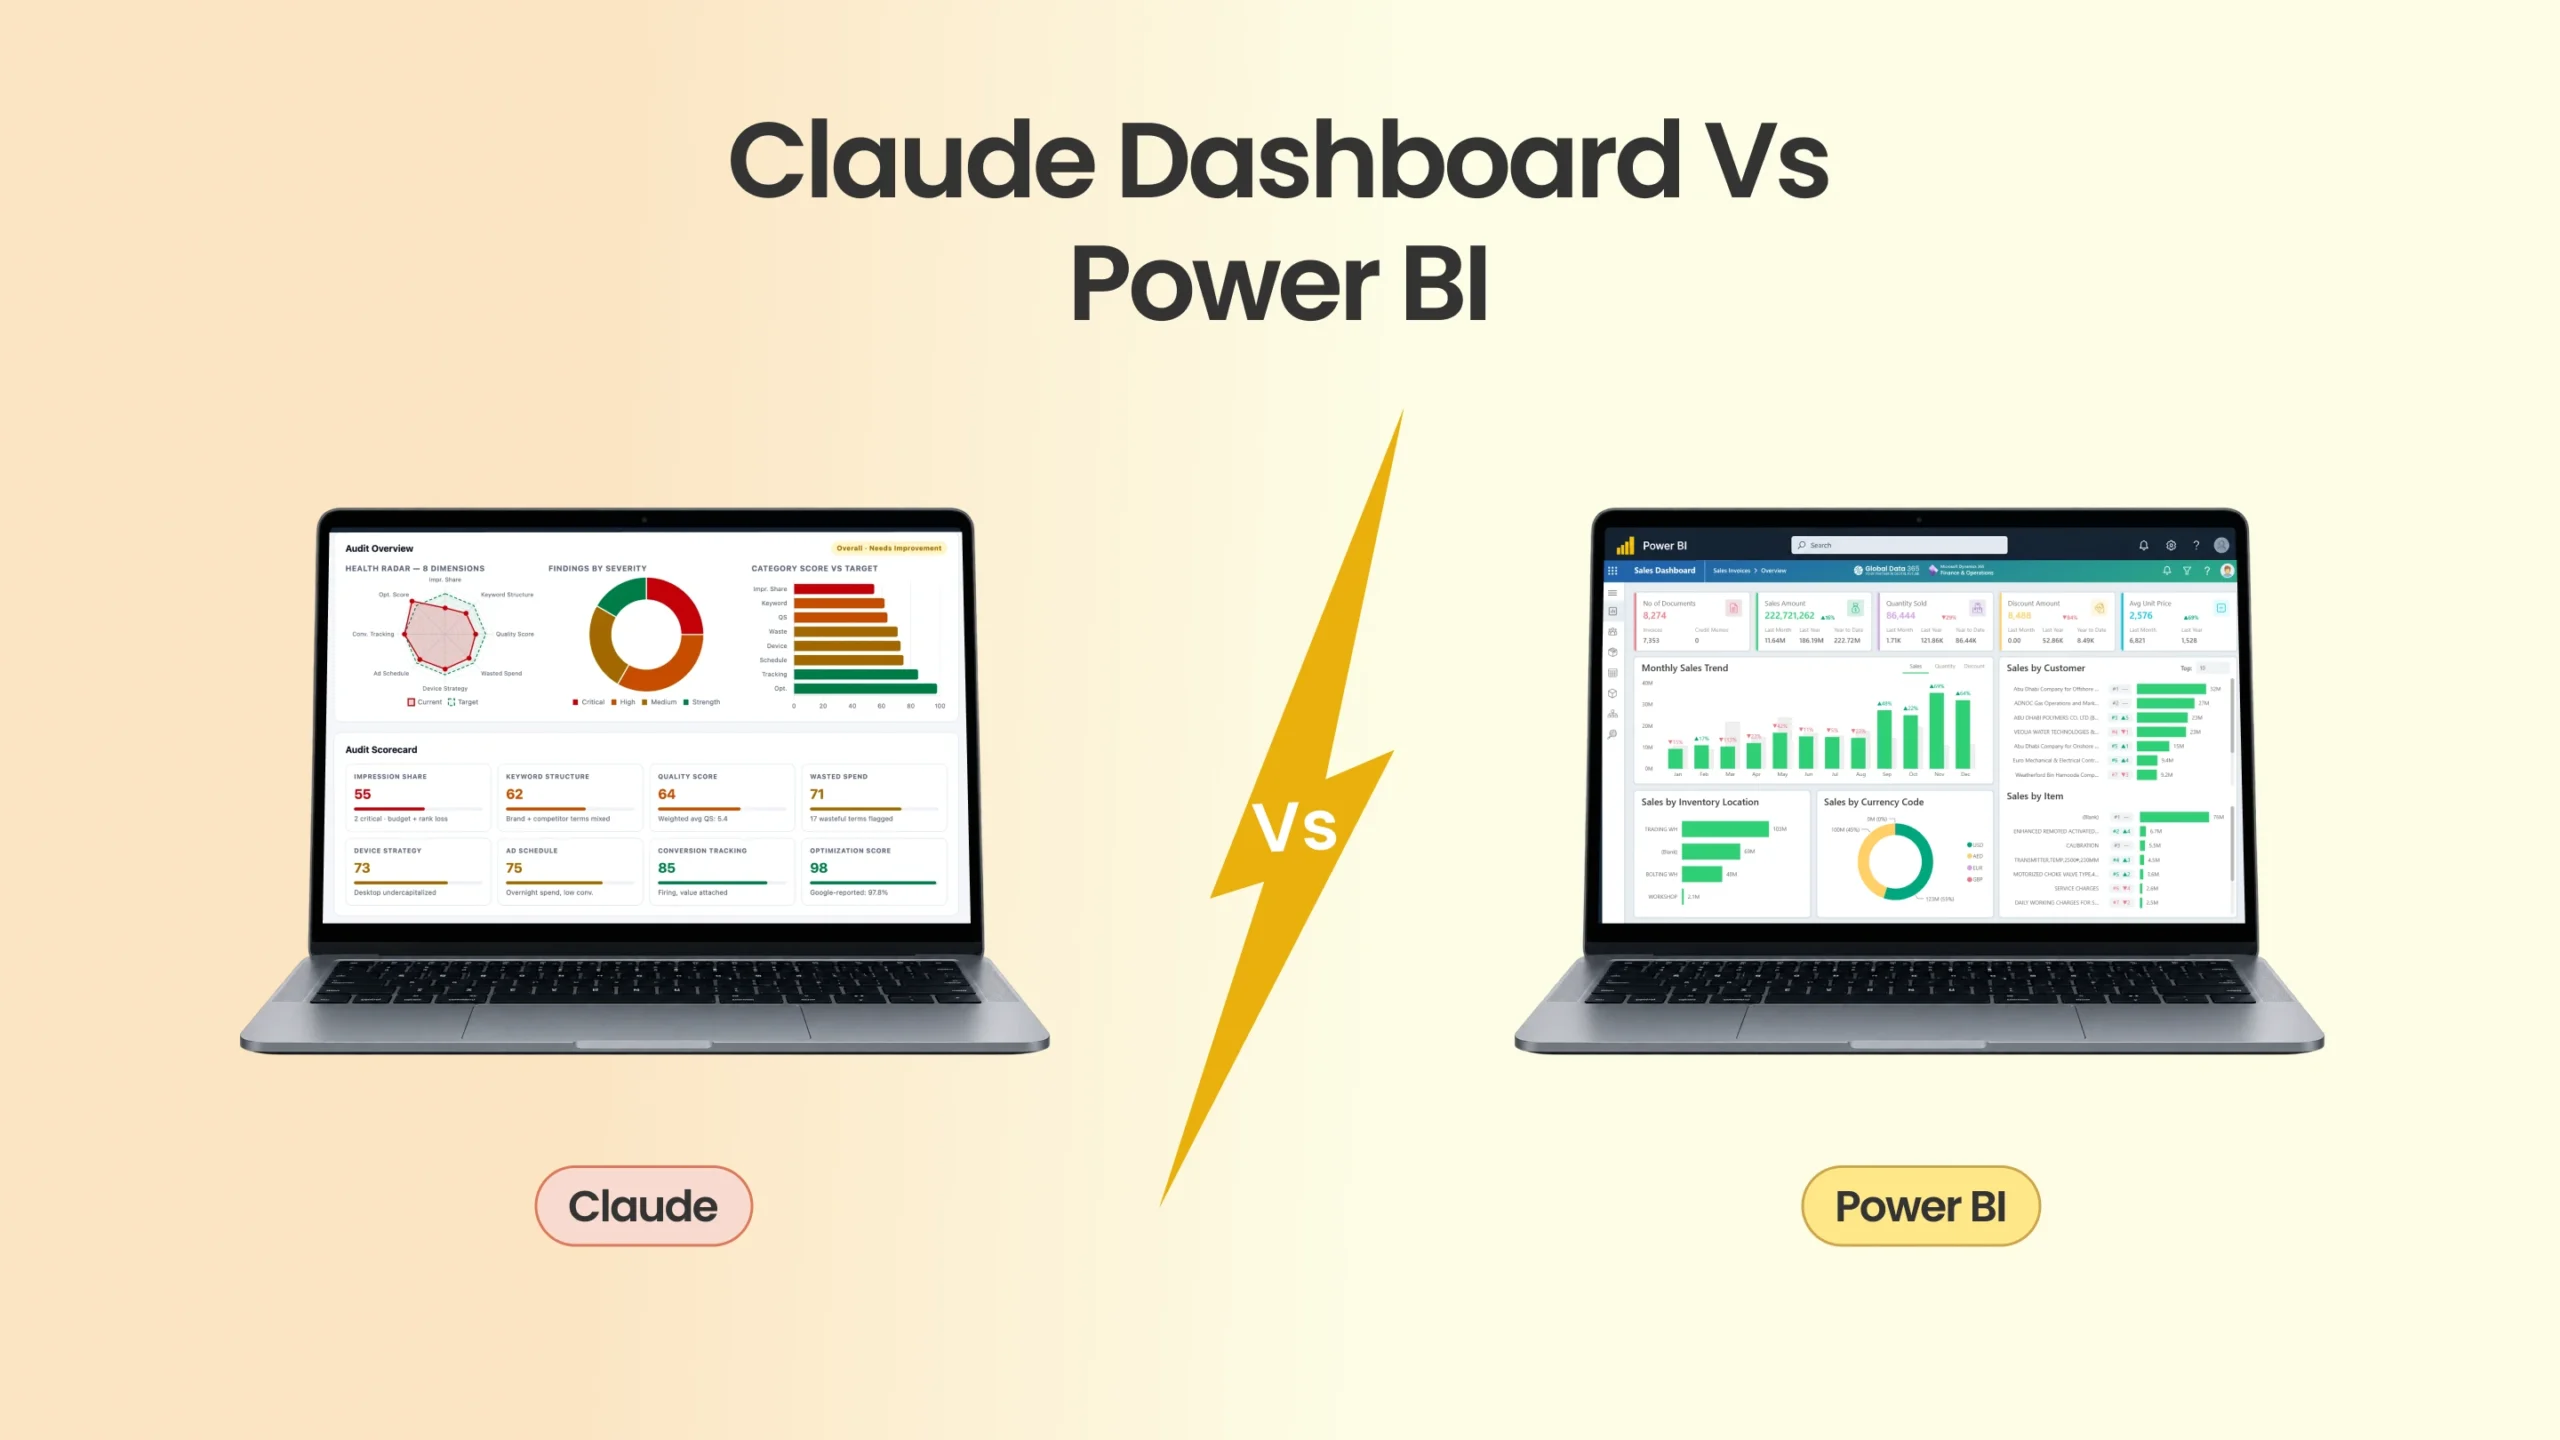
Claude Dashboards and Power BI are being compared by finance teams for the first time in 2026 and the comparison matters less than most people think because they are not built for the same job. Claude Dashboards (currently in beta on paid plans) lets you ask a question in plain language and get a visual answer from your connected data within seconds. Power BI is a purpose-built business intelligence platform that transforms raw ERP data into auditable, governed, production-grade reporting. For finance teams running Dynamics 365 Business Central or Finance & Operations, understanding what each tool actually delivers and where each one fails which determines whether you get reliable month-end reporting or a convincing-looking number that no one can verify.
What Claude Dashboards Actually Does?
Claude Dashboards connects to data warehouses including Amazon Redshift, BigQuery, ClickHouse, Databricks and Snowflake, as well as CRM platforms like Salesforce. You ask a question “compare this week’s signups to last month” and Claude builds a chart, shows the query behind it and displays when the data was last refreshed.
Every number is traceable to its underlying query. You can click any figure and ask Claude to explain how it was calculated. For teams that want to explore data quickly without raising an IT ticket or writing SQL, this is genuinely useful.
Claude also positions Dashboards as a starting point rather than an endpoint. For deeper analysis, it hands off to platforms like Amplitude, Grafana, Hex, Mixpanel and Sigma with Looker and Tableau listed as coming soon. Anthropic is explicit: Claude Dashboard is built for exploratory questions, not production reporting.
What Power BI Actually Does?
Power BI is a full business intelligence platform. Connected to Dynamics 365 Business Central or Finance & Operations data correctly, through a star schema data model rather than raw OData endpoints, it delivers governed, auditable financial reporting with sub-second load times on years of transaction history.
A properly built Power BI implementation on Dynamics data includes fact tables for GL entries, AR, AP, cash and budget; dimension tables for date, legal entity, cost centre, vendor, and customer; predefined DAX measures that produce consistent aggregations under every filter combination and row-level security that restricts what each user can see at the dataset level.
Power BI handles multi-company consolidation for Dynamics 365 Finance & Operations environments running multiple legal entities pulling transaction data from each entity into a unified data model, with currency translation applied at the data layer rather than manually in Excel.
The limitation: Power BI requires architecture decisions upfront. A flat OData connection from Power BI directly to Business Central bypassing the data model produces wrong numbers under complex filter combinations and degrades significantly at high transaction volumes, with load times of 8–15 seconds common in environments running more than a few thousand monthly transactions.
The Trust Problem Nobody Talks About With AI Dashboards
This is where practical experience diverges sharply from the marketing pitch.
Finance teams have one requirement above all others: they need to trust the number on the screen. That means knowing exactly how it was calculated, knowing that the same query run tomorrow will produce the same result, and knowing that no external factor silently changed the output between one refresh and the next.
AI-generated dashboards introduce a reliability problem that traditional BI pipelines do not have.
When you ask an AI tool to produce a revenue figure, it queries from the data source at that moment. Ask it again tomorrow with the same prompt, and it may produce a slightly different number not because the underlying data changed, but because the AI interpreted the query differently, weighted a filter differently, or used a different aggregation path. There is no defined pipeline. There is no formula you can audit. The calculation is re-derived on every request.
In a traditional BI tool like Power BI, the calculation pipeline is fixed. The DAX measure for gross margin is written once, reviewed, and produces the same result every time, under every filter combination. When a finance director asks why the receivables figure changed between Monday and Friday, the answer is in the data not in a re-interpretation of the prompt.
For exploratory questions “roughly how many new accounts came in this week?” the AI approach is fast and useful. For month-end close, board reporting, audit trails and multi-entity consolidation, the pipeline must be deterministic. AI-generated answers are not.
Claude Dashboard vs Power BI: A Direct Comparison
| Capability | Claude Dashboard | Power BI (on Dynamics) |
|---|---|---|
| Setup time | Minutes | Weeks (star schema, DAX, RLS) |
| Data sources | Redshift, BigQuery, Snowflake, Salesforce + | Dynamics 365 BC/F&O, Azure, SQL + |
| Query auditability | Shows query behind each chart | Full DAX measure and data lineage |
| Calculation consistency | Re-derived each query | Fixed pipeline, deterministic |
| Multi-entity consolidation | Not available | Standard with proper data model |
| Row-level security | Admin-controlled sharing | Configurable per user/role |
| Month-end close reporting | Not suited | Primary use case |
| Dynamics 365 native integration | Not direct | Native via OData or Jet Analytics |
When to Use Claude Dashboard?
Claude Dashboards is the right tool when a business owner or operations manager wants a quick answer from a data warehouse without involving BI or IT. It is also a legitimate starting point for organisations that have no dashboard infrastructure at all and need to see what their data contains before commissioning a proper BI build.
For Dynamics 365 users specifically: Claude Dashboards does not connect directly to Business Central or Finance & Operations. It connects to data warehouses. If your Dynamics data lives only in the ERP and has not been extracted to a warehouse, Claude Dashboard cannot read it.
When to Use Power BI on Dynamics 365?
Power BI is the correct platform when finance teams need reporting they can stake their name on figures that reconcile to the ERP, aggregations that are correct under every filter, and a month-end close process that does not require someone to verify whether the AI produced the right number this week.
For Finance & Operations environments running multiple legal entities, Power BI handles multi-entity consolidation, intercompany balance tracking, cost centre drill-through, and period-close status none of which are available through an AI dashboard tool.
The Right Architecture: Both, Not Either/Or
The finance teams getting the most value in 2026 are not choosing between Claude Dashboards and Power BI. They are using Claude Dashboards for fast, ad hoc data exploration against their warehouse sales trends, CRM pipeline, operational signals while running Power BI as the production reporting layer for everything that goes to the board, the auditor or the finance director on a Monday morning.
Claude Dashboard is not a Power BI replacement. It is a faster front door to exploratory questions. Power BI is the governed, auditable, production reporting layer that finance teams building on Dynamics 365 data cannot replace with a prompt.
Request a Power BI dashboard for your Dynamics 365 environment →
Get a Free Demo for Power BI Dashboard in Dynamics 365
Search Blog
Related Resources