Business Strategy

future of AI

The Future of AI in the Business World

future of AI

When it comes to the implementation of Artificial Intelligence (AI) in an enterprise, the world is at a crossroads. Although the technology that allows computers to mimic human thinking has advanced steadily over the last half-century, the Future of AI looks particularly promising. The cost-effectiveness of deployment, convenient access to cloud computing, and realistic business use cases are all positioned to help AI make a major impact in the business world in the coming years.


With the future use cases for AI in the industry on the way, and the capital investments and speed of progress currently powering AI, one thing is for sure: To realize the benefits flowing to the business world, you’ll have to get your framework in place relatively soon. But how are you going to do it? Business intelligence (BI) tools can help with this. Businesses can plan for the future while still taking full advantage of today by laying the groundwork with this readily available, open, and inexpensive software. Businesses are starting to question if it makes sense to move through an expensive deployment that won’t produce meaningful results for two or three years after having unrealistic expectations for AI, which have yet to emerge. Instead, they should concentrate on implementing BI today to get some quick results, then layering AI on top of existing BI data to extract new insights and generate greater value as the technology advances.


So, how can BI apps assist in preparing the company for AI, and what potential use cases can be derived from the combination of AI and BI?

Future of AI and What BI Software Do for You?

Whichever side of the Artificial Intelligence and Business Intelligence discussion you are on, one aspect is certain: you’ll need data to support both. There is no intelligence in AI or BI without data to operate on. There will be nothing to analyse or to which a learning algorithm can be applied. When it comes to intelligence solutions, data is the cornerstone that must be laid.


Data has never been more accessible in today’s business world due to the wider acceptance of cloud computing and the Internet of Things. However, the massive amounts of data produced every day are posing a new challenge for businesses: What knowledge is crucial? What are the best practices for tagging, sorting, grouping, and analysing data? What concerns are answered by disparate data points? How can data collection through various touch points, from retail to supply chain to a factory, be seamlessly implemented?

Data Warehouse

This is where data warehousing comes in. Data warehouses are a way of optimizing data obtained from various touch points, like point-of-sale, CRM, inventory, and warehouse management systems), structuring it to obtain needed insights, and running research. Enterprise companies cannot thrive without efficient data warehousing; data silos consume capital and resources quickly, and any company still attempting to piece together “business intelligence” from numerous reports and fragmented data will quickly fall behind those with centralized data and reporting. The integrated data warehouse, on the other hand, isn’t just a set of relational databases thrown together; it’s based on modern data storage systems like Online Analytical Processing (or OLAP) cubes.


Cubes are multi-dimensional data sets designed for analytical processing applications like AI or BI. Cubes are superior to tables in that they can connect and sort data across several dimensions, enabling non-technical users to access a wider wide range of role-specific and highly contextual data points to discover new insights and make real-time adjustments to strategies and decisions. Most non-technical sales agents and buying associates will struggle to link several tables along with a standard report, but with Business Intelligence cubes, all they must do is drag and drop the metrics and dimensions that apply to their own customized dashboard.


So, how do you get the data? SQL is a language for manipulating and extracting data from cubes. SQL was created as a common language for interacting with databases, irrespective of the type of database being used, and is ultimately the tool for extracting, retrieving, deleting, modifying, and handling data in a table.

Other Methods to Address Data Demands: The Future of AI

Aside from data warehousing and OLAP cubes that provide the technological base, there are a few other components that can assist enterprise businesses in meeting their data needs:

Data Modelling

Data modelling is a technique for sorting out individual data sources within an organization and deciding how they should communicate to obtain the most useful business insights. Data Modelling can be done at the conceptual (high-level, linked to business objectives), logical (mapping to each business function), and physical (how the actual measurements, metrics, and structures are related inside a data cube).

Analytics and Reporting

The ability to capture, structure and store data is essential, but the ability to analyse and report on it is the ultimate objective. End users can find the valuable insights they need with little technological expertise due to business intelligence solutions that provide easy, open analytics and reporting functions. It also facilitates business processes in avoiding unnecessary data bottlenecks by providing them with immediate access to the data they need.

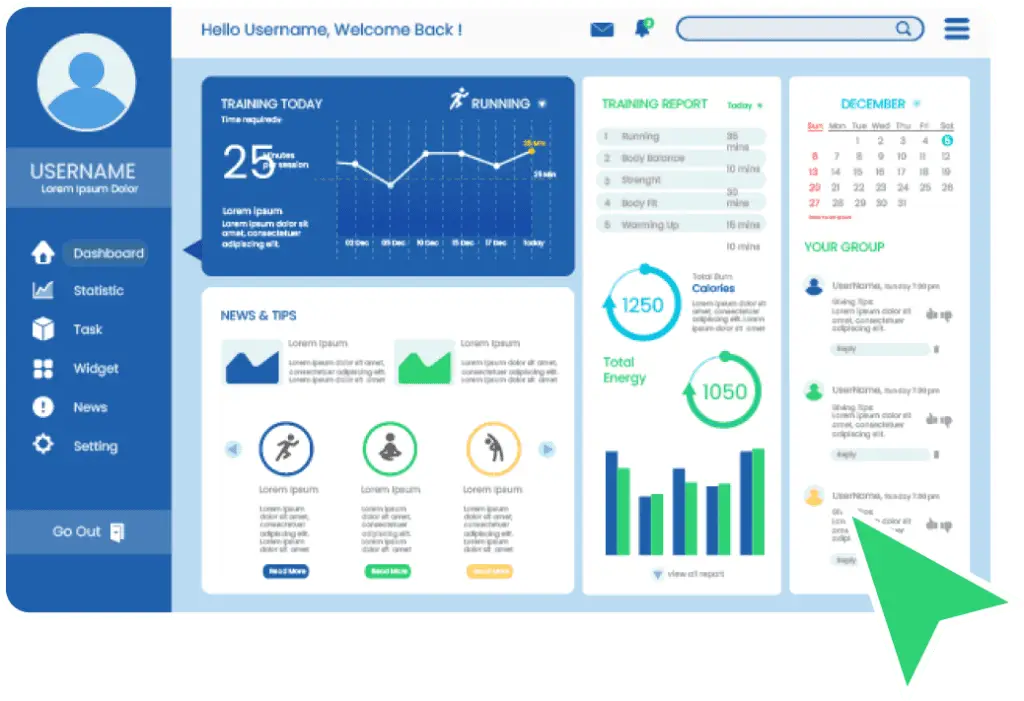
Data Visualization and Dashboards

Business intelligence relies heavily on analytics and reports, but you are not alone if you have ever spent hours sifting through a table of values trying to find out what the data means. Important insights are presented in vivid graphical representations that are much easier for the user to understand using data visualization tools. According to Aberdeen Group research, businesses that use data visualization software are 28% more likely to find accurate information than those that depend entirely on controlled reporting; the same research also found that 48 percent of business intelligence users at companies with visual data exploration will find the information they need without the assistance of IT personnel. Dashboards can quickly compile visualizations and reports into customized displays for each end-user or business activity, by providing individuals with immediate access to KPIs that help drive improved business results from the ground up.


Protection, usability, and efficiency are three major benefits that business intelligence solutions help to drive, as well as three key indicators of enterprise business performance. Protection, usability, and efficiency are three major benefits that business intelligence solutions help to drive, as well as three key indicators of enterprise business success.

The Future of AI

Soon, AI algorithms will be expected to be efficiently implemented in your current data stores, providing you with even more insight. AI applications in line with business should fall into three categories:

Automated Processes

The most common use of AI in business right now is to automate systems and business processes. Although previous iterations of automation focused on sharing data between systems, AI can take this skill to the next level by interacting with data as if it were a person, either inputting or consuming as required. AI robots are now capable of analyzing legal contracts and extracting specific clauses, updating customer records through several networks, and automating customer outreach in response to changing

circumstances. Businesses will be able to automate even more processes as these algorithms become smarter.

Meaningful Insight

Cognitive insight is the ability to derive meaning and distinguish patterns from large amounts of data using AI algorithms. Although BI software and data stores will certainly include the “diet” for cognitive insight algorithms, as they learn, they will be ready to access those learnings to larger data sets, respond to new data in real-time, and recognize possible data matches across multiple platforms.

circumstances. Businesses will be able to automate even more processes as these algorithms become smarter.

Cognitive Engagement

The human-interfacing aspect of AI is referred to as cognitive interaction. Consider chat-bots, knowledge bases, and product recommendation engines, among other things. Externally (for customers) or internally (for employees), cognitive engagement technologies can be used to simplify the connection between users and systems. Since companies are still wary of the relatively new technologies, most existing applications concentrate mainly on internal engagement. However, as AI growth and implementations progress, objections are likely to fade away as companies discover new ways to use existing data to drive practical automated interactions with humans all over the world.

circumstances. Businesses will be able to automate even more processes as these algorithms become smarter.

Takeaway

The future of AI will eventually start to live up to its potential. We have been reading a lot about the excitement in the business world. Computers can assist in ushering in a new age. For cutting-edge businesses, a new age of growth and profitability awaits, but only if you have already laid the groundwork, which begins with business intelligence.


At Global Data 365, we understand that business intelligence and data management are essential components of every enterprise artificial intelligence strategy. To get the most out of artificial intelligence, you need to start with good reporting and analytics. So make sure you are laying the groundwork for your company’s future success today!

Get 30 days free license for Jet Reports

Share this blog on:

Search Blog

About Us

Global Data 365 is composed of highly skilled professionals who specialize in streamlining the data and automate the reporting process through the utilization of various business intelligence tools.

Follow us on:

Interact Live with Dashboards

Increase efficiency and deliver success now with Microsoft Power BI. Enjoy a 20% discount on all Power BI services.

dashboards

Subscribe to Our Newsletter

The Future of AI in the Business World Read More »

How Does Business Intelligence Help in Demand Forecasting

Business Intelligence Help in Demand Forecasting

How Does Business Intelligence Help in Demand Forecasting

Businesses are investing significantly in advanced analytics to maintain a competitive advantage and improve their result due to big developments in artificial intelligence and machine learning. Business Intelligence in Demand Forecasting is one of these fields where businesses extract information from existing data to assess purchasing patterns and predict future trends through predictive analytics.


Predictive analytics makes use of a combination of data, statistical algorithms, and machine learning approaches to predict the likelihood of future outcomes based on the past. Every sector, from banking to retail, uses this technology to assess consumer responses or orders, forecast inventory, manage capital, and even detect fraud. Predictive analytics is becoming more popular, even though it has been around for decades, thanks to increasing quantities of data and readily available tools ready for a transformation. 


Below we will look at how market intelligence can help with demand forecasting, a type of predictive analytics that focuses on consumer demand. We’ll go into what demand forecasting is, how it operates, and how to get started with it using business intelligence tools. 

What is Demand Forecasting?

Demand forecasting is a type of predictive analytics that focuses on predicting customer demand for products and services. It estimates potential demand based on historical data and current market conditions and sets the level of supply-side preparedness needed to match demand. 


Demand forecasting is important in production planning and supply chain management, even if it isn’t an acquired skill. Demand forecasting impacts everything from budgeting and financial planning to capacity planning, sales and marketing planning, and capital investment. 

Why Should You Use Demand Forecasting?

Manufacturers, distributors, and retailers use demand forecasting as an important part of supply chain planning to gain insight into their activities and make educated, efficient decisions about pricing, inventory stock, resource optimization, and more. 

Listed below are some major reasons why demand forecasting is so important in today’s supply chain: 


  • Increased customer loyalty (providing customers with the items they want, whenever they want it). 
  • Inventory management to minimize stock-outs and overstocking. 
  • Effective raw material and labor scheduling. 
  • Improved capacity planning and resource allocation. 
  • Better distribution planning and logistics. 
  • Affordable pricing and promotion. 

Use of Business Intelligence in Demand Forecasting

Data is used in demand forecasting. If the data you use is incorrect, the math and how you apply it will result in under or overestimated demand, leaving you with a slew of disgruntled customers or an overabundance of goods. Most businesses use a business intelligence solution to help with data planning, data co-ordination, and forecasting to better understand demand and supply. 


Business intelligence software is designed to capture, unify, sort, tag, analyze, and report on large volumes of data. Here are four main areas where market intelligence can help you get started with reliable demand forecasting: 

Data Preparation

Most businesses fail to cleanse, verify, and audit their data regularly. As a result, 40% of company data is either incorrect, incomplete, or inaccessible (Gartner). BI software allows you to organize and monitor your data in one place, ensuring that your analytics are based on reliable data. 

Data Collection

A data warehouse can assist you in gathering business data from a variety of sources and using it for accurate reporting and analytics. Data warehouse-powered BI will help correlate data from different systems to provide further visibility into the supply chain, revenues, and financials, among other items. 

Data Analysis

BI software is built for processing and measuring large quantities of data. Maintaining a system of records, which includes historical records and various data sources, ensures that all findings are based on the same version of the facts. 

Reporting and Analytics

With pre-built dashboards, BI software will give you a single view of results and reports for the rapid dissemination and exchange of real-time information on demand. This encourages better preparation and coordination between the teams. 


Improve your data quality and plan your data for reliable demand forecasting by learning more about what you need to do. At Global Data 365, we will analyze your current systems and show you how business intelligence will help you build the technology base for your company. 


Contact our team for more information! 

Talk to our BI Experts

Share this blog on:

Search Blog

About Us

Global Data 365 is composed of highly skilled professionals who specialize in streamlining the data and automate the reporting process through the utilization of various business intelligence tools.

Follow us on:

Interact Live with Dashboards

Increase efficiency and deliver success now with Microsoft Power BI. Enjoy a 20% discount on all Power BI services.

dashboards

Subscribe to Our Newsletter

Business Intelligence Help in Demand Forecasting Read More »

Budgeting Problems That Companies Face in Fiscal Planning

Budgeting Problems That Companies Face in Fiscal Planning

Budgeting Problems That Companies Face in Fiscal Planning

Organizations all over the world are putting in more effort than ever before to achieve long-term, successful growth. Fiscal planning, which includes compiling, tracking, and reviewing a company’s income, expenditures, debt, and capital estimates for implementation in the annual budget, is a result of that growth strategy. It’s a big organizational challenge that happens once a year but typically lasts longer than expected. 


If you ask every big company’s CFO, they will tell you that during this time of organizing staff, aligning numbers, and handling approvals, they’ve probably missed a few nights (or weeks) of sleep. They are the ones that are largely responsible for determining priorities, benchmarking business results, making changes, and implementing the budget company-wide, even though there are several different participants in the budgeting process leading to budgeting problems. It goes without saying that without the correct structures and processes in place, this can be a challenging time. 

Budgeting and Fiscal Planning

Budgeting is necessary to direct daily revenue and expenditure decisions and assign resources. Long-term fiscal planning needs resources and support for financial targets. Although budgeting is intended to keep the business on track and find areas for change, the fact is that it is not a simple job. Rather than focusing on profitability and competitiveness, the budgeting process is often time-consuming and labor-intensive, with little return on investment. Tackling down the root issues, we conducted research and listed the top eight budgeting issues that most businesses face while preparing their fiscal year. 

Time

Coordinating, editing, and consolidating various budget contributors’ versions of the same static spreadsheet takes a long time. Many CFOs have reported spending upwards of 250 hours on the budgeting process itself, from time spent reinforcing numbers to missed hours spent tracking down individual budget participants. 

Communication

Before, during, and after the budgeting phase, there seem to be a lot of moving parts in a business. Budget developers, contributors, and approvers must all provide feedback at each point, but many businesses lack a tool to facilitate collaboration. They end up budgeting in silos, with no collaboration with other departments or a clear end goal in sight. 

Complexity

Trying to deal with deadlines and unanticipated adjustments is another issue that many budget owners face throughout the multi-layered budgeting process. Any change or alteration to a budget result in a complex back and forth hassle of redoing numbers, responding to questions, and re-sending spreadsheets, which should be an easy fix. 

Flexibility

When developing a budgeting document for all managers in an organization, it’s crucial that the form or spreadsheet they must fill out be structured and simple to comprehend. The problem is that unregulated spreadsheets lack the structure and marking needed for all budget participants. As a result, many people become engrossed in the information and find it difficult to provide correct answers. 

Accuracy

Most businesses end up depending on manual data entry and procedures to put together 30 to 100 Excel files (each with different versions). Manual processes are notorious for causing human error, inconsistencies, and a lack of control since there is no easy way to filter down the numbers. 

Optimization

Monitoring and changing the budget during the year is an effective business practice that contributes to increased profits and productivity. But, due to technical limitations and the manual labor needed to combine actuals and budgets, many businesses do not use it. 

Cost

The cumulative cost of several annual budgeting projects will stack up once all the time and money that the six budgeting issues above consume are added together. Aside from the labour costs associated with inefficient procedures, many businesses are unaware of the value that good budgeting and fiscal planning can bring to the table. 

Value

Perceived importance is one of the most critical factors in the budgeting process. Is the money you spend on planning and budgeting worth it? Operating managers should be able to make informed choices that are in line with the company’s overall financial priorities thanks to fiscal planning. 

Key Takeaways for Fiscal Planning

At Global Data 365, we have learned these budgeting problems from our monitoring and analytics customers time and time again. As a result, with our new budgeting tools, we want to improve the way you budget. Our budgeting system is a simple, adaptable, and simple-to-use fiscal planning solution that manages and streamlines the budgeting process in Excel and on the web from more than 140 ERPs. Users can use their existing Excel skills to transform the budgeting process into an easily controlled, systematic process that can be completed in half the time with traditional Excel integration and an interactive web portal. 


Here’s how we can help you gain more control over your processes and make your next budgeting period easier: 


– By eliminating manual processes and disparate structures, you can save time and money on financial planning. 


– Easily create, compile, and report on the budgets on a single forum for budget owners and contributors. 


– With planned, automated workflows, you can cut the budget timeline in half. 


– For simplified budget and actual reporting, import data directly from over 140 ERPs. 


– Improve financial efficiency across departments by increasing productivity with fast, reliable budget numbers. 


Budgeting tool that is both affordable and versatile, and that works the way people want a financial planning tool to work. Businesses can reduce the budgeting process, produce more reliable numbers, increase financial results and efficiency, and make better decisions in half the time. 


If you’d like to gain control over your budgeting problems, schedule a demo with us today! 

Get 30 days free license for Jet Reports

Share this blog on:

Search Blog

About Us

Global Data 365 is composed of highly skilled professionals who specialize in streamlining the data and automate the reporting process through the utilization of various business intelligence tools.

Follow us on:

Still using Jet Basics?

Get Free Upgrade to Jet Reports
jet services

Subscribe to Our Newsletter

Budgeting Problems That Companies Face in Fiscal Planning Read More »

Risks to Your BI Implementation

Why BI Implementation Can Be Risky?

Risks to Your BI Implementation

Gartner recently published a study on all the stuff that can go wrong with your BI implementation. We have classified them into 8 different risks to your BI implementation based on our team’s insights here at Global Data 365. These risks can easily be overcome, but they are very likely to infiltrate your business plans. 


An analyst in Gartner’s report takes great pains to stress that there is far more risk associated with non-technology problems than there is with implementing infrastructure, resources, and applications. Listed below are the 8 different risks of BI Implementation; so you can recognize them and avoid potential problems in the future. 

-Building a Project with BI Implementation

Starting a business intelligence project with this mentality means that the program is funded by IT and is usually led from a technological or data-centric viewpoint. The issue is that BI Implementation is being driven by IT rather than the company. Unless IT has a strategic plan or a consumer case of their own to include here, they aren’t interested in the final consumption of the BI deliverable and can only play a minor part in the development. 


The solution is to ensure that the project team includes a marking scheme from the business side of the house from the start of the planning phase through infrastructure upgrades. 

- Excel Culture

The second potential risks can be Excel. With Excel, you collect data from an internal structure, load it into Excel, and manipulate the figures. Every single person who participates in this would have a different point of view for the BI Implementation. Different methods of converting numbers into metrics will be used. They may also have opposing goals. You’ll get different results from each, and your data will be totally inaccurate. To us, that just means one thing: risk. The company is at risk. It’s the danger that comes with making costly decisions based on inaccurate knowledge. 


The solution is to build a data warehouse. This will be the location where everyone has settled on the data that will be used to handle the company, as well as how that data will be combined with the methods that will be used to measure items like total revenue and net income. 

- Issues in Data Quality

Everyone deals with issues in data quality. The problems that trigger it are various, and their effect on business intelligence is important. This is because people would not use BI software based on data that is meaningless, incomplete, or suspicious. 


Establishing a process or collection of automated controls to detect bad data and prevent it from entering the data warehouse or BI environment is the solution. Surprisingly, a BI implementation can solve this problem all by itself. It’s because having data quality problems in a dashboard will draw attention to them. That should give you a good idea of how to track them down. Learn how to plan your data for business intelligence.

- Diverse Options

You’ll be confused if you search “BI solutions”, attend a related tradeshow, or read quite a lot of BI reports. There are several options available. But how do you know which approach to business intelligence or that the BI implementation is right for you? 


The solution is to avoid putting the cart before the horse. First, assess the requirements. Evaluate them from a market and a technological standpoint, and then use the results of that exercise to guide the quest for approaches and solution providers. 

- Using Existing IT Provider

BI is unlike any other project. Since you’re working with human beings and their methods, as well as the changing conditions of the business world, there’s a little luck involved. We are convinced that a business that specializes in BI projects will not be able to help you succeed. Seeking a business that specializes in BI environments is the safest approach. For this, you’ll need a professional. 


If you’ve decided that they have the technological experience and track record to make you happy, if you want to be good, don’t be afraid to evaluate them on fit, desire, and dedication. Those are the things that are more difficult to determine, but BI implementations usually last a long time, so it won’t cause you any problem.  

- Time in BI Implementation

The other threat is about the time it takes in your BI implementation. A BI project can be placed into a low-cost maintenance state, but your company will never stop evolving, and because BI is built to model your business, it must also change. 


Having demands is one way to avoid this from being a concern. You should anticipate that the BI success would be a moving target over time. Let everyone know how things will pan out. Prepare for it by scheduling deliverables and budgeting for it. 

- Insufficient Training

Many companies spend all their BI budgets on software applications and a few weeks of user training. Today’s BI systems, on the other hand, are dynamic constructs that need much more training for users to derive true value from them. Besides, continuous training is needed to ensure that users are familiar with and comfortable with the system. 


Furthermore, companies should ensure that the software they install contains online training videos that help users become more comfortable with the current BI framework or the companies should opt for online training of the BI Software they use. 

- Data Collection from BI software

Some businesses gather useful data from their business intelligence tools but don’t distribute, evaluate, or act on it. When deciding what to do with BI implementation, it’s important to think outside the box. Companies may avoid risk and make educated decisions to move their industry forward by using the knowledge collected and adapting it to their own business models. 

Companies can use BI software on different data points, analyze risks, and predict trends. To improve the reporting capabilities of their BI software, companies should be able to identify risks and predict trends. 

Having a Strategy

Not having a BI strategy can be one of the biggest threat to your BI implementation. BI strategy can change the way you collect, analyze, and deliver data. As everyone works on the same KPIs to drive action and optimize processes, there is no chance of manual error. 


Global Data 365 It helps you with its experienced team who considers all the potential risks and avoids them during your BI implementation. To discuss your requirement, speak to one of our BI experts. 

Connect with Our BI Experts!

Share this blog on:

Search Blog

About Us

Global Data 365 is composed of highly skilled professionals who specialize in streamlining the data and automate the reporting process through the utilization of various business intelligence tools.

Follow us on:

Interact Live with Dashboards

Increase efficiency and deliver success now with Microsoft Power BI. Enjoy a 20% discount on all Power BI services.

dashboards

Subscribe to Our Newsletter

Why BI Implementation Can Be Risky? Read More »

Financial Reporting vs. Management Reporting. What is the Difference

Financial Reporting vs Management Reporting

Financial Reporting vs. Management Reporting. What is the Difference

Reporting is essential to the growth of any business. The reports provide information and insight for the business leader when making strategic choices that impact not only all the departments but also the company, particularly when it comes to financial and management reporting and analysis. An organization benefits from reporting, as it helps them to evaluate progress regarding their business objectives in an enterprise, and to make strategic decisions to lead the business towards future success. 


Many company owners are familiar with the standard financial reports they can expect monthly, but many are not familiar with the types of management reports available that could help boost efficiency and profitability for their companies. There are different kinds of management reports available. 


While there are different kinds of strategies in both financial and management reporting, organizations often search for someone who can work in both. That is why it is crucial to know the differences between financial reporting vs. management reporting. 

What is Financial Reporting?

Financial Reporting is directed towards compliance and is used for external purposes. Financial reporting is the method of shaping business strategies by supplying company stakeholders with financial reports. Financial Reporting can also be created to inform internal decisions. However, documents normally appear somewhat different from the data and contain different details. After that, the financial reports are sent to third parties. Financial Reports includes the usual weekly, monthly and annual reports that businesses get each month, including: 


Profit and Loss Statement 
– Balance Sheet 
– Accounts Payable 
Accounts Receivable 
Cash Flows Statement 


Depending on the time span, these reports will cover multiple time periods. The intent of the report, as well as the third parties requests. For instance, annual financial reports to shareholders will include a three-month time. These reports are crucial for any organization. These reports are used by banks, investors, and regulators to accept loans, lines of credit, and other decisions. In many situations, financial reports are needed to ensure adherence to certain laws or regulations. 


At a given point, these reports represent your company’s financial position. They explain the general impression of the success of your company but fail to provide deeper insight into the details of your business operations. They look backwards and don’t even inform you about the performance of the business in the next month or next year. Modern systems for financial restructuring may be altering this dynamic is due to the accumulation of data in real-time, as well as automated processes of reporting now allow the creation of financial reports that contains details of the current financial reports for your organization. 

What is Management Reporting?

With management reporting, companies can have a deeper insight into the financial health of their organization. Management reports provide more insight than financial reporting into the company’s financial situation, performance, and overview of all departments. Management reporting and analysis provide greater insights, which include the ability to segment and analyse information in a broad range of ways. Some of the ways include: 


  • Profit and Loss by Divisions 
  • Realization Rate 
  • Utilization Rate 

Management Reporting is focused on parts of the business instead of an overall view of the organization. By segmentation, you can get into the specifics and examine the drivers of the business. For instance, an example would be the evaluation of how the Marketing Department operates over a given amount of time, or how much benefit a sales employee has had over a certain month. Though, you might want to make sure that you are receiving the correct reports that your organization requires to drive strategic decision-making. 

Key Comparison: Financial Reporting vs Management Reporting

To enhance the performance and profitability of your business, different types of reporting techniques are available. Even though both contain different techniques, companies require someone who can handle both. 


Compared to financial reporting, management accounting is not compulsory and is used for internal purposes mainly. Rather than relying on general accounting data used to reflect a company’s financial situation, management reporting uses main performance indicators, including metrics to evaluate a business’ return on investment (ROI). 


Depending on what kind of financial reporting you use to inform your business plan, management reports are always a key commodity and are almost inevitably going to surpass financial reports when it comes to receiving greater insights. Whereas financial reports are simpler, management reports are more open-ended. The financial reports are critical for avoiding cash flow challenges and making more figures. To make informed strategic decisions, you will need management reports side by side. It is necessary to ensure the right processes and systems for the execution of apt financial and management reports. 

Importance of Financial and Management Reporting

Some businesses only require financial reports every month for various reasons. Because management reports cost them extra money, they tend not to use them. If your business fails to implement management reporting, you could be losing out on details that will help your business expand or keep you from introducing expensive services that do not offer an ROI. Any business requires financial reporting for compliance, to ensure that the figures add up, and to minimize cash flow. To make informed strategic decisions backed by reliable results, your company will also require management reporting. 


The insights gathered from management reporting and analysis are essential to make informed decisions that might be beneficial and profitable for your business. Management reporting also focuses on future data points that help plan for long-term future projects. Any organization will be interested in getting more insight into the whole company’s activities, which tends to improve success, profit, and productivity. 

Best Practices of Doing Financial and Management Reporting

There is a dire need for creating great reports that provide data to the primary stakeholders. Reports are meant to be easily readable and comprehendible by others, so it does not harm in putting more time into ensuring all these reports make a lasting impression on the target audience. 

Listed below are some of the best practices of creating impactful financial reporting vs management reporting: 


– Eye Appealing Reports: Important stakeholders are always busy. Dry, lengthy reports could end up losing their attention or confusing them when they need to search for the data they require. A well-constructed report will make it easier for the leaders to skim through the required information. 


– Automated Processes: It is essential to use automation to create reports, as it can save time. The less time is taken to produce a report, the quicker it can reach the business leaders. With the real-time aggregation of data pulled from the entire organization, you will have a report that will contain the latest data. 


– Implement Graphics and other Visuals: For a report to catch the reader’s attention, it should include graphics and other visual elements that make it easier to read the report. 


– Point-and-Click Design: You can either recruit a graphic designer to create the visuals on the report or use a point-and-click design to navigate easily through the report and deliver it at the right time. 


– Multiple Reports: By automating processes, you can make multiple reports that address the operations of the entire department separately. This gives the business leaders an overview of all operations. 

In Conclusion

A company’s performance and financial stability rely on both financial reporting vs management reporting. Yet, there are a wide variety of possible results when it comes to producing reports that fulfil their goals and deliver the required data on time to the main stakeholders. 


So, whether you are generating reports for external or internal use, the reports must be created in an easy-to-read format that holds the reader’s attention. Here at Global Data 365, we go beyond basic accounting data and offer BI solutions to companies. We help businesses improve performance and profitability by providing insight into the data gathered in real-time through our reporting and analytics solutions. 


Contact us now and speak to our BI experts. 

Get 30 days free license for Jet Reports.

Share this blog on:

Search Blog

About Us

Global Data 365 is composed of highly skilled professionals who specialize in streamlining the data and automate the reporting process through the utilization of various business intelligence tools.

Follow us on:

Still using Jet Basics?

Get Free Upgrade to Jet Reports

jet services

Subscribe to Our Newsletter

Financial Reporting vs Management Reporting Read More »

when you are using bad data for decision making MDM

When You Are Using Bad Data for Decision Making?

when you are using bad data for decision making MDM

Every business wants to unravel the power of big data. But is your data ready for prime time? We live in a big data environment where master data management is necessary, which is primarily due to the widespread use of computers and technology in businesses. Are you making decisions by relying on bad data? It is difficult to answer that question because you are mostly unaware that you are using bad data until it is too late.

A study conducted by Gartner reports that nearly 40% of enterprise data is unreliable, incomplete, or inaccessible. Bad data quality costs an average of $15 million a year in various forms. Such as financial loss, lost opportunities, and high-risk decision-making. What is the explanation for this? Because poor analytics is a result of bad data.

In today’s environment, the more data you gather, the better. However, with vast amounts of data from various sources covering several geographic areas, data has become increasingly complex, leading to create the nuisance of bad data for decision making. Although technology investment in managing business processes and collecting data has increased. It has greatly outpaced the time and money devoted to data management and governance.

So how can you be aware that the information you obtain and evaluate meets those criteria? To begin, you must first understand what qualifies as bad data.

Signs of Using Bad Data for decision making

The data that most executives are provided with almost once a month is used to make major decisions. When you have low confidence in the data you depend on, it impacts how you work. After working with several Microsoft Dynamics ERP clients who have struggled with bad data, we have compiled a list of signs that you are using bad data for everyday decision-making.

- Information Silos

There are different types of reports that exist on the servers, local machines, and networks, resulting in information silos.

- Incorrect Records and Manual Errors

Your financial team is forced to manually rummage through spreadsheet after spreadsheet, searching for inaccuracies and human mistakes because your month-end numbers don’t add up. Businesses just getting started often ignoring the value of inventory management, assuming their production isn’t high enough to justify it.

- Limited Resources

The resources are stretched thin with the extra calculations and machine workarounds placed to try and interpret the data the system is generating.

- Delay in Approvals

Since reports and budget approvals are continually delayed, you’re having trouble getting executive buy-in.

- Fixing Bugs

You devote considerable time to fixing problems and putting out fires than you do analyze and improving your data.


If these signs appear familiar, you might be unknowingly relying on inaccurate data or bad data for decision making. To get true insights into your market, you need the right tools and processes. Optimize the value of data and analytics in your company. Data is often inaccurate and unfinished, but with smart data management, efficient data governance, and centralized data storage. You can get a long way toward being a truly data-driven company.

Using Master Data Management (MDM) to Reduce the Risk of Bad Data

Since Microsoft Dynamics isn’t designed to handle data, we suggest integrating Master Data Management (MDM) into your business intelligence. MDM works by creating a clear, trustworthy view within an enterprise, organizing numerous data objects. It gives you total control over your data. It can be used to find the most up-to-date version of the reality in your data. Ensure accuracy and transparency in data governance: prepare data for analytics.


After you’ve developed your data governance and Master Data Management strategy, you’ll need to put it into action with centralized data storage. Allowing you to transfer and incorporate data from a variety of sources. You can produce reliable reports and dashboards that are consistent across the enterprise with a single view of your data. Enabling you to make super smart and useful business decisions.


Have a clear idea about what needs to be done to enhance the accuracy of your data and prepare it for reliable analysis. Contact Us to learn more about the effective ways to simplify data management. Find the benefit that a data warehouse designed particularly for your Dynamics approach will add to your decision-making processes.

Get 30 days free license for Jet Reports.

Share this blog on:

Search Blog

About Us

Global Data 365 is composed of highly skilled professionals who specialize in streamlining the data and automate the reporting process through the utilization of various business intelligence tools.

Follow us on:

Want to try Jet Analytics?
Get Free License for 30 Days
Jet Analytics Hero Section

Subscribe to Our Newsletter

When You Are Using Bad Data for Decision Making? Read More »