Complete Azure Cloud Services
- Global Data 365
Azure Cloud Services for Enterprise: Infrastructure, Data & D365 Integration Explained
Running a modern enterprise means managing a lot of moving parts applications, data pipelines, remote workforces, ERP systems, and cloud infrastructure all at once. Microsoft Azure has become the backbone for organisations that want to do all of this at scale, securely, and without rebuilding from scratch every few years.
At Global Data 365, we work with enterprises across the Middle East, the US, and beyond to deploy, manage, and optimise their Azure environments. This guide covers the 10 core Azure Cloud Services we specialise in from foundational infrastructure to advanced data and Dynamics 365 F&O integration.
Whether you’re evaluating Azure for the first time or looking to extend an existing environment, this is the complete picture.
What Are Azure Cloud Services for Enterprise?
Azure Cloud Services for enterprise refers to a suite of managed cloud capabilities compute, networking, containers, DevOps, data, analytics and security delivered through Microsoft’s global cloud platform. Unlike generic hosting, Azure is designed to integrate deeply with Microsoft’s broader ecosystem, including Dynamics 365, Power Platform and Microsoft 365.
Enterprises choose Azure because it offers:
- Global reach across 60+ regions
- Security and compliance built in from the ground up
- Seamless integration with Microsoft ERP and productivity tools
- Scalability from startup to multinational without re-architecture
Let’s break down each service in detai:
1. Azure Infrastructure
Azure Infrastructure is the foundation everything else sits on. It includes virtual machines (VMs), virtual networks (VNets), DNS, storage accounts, resource groups, and high-availability (HA) architecture all configured for production-grade enterprise workloads.
A properly designed Azure infrastructure isn’t just about spinning up VMs. It’s about designing for resilience, cost efficiency, and compliance from day one. At Global Data 365, our certified architects set up environments that score 90+ across availability, scalability, and compliance benchmarks.
Key capabilities:
– Virtual Machines & Scale Sets
– VNet & DNS Configuration
– High-Availability Architecture
– Storage Accounts
– Cost Optimisation via Azure Advisor
Who needs it: Any enterprise moving to the cloud or consolidating on-premise workloads.
2. Azure Kubernetes Services (AKS)
Modern applications are increasingly containerised. Azure Kubernetes Services (AKS) is Microsoft’s fully managed Kubernetes offering, allowing enterprises to run containerised workloads at scale without managing the underlying cluster infrastructure.
With AKS, teams can ship faster, scale automatically, and reduce infrastructure overhead. We handle cluster provisioning, Helm deployments, ingress configuration, auto-scaling policies, and GitOps-based delivery pipelines.
Key capabilities:
– Cluster Management
– Helm & GitOps
– Auto-Scaling
– Service Mesh
– Persistent Storage
– Ingress Configuration
Who needs it:
Development teams running microservices, APIs or any containerised application in production.
3. Azure DevOps & CI/CD Pipelines
Speed of delivery is a competitive advantage. Azure DevOps gives enterprises a fully integrated platform for code repositories (Azure Repos), project tracking (Azure Boards), automated testing, and multi-stage CI/CD pipelines all in one place.
Our team helps organisations achieve ELITE DORA performance scores meaning faster deployments, higher build success rates, and dramatically reduced mean time to recovery (MTTR). Infrastructure-as-code through Terraform and Bicep ensures every environment is consistent, auditable, and repeatable.
Key capabilities:
– CI/CD Pipelines
– Azure Repos
– Terraform / Bicep (IaC)
– Release Gates
– Azure Boards
Who needs it:
Engineering and DevOps teams that need to ship reliably, frequently, and without manual handoffs.
4. Azure Integration Services
Enterprise environments are complex ERP systems, third-party SaaS tools, legacy on-premise applications, and cloud-native services all need to talk to each other. Azure Integration Services solves this with Logic Apps, API Management, Service Bus, Event Grid, and Data Factory working together as a cohesive middleware layer.
We help enterprises connect 200+ systems with message throughput of 50,000+ events per day and latency below 0.1%. This eliminates data silos, automates cross-system workflows, and gives operations teams real-time visibility.
Key capabilities:
– Logic Apps
– API Management
– Service Bus
– Event Grid
– Data Factory
– Workflow Automation
Who needs it:
Enterprises with multiple systems that need real-time data flow and process automation across platforms.
5. Azure App Services & Web Apps
Not every application needs a containerised microservices architecture. For many enterprise web applications and APIs, Azure App Service provides a fully managed platform with zero infrastructure overhead auto-scaling, SSL, deployment slots, and Application Insights included.
Teams get production-ready performance with 99%+ uptime, 97/100 overall health scores, and seamless deployments using staging slots before pushing to production.
Key capabilities:
– Web Apps & APIs
– Deployment Slots
– Application Insights
– Custom Domains
– Auto-Scaling
– SSL / TLS
Who needs it:
Teams deploying customer-facing applications, internal portals, or REST APIs on Azure without wanting to manage servers.
6. Azure Virtual Desktop (AVD)
Remote and hybrid work is now permanent for most enterprises. Azure Virtual Desktop enables a secure, scalable virtual desktop infrastructure (VDI) accessible from any device, anywhere in the world.
We deploy AVD with FSLogix profile management for fast, persistent user sessions, Intune policy enforcement for device compliance, and session pooling to optimise licensing costs. With 10,000+ remote users supported and 99.7% session uptime, it’s enterprise VDI done right.
Key capabilities:
– AVD Deployment
– FSLogix Profile Management
– Microsoft Intune Policies
– Remote Access
– Session Pooling
– Multi-Device Support
Who needs it:
Enterprises with distributed, remote, or BYOD workforces needing secure access to corporate applications and data.
7. Azure Security & Identity
Security is not an add-on it’s a foundation. Azure Security & Identity covers the full Zero Trust framework: Microsoft Entra ID (formerly Azure AD), Conditional Access, Privileged Identity Management (PIM), Role-Based Access Control (RBAC), and Microsoft Defender for Cloud.
We implement continuous threat monitoring, compliance posture management, and identity governance tailored to your organisation’s risk profile. The result: 95%+ identity protection, 88%+ threat detection rates, and enterprise-grade Zero Trust coverage.
Key capabilities:
– Zero Trust Architecture
– Microsoft Entra ID
– Defender for Cloud
– RBAC & PIM
– Conditional Access
– Compliance Alignment
Who needs it:
Every enterprise security is non-negotiable in cloud environments handling sensitive business data.
8. Azure SQL & Managed Databases
Data is the lifeblood of enterprise operations. Azure SQL & Managed Databases provides fully managed relational database services Azure SQL Database, Azure SQL Managed Instance, and Azure Database for PostgreSQL / MySQL with built-in high availability, automated backups, and intelligent performance tuning.
For Dynamics 365 users, Azure SQL Managed Instance provides the closest compatibility to SQL Server on-premise, making it the preferred migration target for legacy ERP databases.
Key capabilities:
– Azure SQL Database
– Azure SQL Managed Instance
– Intelligent Query Performance Tuning
– Automated Backups & Point-in-Time Restore
– Geo-Replication & High Availability
– Built-in Threat Detection
Who needs it:
Enterprises running transactional workloads, ERP backends, or any application requiring structured, relational data at scale.
9. Azure Data Factory & Azure Synapse Analytics
For enterprises that need to move, transform, and analyse large volumes of data, Azure Data Factory (ADF) and Azure Synapse Analytics are the core services.
Azure Data Factory is a cloud-based ETL and data integration service. It allows you to build data pipelines that connect to 90+ sources on-premise databases, cloud APIs, file systems, SaaS platforms and move data reliably into your data warehouse or data lake.
Azure Synapse Analytics takes it further. It’s a unified analytics platform that brings together big data processing (Apache Spark), enterprise data warehousing, and data integration in a single workspace. Synapse enables SQL-based analytics on petabyte-scale data alongside machine learning and real-time streaming.
Together, ADF and Synapse power end-to-end data platforms from raw data ingestion to business-ready reporting in Power BI.
Key capabilities (Data Factory):
– 90+ data source connectors
– Code-free and code-first pipeline authoring
– Scheduled and trigger-based execution
– Data flow transformations
– Integration with Azure Data Lake & Blob Storage
Key capabilities (Synapse Analytics):
– Server-less and dedicated SQL pools
– Apache Spark for big data processing
– Synapse Studio unified development environment
– Native Power BI and Azure ML integration
– Real-time analytics with Synapse Link
Who needs it:
Enterprises building enterprise data warehouses, data lakes, or unified analytics platforms that feed BI reporting in Power BI.
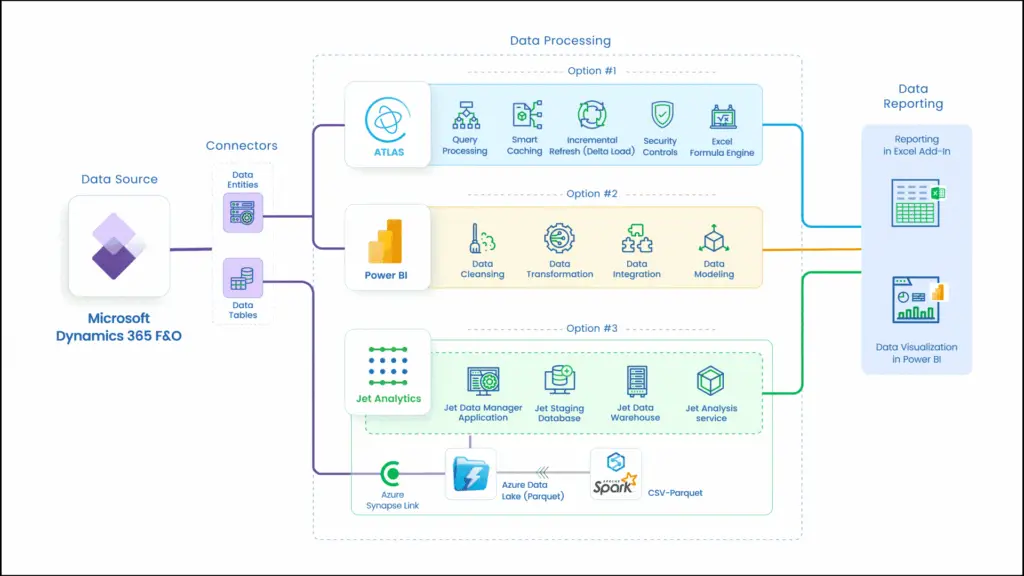
10. Azure Synapse Link for Dynamics 365 F&O
This is one of the most powerful and under-utilised capabilities available to Dynamics 365 Finance & Operations users.
Azure Synapse Link for D365 F&O (formerly known as Export to Data Lake) creates a near-real-time, continuous export of your Dynamics 365 F&O data directly into Azure Data Lake Storage Gen2. From there, it can be analysed in Synapse Analytics, transformed with Azure Data Factory, and visualised in Power BI without touching the live D365 environment or impacting production performance.
This eliminates the need for complex, fragile custom integrations just to report on your ERP data. Business users get fresh, accurate data in their dashboards. IT teams get a governed, scalable data pipeline. Finance and operations leaders get the analytics they’ve always needed.
Key capabilities:
– Near-real-time D365 F&O data export
– No performance impact on production D365
– Automatic table change tracking
– Integration with Azure Synapse Analytics
– Power BI reporting on live ERP data
– Support for Finance, Supply Chain, HR, and more
Who needs it:
Any organisation running Dynamics 365 Finance & Operations that wants real-time visibility into ERP data without custom integrations or reporting bottlenecks.
How These Services Work Together
- Azure Infrastructure:
The foundation: VMs, VNets, storage and HA configuration. - Azure Security & Identity:
Zero Trust, Entra ID, and RBAC applied across everything. - Azure DevOps & CI/CD:
All deployments automated through pipelines. No manual changes in production. - Azure App Services / AKS:
Applications deployed on managed platforms with auto-scaling. - Azure Integration Services:
Connecting D365, third-party SaaS, and internal systems. - Azure SQL & Managed Databases:
Transactional data layer for ERP and applications. - Azure Data Factory:
Pipelines pulling data from D365, SQL, and other sources into the data lake. - Azure Synapse Analytics:
Analytics on top of the data lake, feeding Power BI dashboards. - Azure Synapse Link for D365 F&O:
Real-time ERP data flowing into the analytics platform. - Azure Virtual Desktop:
Remote teams accessing everything securely from any device.
The result is a governed, scalable, analytics-ready enterprise cloud environment not a collection of disconnected tools.
Why Global Data 365 for Azure Cloud Services?
Global Data 365 is a certified Microsoft partner with deep specialisation in both Azure cloud infrastructure and Dynamics 365 ecosystems. That dual expertise matters because most Azure partners don’t understand ERP, and most ERP partners don’t do cloud infrastructure.
We do both:
- Microsoft-certified Azure architects lead every engagement
- Global delivery across 15+ countries
- Fast time-to-value production-ready environments weeks ahead of standard timelines
- Security-first hardening, compliance alignment, and monitoring built into every project
- Transparent cost management via Azure Cost Management and Advisor
- 24/7 managed support from deployment through day-2 operations
Frequently Asked Questions
What are Azure Cloud Services for enterprise?
Azure Cloud Services for enterprise refers to Microsoft’s suite of managed cloud solutions including compute, networking, containers, DevOps, databases, analytics, and security configured and managed for production enterprise workloads.
What is Azure Synapse Link for D365 F&O?
Azure Synapse Link for Dynamics 365 Finance & Operations is a near-real-time data export capability that continuously replicates D365 F&O data into Azure Data Lake Storage, enabling analytics in Synapse and reporting in Power BI without impacting ERP performance.
How does Azure Data Factory differ from Azure Synapse Analytics?
Azure Data Factory is an ETL/data integration service for building pipelines that move and transform data across sources. Azure Synapse Analytics is a unified analytics platform for big data processing and data warehousing. They are complementary ADF typically feeds data into Synapse.
Is Azure SQL good for Dynamics 365 workloads?
Yes. Azure SQL Managed Instance is the preferred migration target for enterprises moving D365 or other SQL Server workloads to Azure, offering near-complete SQL Server compatibility with managed infrastructure.
How long does it take to set up Azure Cloud Services for an enterprise?
With an experienced partner like Global Data 365, production-ready Azure environments can be deployed weeks ahead of industry standard timelines using proven delivery frameworks and infrastructure-as-code (Terraform/Bicep).
Ready to Build Your Enterprise Azure Environment?
Search Blog
Related Resources

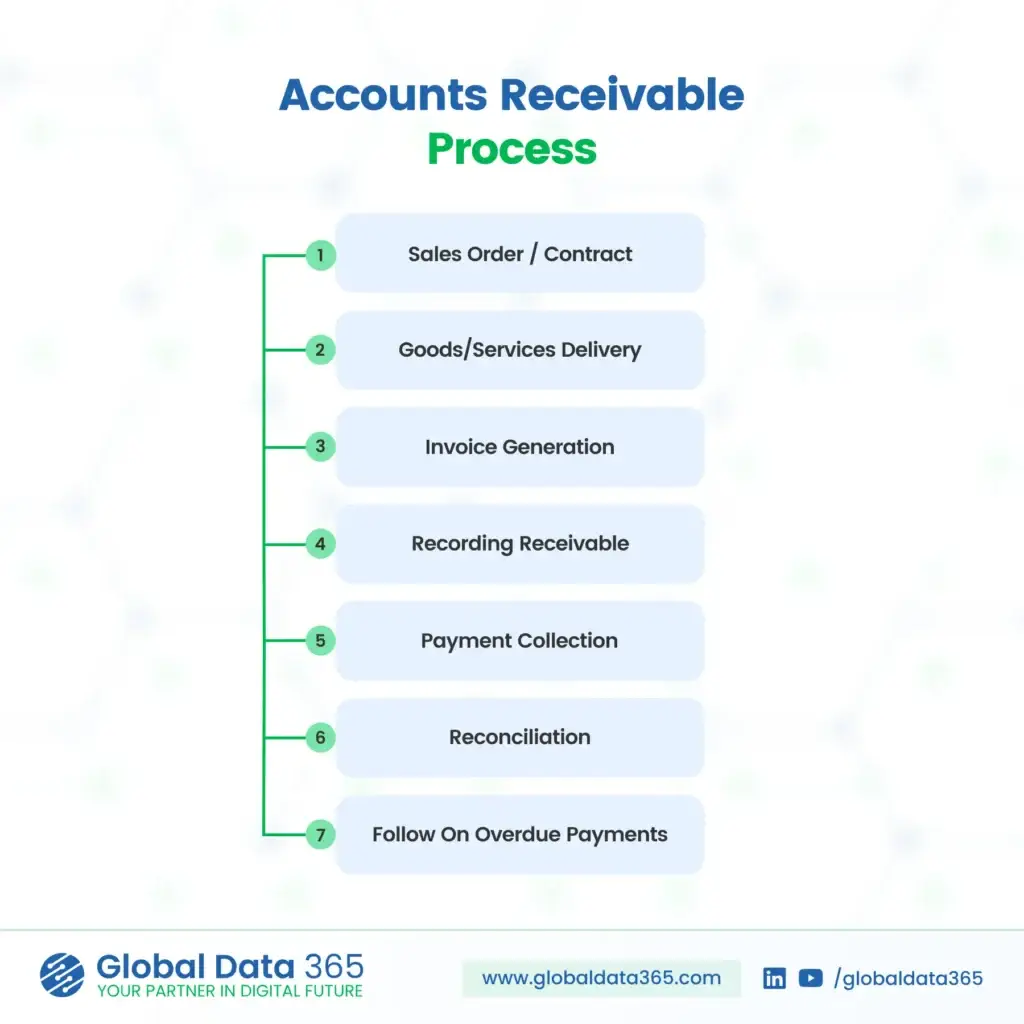
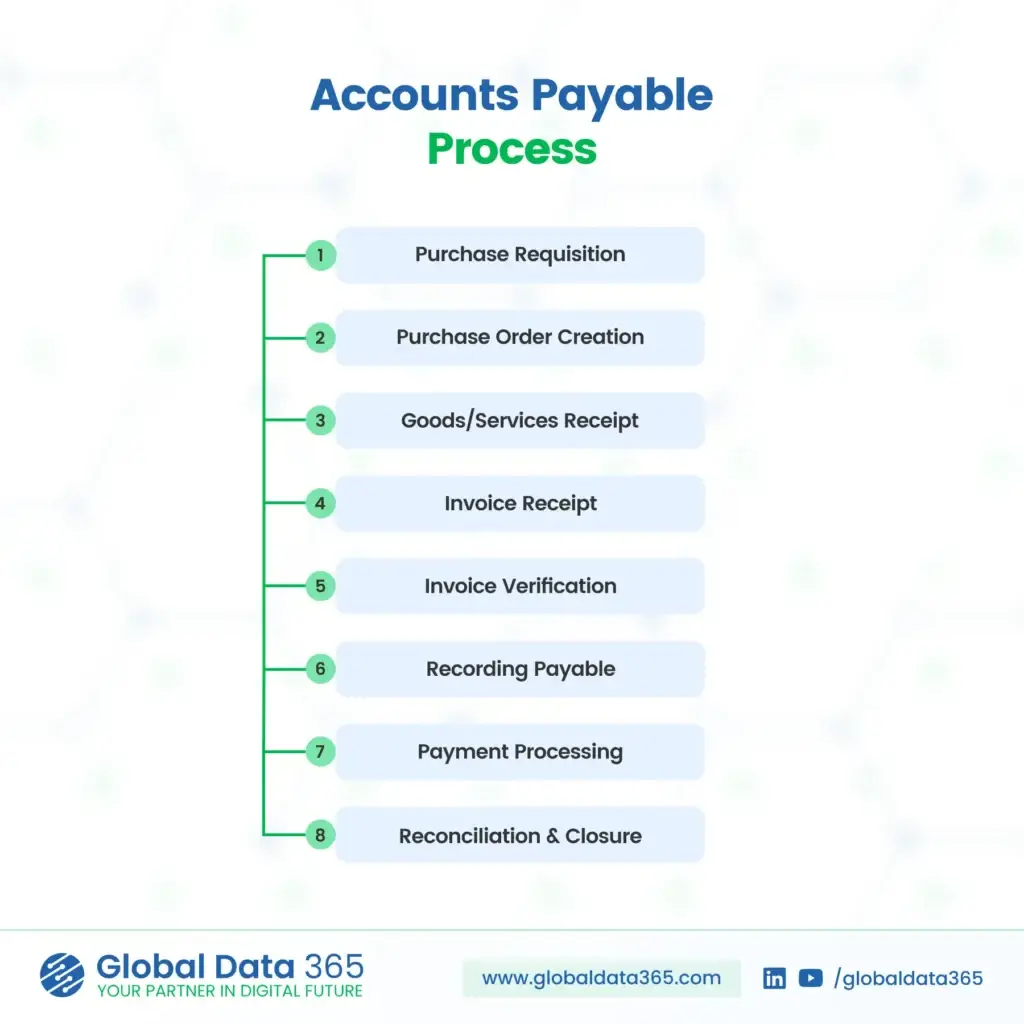
Accounts Receivable vs Accounts Payable

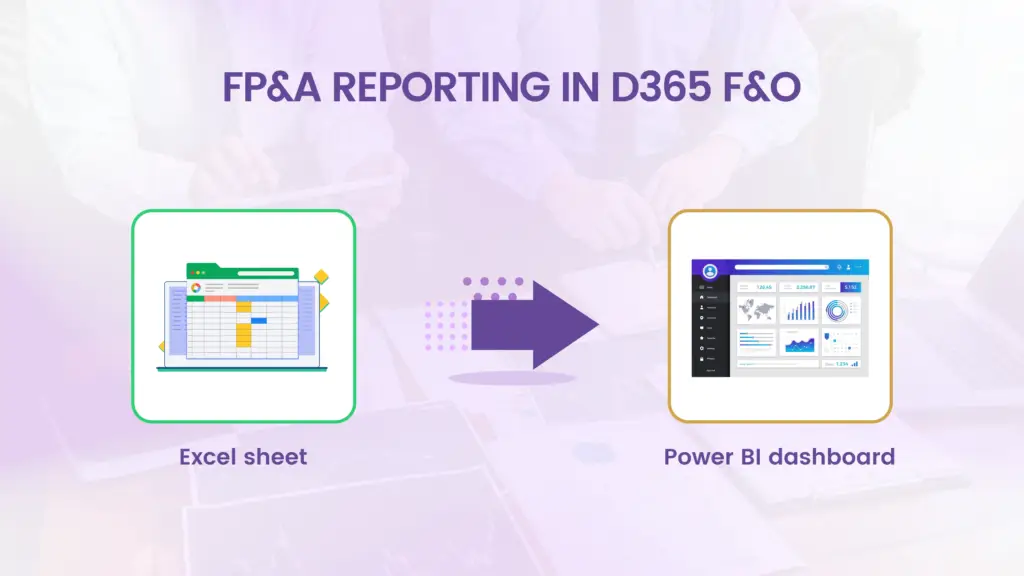
Why Power BI is a Better Choice than Excel for Analytics