Global Data 365

Business Central for ERP Platform with AI Automation 

Business Central for ERP Platform with AI Automation 

Business Central for ERP Platform with AI Automation 

How Business Central Is Becoming an Intelligent ERP Platform with AI Automation

In the world of business today companies have to do things faster. They need to cut costs and make decisions quickly. For a time traditional ERP systems have helped companies with money, supplies, inventory and customers. Now companies need more than just basic help. They need systems that can do things on their own, predict what will happen and give them ideas. 


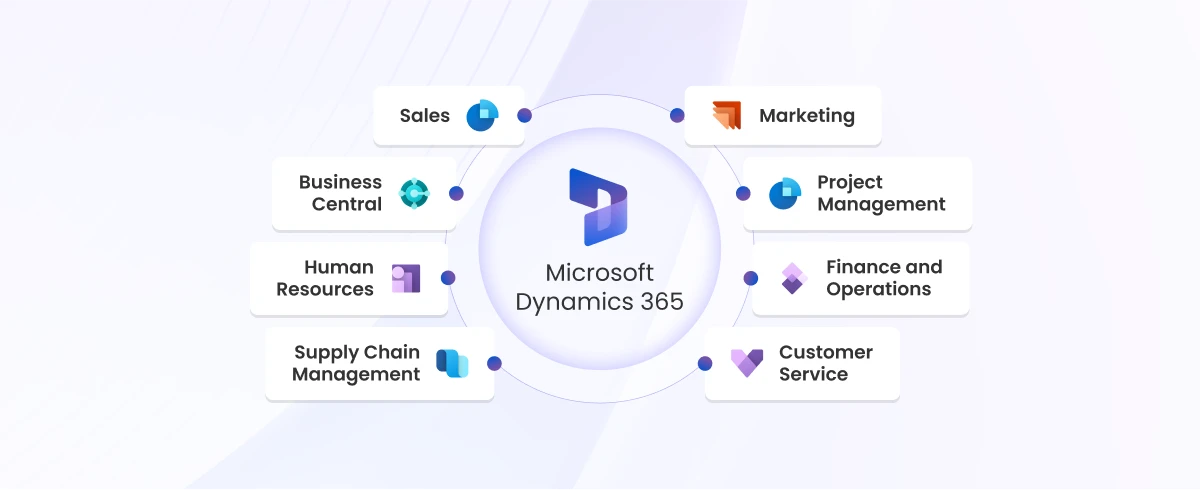
This is where Business Central for ERP Platform is making a difference. Business Central is using ideas from Microsoft in artificial intelligence, automation and cloud technology to become a smart ERP system. Microsoft Dynamics 365 Business Central is helping companies work better and make decisions. 


Professional companies like Global Data 365 and Aegis Dynamics Business Central implementation services, they are getting access to advanced tools. These tools combine ERP systems with new automation ideas that use artificial intelligence. This is changing the way companies plan and work. Business Central is setting standards for how companies should work and making things better. 

Understanding the Evolution of Business Central for ERP Platform

Microsoft Dynamics 365 Business Central is not an ordinary tool to manage a company. It was made to help with things like accounting and inventory. Now it does a lot more. It has features that use artificial intelligence to make things automatic and help us guess what will happen in the future. 


Companies make a lot of data every day. It is hard to find information in all of that data without the right tools. Microsoft Dynamics 365 Business Central helps with this by using intelligence to turn data into something that can help the company. 

Microsoft Dynamics 365 Business Central uses intelligence to do things like:

  • Automate tasks that we have to do over and over
  • Reduce mistakes that people make
  • Help us guess what will happen in the future
  • Make our customers happy
  • Help us manage our inventory
  • Make the company work better

Such capabilities are turning Business Central for ERP Solutions to be the best option for organization who want digital transformation in the long run.

The Role of AI in Modern ERP Systems

Artificial intelligence is changing how ERP platforms work. By just recording transactions AI-enabled ERP systems look at data, find trends and suggest what to do.


The growth of AI-powered ERP solutions helps organizations make decisions before problems happen than reacting to them. AI watches business activities as they happen. Gives recommendations that help leaders respond fast to changes in the market.

Some key AI features now in ERP platforms include:

  • Dynamic analytics
  • Intelligent forecasting
  • Automated workflows
  • Natural language processing
  • Machine learning algorithms
  • Real-time business insights

These advancements help companies get more done while making things simpler. 

Business Central AI Automation: Transforming Daily Operations

One of the changes we have seen in the last few years is the introduction of Business Central AI automation capabilities.


AI automation helps cut down on boring manual work by letting the system take care of routine tasks on its own. This means employees can focus on projects instead of wasting hours on paperwork and administrative tasks.

1. Intelligent Financial Management

Financial teams usually spend a lot of time dealing with invoices balancing accounts and making reports. Business Central AI automation makes these tasks easier by:

  • Sorting transactions into categories
  • Finding things going on with the money
  • Helping to predict how cash we will have
  • Speeding up the process of paying invoices
  • Reducing mistakes in accounting

These things help the financial department be more accurate and efficient while still following the rules.

2. Automated Inventory Optimization

Managing inventory is very important for making a profit and keeping customers happy. 

With Business Central AI automation companies can: 


  • Predict what people will want to buy in the future 
  • Make sure they have the amount of stock 
  • Save money on storing inventory 
  • Avoid running out of things 
  • Make decisions about what to buy 

Business Central AI automation helps companies forecast what they need so they have the right things at the right time, which cuts down on waste and makes the business run better. 

3. Smarter Supply Chain Management

When there are problems with the supply chain it can really hurt the business. Business Central AI automation helps companies find problems and make changes before they happen.


Business Central helps optimize the supply chain by:

  • Predicting what people will want
  • Looking at how suppliers are doing
  • Suggesting when to restock
  • Planning logistics
  • Showing what is in stock, in time

Business Central AI automation makes supply chain management smarter and more efficient which helps the business run more smoothly.

Microsoft Business Central Automation Enhances Productivity

The use of Microsoft Business Central automation is becoming more popular. It is helping companies simplify the way they do things across all areas. 


Automation eliminates repetitive manual tasks from work methods enabling workers to devote their time to activities that add more values. 

1. Sales Process Automation

Sales teams can really benefit from using Microsoft Business automation. This is because it can do things like: 


  • Generate quotes for customers 
  • Make sure customer information is up to date 
  • Help with predicting sales 
  • Manage leads 
  • Process orders 

 All of these things help sales teams respond to customers faster and do their jobs better. 


2. Customer Service Automation

Customers expect a lot from companies these days. They want help fast. They want it to be personalized. 


Microsoft Business Central helps companies provide customer service by: 

  •  Automating the work that customer service teams do 
  • Keeping track of what customers are saying 
  • Giving customer service teams ideas based on what the customer is saying 
  • Providing information about customers in real time 

 This helps companies make customers happier while also saving money on customer service. 

3. Procurement Automation

When companies buy things it often involves a lot of paperwork and approvals. 


Microsoft Business Central automation makes buying things easier by: 

  •  Automatically creating orders 
  • Talking to suppliers 
  • Keeping an eye on how suppliers are doing 
  • Tracking the process of buying things 

AI-Powered ERP Solutions Drive Better Decision-Making

The real power of AI is its capacity to change data into unlawful understanding.


Traditional reporting usually looks at information. On the other hand, AI-powered Enterprise Solutions give predictive intelligence. This helps businesses get ready for opportunities and challenges.

1. Dynamic Analytics

Predictive analytics helps organizations to:

  • Forecast sales trends with AI
  • Anticipate what customers will demand
  • Identify risks early
  • Predict when equipment needs maintenance
  • Improve planning with AI insights

These insights help leaders make decisions with more confidence because they use AI.

2. Real-Time Business Intelligence

Business Central gives access to real-time dashboards and analytics. This allows decision-makers to keep an eye on execution all the time with AI.


Benefits include:

  • Responding to changes in the market
  • Improving visibility into operations
  • Enhancing planning strategically
  • Allocating resources better
  • Increasing profitability with AI insights

These insights help leaders make decisions with more confidence because they use AI.

The Importance of Business Central Implementation for AI Success

A successful Business Central implementation is key to using AI and automation properties in Microsoft Dynamics 365 Business Central. When Business Central is set up with the right business processes, data and workflows are improved, which helps AI tools give information and automate tasks well. If Business Central is not set up strategically companies may not get the most out of their ERP system.


Here are the main advantages of setting up Business Central for AI:

  • Ensures data is correct and clean for AI insights.
  • Makes workflows smoother to help with automation.
  • Helps with forecasting and decision making.
  • Makes it easier for users to adopt AI features.
  • Reduces operations and manual tasks.
  • Gets the most out of ERP technology investment.
  • Builds a base for future AI developments with Business Central.

The Future of ERP Systems Is AI-Driven

The future of ERP systems is really connected to how intelligence and machine learning are getting better. This is also linked to improvements in

cloud computing.

As time goes on ERP platforms will get smarter. Be able to do things on their own. They will also be able to predict things.

Some things that might happen in the future include:

  • Advanced AI assistants that can help us
  • Automation that can do things without anyone telling it to
  • Forecasting that is more accurate
  • Risk management that is smarter
  • Experiences that are tailored to each user
  • AI that is specific to each industry

Companies that start using these things early will have a big advantage over others.

Microsoft is always putting money into intelligence. This means that Business Central will always be one of the ERP systems.

Why Businesses Are Choosing Business Central for ERP Platform

Lots of companies are choosing Business Central for their ERP platform. They are doing this because it has: 


  • The ability to grow with their company because it is in the cloud 
  • All the things they need for ERP 
  • Artificial intelligence built in 
  • Easy integration, with other Microsoft products 
  • The ability to customize it to their needs 
  • Security to keep their information safe 

Conclusion

With enterprises adopting digital transformation, Business Central for ERP Platform is becoming a robust solution that offers intelligent automation capabilities, AI-driven insights and operational excellence. It makes organizations competitive in a fast changing market, from automating processes to enhancing decision-making. A successful Business Central implementation will help an organization do just that, providing a flexible and future-proof ERP environment that enables growth and evolution for years to come.

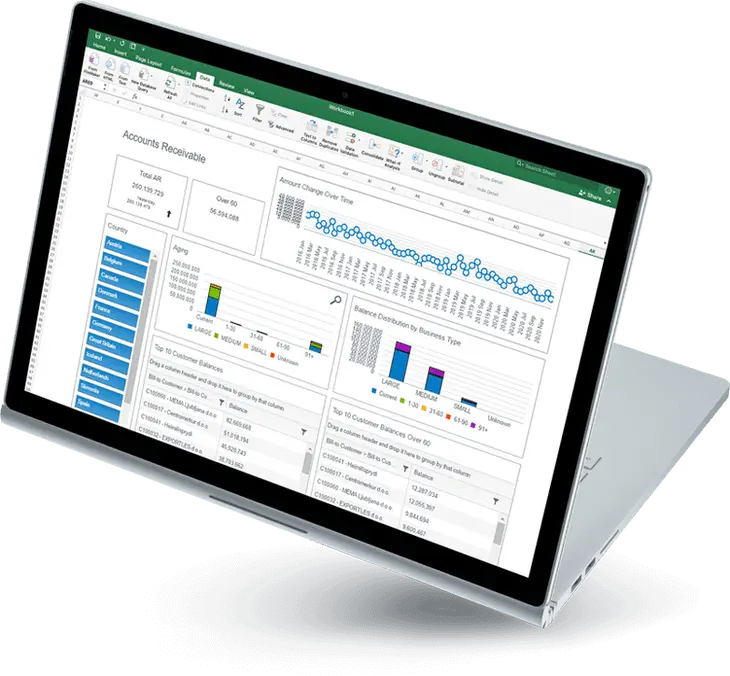
With Global Data 365’s Reporting Solution curated specially for the D365 Business Central you can choose from three powerful tools tailored to your business needs and reporting requirements. Whether you need flexible Excel reporting, a centralized data warehouse, or interactive business intelligence dashboards, we have the right solution to help you make faster, data-driven decisions..

Ready to transform the way your enterprise operates?

Share this blog on:

Search Blog

About Us

Global Data 365 is composed of highly skilled professionals who specialize in streamlining the data and automate the reporting process through the utilization of various business intelligence tools.

Follow us on:

Still using Jet Basics?

Get Free Upgrade
to Jet Reports

jet services

Subscribe to Our Newsletter

Business Central for ERP Platform with AI Automation  Read More »
Optimizing Power BI Performance in ERP Reporting

Optimizing Power BI Performance: The Real Causes Behind Slow Reports

Optimizing Power BI Performance in ERP Reporting

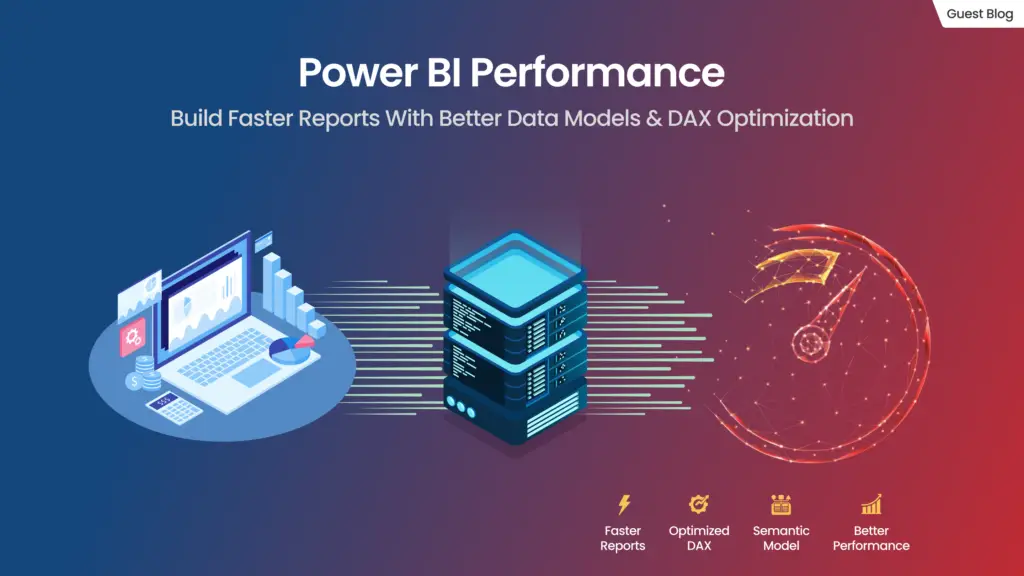
The Real Causes Behind Slow Reports: Power BI Performance

The slow Power BI reports rarely begin with an inefficient DAX measure or a cluttered dashboard. By the time a visual takes ten seconds to load, the conditions that caused the delay have often been building for weeks or even months. The report simply becomes the first place where those decisions are noticed.


Most teams discover the problem in the same way. A business user opens a dashboard during a meeting, applies a filter, and waits. Someone refreshes the page, assuming something has gone wrong. Another exports the data to Excel because it feels quicker than waiting for the report to respond. Before long, the discussion shifts from the insights on the screen to the reliability of the analytics platform itself.


At this stage, the instinctive response is to optimize DAX, remove visuals, or simplify calculations. While those changes can improve performance, they rarely address the underlying cause. A few weeks later, another report begins slowing down, and the same troubleshooting cycle starts again.


The reason is straightforward. Every interaction inside Power BI triggers a chain of operations that extends well beyond the report canvas. Before a visual is rendered, the platform must:

  • Evaluate the semantic model and identify the relevant
  • Push queries to the Storage Engine wherever
  • Execute business logic through the Formula Engine when
  • Retrieve, aggregate, and compress data before returning the final result to the

Each of these stages introduces an opportunity for inefficiency. A poorly designed star schema, excessive high-cardinality columns, unnecessary bidirectional relationships, or an overworked Formula Engine can all increase query execution time. The report merely exposes the cumulative impact of those decisions.


This explains why two dashboards with nearly identical visuals can perform very differently. One responds almost instantly, while the other struggles despite using similar measures and charts. The difference often lies beneath the surface, in the way the semantic model has been designed, how effectively VertiPaq compresses data, and whether the workload is being executed by the engine best suited to handle it.


The organizations that consistently deliver responsive Power BI environments approach performance differently. They do not treat it as a report-level tuning exercise. Instead, they view it as an engineering discipline that begins with data modelling, continues through query execution and is reinforced by thoughtful capacity planning. Once that mindset shifts, the conversation moves beyond fixing slow reports to preventing them altogether.

Understanding Where Power BI Actually Spends Its Time

One of the biggest misconceptions about Power BI performance is that every report interacts with data in the same way. It doesn’t.

The moment a user clicks a slicer, drills into a visual, or changes a filter, Power BI begins executing a sequence of operations behind the scenes. Each stage depends on the one before it, which means a delay introduced early in the process is carried all the way to the final visual.

A simplified query journey looks like this:

User Interaction → Semantic Model → Storage Engine → Formula Engine → Visual Rendering

Each component serves a distinct purpose, and each can become a bottleneck under different conditions.

ComponentRoleCommon Performance Bottleneck
Semantic ModelDetermines relationships, metadata, and filter contextPoor model design, excessive relationships, high-cardinality columns
Storage Engine (SE)Retrieves and aggregates compressed data Inefficient storage, limited aggregations, DirectQuery latency
Formula Engine (FE)Evaluates complex DAX logic that cannot be pushed to the Storage EngineIterators, repeated context transitions, complex calculations
Visual RenderingDisplays results on the report canvasToo many visuals, unnecessary interactions, and large result sets

The distinction between the Storage Engine and the Formula Engine deserves particular attention because it explains why some reports remain fast while others deteriorate as they grow.

The Power BI Storage Engine is highly optimized for scanning compressed, columnar data. Whenever possible, Power BI tries to push filtering and aggregation work to this engine because it processes large datasets efficiently.


The Power BI Formula Engine plays a different role. It evaluates business logic that cannot be resolved through straightforward storage operations. This includes many advanced DAX calculations, row-by-row evaluations, and complex filter manipulations. While incredibly flexible, it is significantly more expensive from a computational perspective.


The challenge arises when the Formula Engine begins performing work that could have been avoided through better data modeling. Measures built on top of inefficient relationships, repeated iterator functions, or unnecessarily complex filter contexts force the engine to execute far more calculations than necessary.


This is why experienced Power BI developers often say that good models make simple DAX possible. Efficient reports are not built by writing clever formulas. They are built by creating models that allow the engines to do their jobs efficiently. Before rewriting another measure, it is worth asking a different question:


Is the Formula Engine solving a business problem or is it compensating for weaknesses in the semantic model?

That distinction often determines whether a report becomes progressively slower as data volumes increase or continues to perform reliably at enterprise scale.

Power BI Performance Debt Usually Begins in the Semantic Model

When organizations talk about Power BI performance, they often focus on what users can see, slow visuals, delayed slicers, or measures that take several seconds to return a result. What receives far less attention is the semantic model, even though it is the foundation on which every report depends.

Think of the semantic model as the blueprint of the entire reporting environment. It defines how tables relate to one another, how filters travel across the model, and how efficiently Power BI can answer analytical questions. If this foundation is poorly designed, every report built on top of it inherits the same performance limitations.

One of the most common examples is the absence of a well-designed star schema.

Instead of organizing data around a central fact table connected to smaller dimension tables, many models evolve organically as reporting requirements grow. Additional lookup tables are introduced, relationships become increasingly complex, and developers rely on calculated columns or complex DAX to bridge gaps that should have been addressed during modelling.

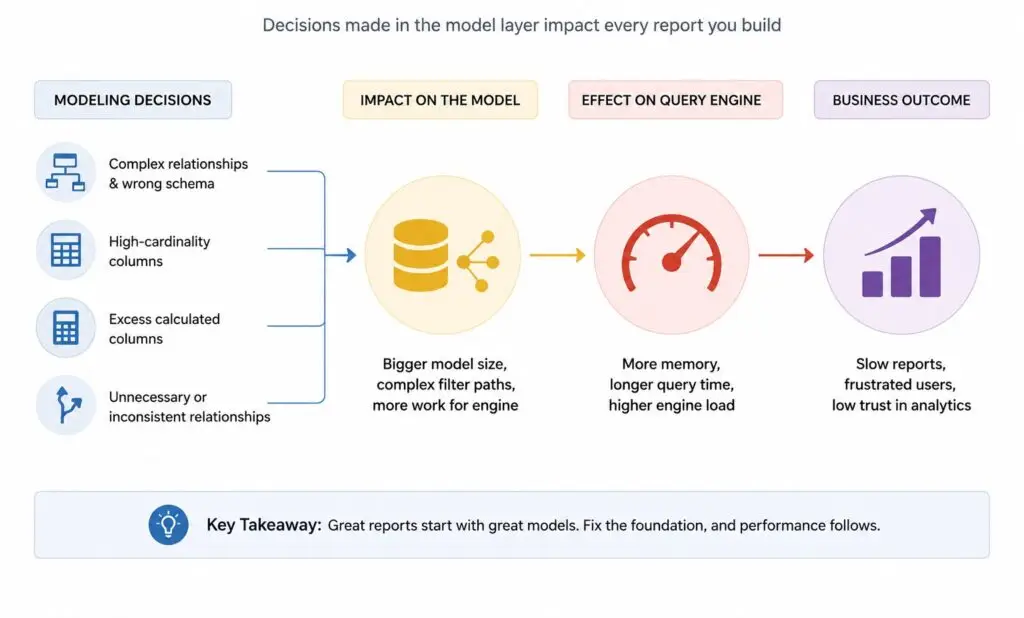
The model continues to work, but it becomes progressively harder for the query engine to navigate. Other seemingly harmless decisions also create long-term performance debt.

Other seemingly harmless decisions also create long-term performance debt.

    • High-cardinality columns such as transaction IDs, timestamps, or free-text fields consume significantly more memory because they contain a large number of unique values.
    • Excessive bidirectional relationships increase the amount of filter propagation required during query execution, particularly in complex models.
    • Large numbers of calculated columns increase the size of the in-memory model, extending both refresh times and memory consumption.
    • Inconsistent or unnecessary relationships make query optimisation more difficult, forcing Power BI to perform additional work before returning results.

Individually, none of these decisions may have a noticeable impact. Together, they create a model that becomes increasingly difficult to optimize as datasets expand.


A useful way to think about semantic model design is to separate decisions that improve business flexibility from those that improve computational efficiency. The two are not always the same.


Every improvement made at the modelling layer reduces the amount of work required during query execution. In contrast, every shortcut taken during model design eventually resurfaces as a performance issue, often disguised as a “slow report.”


The irony is that many organizations begin optimizing at exactly the wrong point. They rewrite measures, simplify visuals, or increase Premium Capacity, hoping the additional resources will compensate for slow reports. While these efforts may reduce symptoms temporarily, they rarely eliminate the structural inefficiencies embedded within the model itself.


That is also why the same DAX measure can behave very differently across two reports. In one model, it executes almost instantly because the underlying structure supports efficient query execution. In another, the identical calculation struggles because the engine spends far more time locating, filtering, and preparing the data before the measure is even evaluated.

Power BI performance from modeling to outcome

Performance, in other words, is rarely created by a single formula. More often, it reflects the quality of the architecture beneath it.

Heavy DAX Queries Are Often a Symptom, Not the Root Cause

Few topics generate as much discussion in the Power BI community as DAX optimization. Developers scrutinize every measure, replace one function with another, and experiment with different calculation patterns, all in pursuit of shaving a few milliseconds off execution time. While these refinements certainly have their place, they often overlook a more fundamental question: why is the measure expensive in the first place? The answer usually lies in how much work the Formula Engine is forced to perform.

Whenever possible, Power BI relies on the Storage Engine because it is optimized to scan compressed, columnar data and return aggregated results quickly. Performance begins to deteriorate when calculations cannot be resolved at the storage layer and instead require the Formula Engine to evaluate rows individually, perform repeated context transitions, or execute complex filter logic.


Certain DAX patterns naturally demand more processing than others. Functions such as SUMX, FILTER, RANKX, and nested CALCULATE statements are not inherently inefficient. They become expensive when they iterate over millions of rows or repeatedly evaluate the same expressions within a single query.


Another common issue is repeated calculations. It is not unusual to find reports where similar logic appears across dozens of measures. Each measure works independently, but together they create unnecessary computational overhead. Reusing intermediate calculations through variables, simplifying filter context, and avoiding duplicate business logic can significantly reduce execution time without changing the analytical outcome.


It is equally important to recognise when DAX is compensating for shortcomings elsewhere. Developers frequently write increasingly complex measures to overcome limitations in the underlying model. Over time, business logic shifts from the data model into calculations, making reports harder to maintain and slower to execute.

Before optimizing any measure, it helps to ask a few simple questions.


Ask before rewriting a DAX measure


  • Can this transformation be performed during data preparation instead of at query time?
  • Is the calculation repeatedly evaluating the same expression?
  • Can variables reduce repeated computation?
  • Is the calculation iterating over more rows than necessary?
  • Would improving the semantic model simplify the measure altogether?

Many performance improvements come from writing less DAX rather than more sophisticated DAX.

Performance Does Not End with the Data Model

Even a well-designed semantic model can struggle if reports are built without considering how users interact with them. Every slicer, bookmark, tooltip, drill-through page, and cross-highlight generates additional work. Individually, these interactions are lightweight. Collectively, they can create a reporting experience that feels noticeably slower, particularly when several visuals refresh simultaneously.


One of the most common mistakes is assuming that more visuals create more value. In practice, every visual submits its own query. A dashboard containing twenty visuals may execute twenty independent queries before the page finishes loading. If several of those visuals rely on complex calculations, the cumulative effect becomes significant.


Report design should therefore focus on decision-making, not information density. Some practical principles consistently improve responsiveness:

  • Limit visuals to those that directly support business
  • Reduce unnecessary visual interactions where cross-filtering adds little analytical
  • Use drill-through pages instead of displaying every level of detail on a single
  • Apply page-level and report-level filters carefully to minimise the amount of data each visual
  • Review report behaviour regularly using Performance Analyzer rather than relying on

Fast reports are rarely the result of a single optimization. They emerge from hundreds of small design decisions made consistently throughout the development process.


Performance Monitoring Should Become Part of Every Deployment

Many organisations treat Power BI performance tuning as a one-time exercise completed before a report is published. The reality is very different. Reports evolve continuously. New measures are added. Business logic changes. Datasets grow. What performs well today may behave very differently six months later. For that reason, performance should be monitored with the same discipline applied to data quality or governance.

Modern Power BI development provides several tools that make this possible.

Modern Power BI development provides several tools that make this possible.

  • Performance Analyzer helps identify visuals responsible for long execution
  • DAX Studio exposes query plans and distinguishes work performed by the Storage Engine and the Formula Engine.
  • VertiPaq Analyzer highlights opportunities to reduce model size, optimise compression, and identify columns consuming excessive memory.
  • Capacity Metrics in Microsoft Fabric and Power BI Premium help administrators understand concurrency, memory utilisation, and refresh behaviour across the environment.

These tools should not be reserved for troubleshooting. Used proactively, they reveal performance trends long before business users begin reporting slow dashboards.

What High-Performing Power BI Teams Do Differently?

The difference between average and high-performing BI teams rarely comes down to technical ability. It comes down to process. Rather than reacting to slow reports, experienced teams establish performance as a design principle throughout the development lifecycle.

Some of the practices that consistently separate mature Power BI implementations include:

  • Designing semantic models before building
  • Following star schema principles wherever
  • Keeping business logic close to the data rather than recreating it repeatedly in DAX.
  • Using Import Mode, DirectQuery, and Composite Models only where they provide a clear architectural advantage.
  • Reviewing model size and memory usage as datasets
  • Incorporating performance testing into development and release cycles instead of waiting for production

These practices require greater discipline during development, but they significantly reduce maintenance effort over time. As enterprise deployments grow, partnering with an experienced Power BI consulting services team can help ensure that backend models remain scalable instead of repeatedly fixing performance issues report by report.

Case Study: Solving the Wrong Problem First

A global retail organization noticed that one of its executive sales dashboards had become increasingly difficult to use. Some visuals required more than fifteen seconds to respond, particularly during monthly business reviews. The initial assumption was that the report contained inefficient DAX measures.


Several weeks were spent rewriting calculations, replacing iterator functions, and simplifying visuals. While individual queries improved slightly, the overall user experience remained largely unchanged.


A detailed performance assessment revealed a different story. The semantic model contained multiple bidirectional relationships, duplicated dimensions, and several high-cardinality columns that were never used for reporting. Many calculations were compensating for inconsistencies introduced during modelling rather than performing genuine business logic.


Instead of rewriting additional measures, the development team redesigned the model using a cleaner star schema, removed redundant columns, simplified relationships, and shifted several transformations into the ETL layer. Only after those architectural improvements were complete did they revisit the most expensive DAX measures.


The result was a substantial reduction in report response time, lower memory consumption, and a model that remained performant as new data was added. The most significant gains came from changing the architecture, not from rewriting formulas. The lesson is difficult to ignore. Optimising DAX without understanding the model is much like tuning a car engine while ignoring the condition of the transmission.

Frequently Asked Questions

Not usually. If the underlying semantic model is inefficient, rewriting measures often delivers only incremental improvements. Model design should always be evaluated first.

No. Import Mode generally delivers the fastest query performance, but it also depends on model size, refresh requirements, and available memory. The right storage mode depends on the workload rather than a single best practice.

No. Functions such as SUMX become expensive when they process large datasets repeatedly. Used appropriately within a well-designed model, they can perform efficiently.

Performance should be evaluated whenever significant changes are made to the Power BI semantic model, report design, dataset size, or refresh strategy. It should be part of regular development rather than an emergency response.

Performance Analyzer provides an excellent starting point for identifying slow visuals. As optimization requirements become more advanced, DAX Studio and VertiPaq Analyzer offer much deeper insights into query execution and model efficiency.

Conclusion: Power BI Performance Is an Outcome of Good Architecture

Slow reports rarely appear overnight. They evolve gradually as datasets expand, business requirements become more complex, and development teams make small design compromises in the interest of speed. The report itself simply becomes the point where those compromises are finally visible.


The organizations that build consistently responsive Power BI environments understand that performance is not achieved through clever DAX alone. It is the result of thoughtful data modelling, efficient query execution, disciplined report design, and continuous monitoring. When these elements work together, performance stops being a recurring problem and becomes a natural outcome of good engineering with optimized power bi report performance.


The real objective, then, is not just to make reports load faster. It is to build an analytics platform that continues to perform reliably as data, users, and business expectations grow. That shift in perspective is what separates temporary optimization from long-term performance engineering.

Ready to Optimize Power BI Performance?

Share this blog on:

Search Blog

About Us

Global Data 365 is composed of highly skilled professionals who specialize in streamlining the data and automate the reporting process through the utilization of various business intelligence tools.

Follow us on:

Still using Jet Basics?

Get Free Upgrade
to Jet Reports

jet services

Subscribe to Our Newsletter

[wpforms id="26968"]

Optimizing Power BI Performance: The Real Causes Behind Slow Reports Read More »

Improving Data Readiness in Dynamics 365 Projects

Improving Data Readiness in Dynamics 365 Projects

Improving Data Readiness for ERP Projects

Improving Data Readiness in Dynamics 365 Projects

Implementing Microsoft Dynamics 365 is often seen as a major step toward digital transformation. Organizations invest significant time and resources into configuring modules, training teams, and planning their go live strategy.


Yet many projects run into unexpected delays or performance issues for a much simpler reason: the data is not ready.


Data readiness rarely gets the same attention as system architecture or integrations, but it plays a central role in whether a Dynamics 365 project succeeds or struggles. When data is inconsistent, incomplete, or stored in incompatible formats, even the most advanced ERP platform cannot deliver the insights and efficiency businesses expect.Preparing data properly before and during implementation can dramatically improve project outcomes and make reporting, analytics and day to day operations far smoother.

What Data Readiness Means in Dynamics 365?

Data readiness goes far beyond simply cleaning up a spreadsheet before importing it into the system.


In the context of Dynamics 365, it involves ensuring that data is structured, consistent, and compatible with the platform and the reporting tools connected to it. This includes having standardized formats across datasets, clear definitions for key fields, and consistent master data such as customers, vendors, products, and financial accounts. Historical data that needs to be migrated should be validated and structured in a way that aligns with Dynamics data models.


Another important element is making sure the data will support reporting and analytics tools like Power BI or Jet Reports. When datasets are properly organized from the beginning, reporting becomes faster and more reliable, which ultimately helps teams make better decisions.


Organizations that approach data readiness strategically often find that their Dynamics implementation runs more smoothly and produces value sooner.

Common Data Challenges During Dynamics 365 Implementations

In many projects, data problems start long before the first migration takes place. Legacy systems, spreadsheets, and manual processes often produce datasets that were never designed to work together.


Companies frequently discover that their data exists in a wide range of formats. Some information may come from older ERP systems, while other datasets are stored in Excel files, CSV exports, XML documents, or even PDF reports. These differences create friction when teams attempt to consolidate and migrate information into Dynamics 365.


Manual reformatting is another common issue. Teams often spend hours adjusting columns, converting formats, or fixing broken structures before files can be imported into the system. This process is time consuming and introduces the risk of human error.


Data silos can also complicate matters. When departments manage their own data independently, inconsistencies appear across the organization. Customer records may differ between sales and finance, product naming conventions may not align, and reporting fields may be structured differently across systems. These issues slow down implementations and create uncertainty around the accuracy of the data that ultimately enters the ERP platform

Why Data Readiness Matters for Reporting and Analytic?

One of the main reasons companies adopt Dynamics 365 is to gain better visibility into their operations. Tools such as Power BI and Jet Reports allow organizations to build dashboards, track performance metrics, and analyze trends across the business.


However, these capabilities depend entirely on the quality and structure of the underlying data. When datasets are inconsistent or poorly formatted, reporting becomes more complicated.


Analysts may spend large amounts of time cleaning or transforming data before it can be used in dashboards. In some cases, key metrics may become unreliable because different departments interpret data fields in different ways. This creates a situation where teams no longer fully trust the reports they rely on to make decisions. By focusing on data readiness early in the implementation process, organizations create a solid foundation for analytics.


Structured and standardized datasets allow reporting tools to function as intended, making it easier to generate insights and monitor business performance

A Practical Approach to Improving Data Readines

Improving data readiness does not require a massive overhaul of existing systems. In many cases, it begins with a structured approach to understanding and preparing the data that will enter Dynamics 365.


The first step is auditing existing data sources. This means identifying where key datasets currently live, what formats they use, and how they relate to each other. During this stage, teams can also detect duplicates, missing values, and inconsistencies that need to be addressed.


Next comes standardizing data formats. Organizations should define clear guidelines for how information such as dates, currencies, naming conventions, and identifiers are structured.


Consistent formatting makes it much easier to import and manage data within Dynamics.


Automation can also play an important role in improving efficiency. Instead of manually adjusting files every time they need to be imported or shared, teams can use tools that quickly convert data into compatible formats.


Solutions such as convert.fast help transform files between formats in seconds, which reduces the manual effort often associated with preparing data for ERP systems.

Before performing full migrations, it is important to validate the data in a test environment. Importing datasets into a sandbox version of Dynamics allows teams to confirm that structures and relationships work as expected.


This step can prevent many of the issues that typically appear during large scale migrations.


Finally, data preparation should be aligned with reporting requirements. If dashboards and analytics are part of the implementation strategy, the data structures should support those use cases from the beginning.

The Role of File Conversion in Data Preparation

File conversion websites like Convert Fast may seem like a small operational detail, but it often plays a surprisingly large role in data readiness.

In many Dynamics projects, data arrives from multiple sources and in different formats. Teams may receive CSV exports from legacy systems, Excel files from finance departments, XML data from integrations, or PDF reports that need to be transformed into structured datasets.

Converting these files manually is not only time consuming but also prone to errors. Even small formatting differences can cause import failures or produce incorrect data relationships within the system.

Using reliable file conversion tools can significantly reduce this friction. When files can be converted quickly and accurately, teams spend less time preparing data and more time focusing on analysis, reporting, and system optimization.

This seemingly simple improvement can help streamline migration processes and keep implementation timelines on track.

The Benefits of High Data Readiness

Organizations that invest time in preparing their data properly often see clear advantages throughout their Dynamics 365 projects.

Implementations tend to move faster because fewer issues appear during migration. Data imports run more smoothly, and teams spend less time troubleshooting formatting errors.

Users also adopt the system more quickly when they trust the data they see. Accurate customer records, product information, and financial data make it easier for employees to rely on the platform in their daily work.

Reporting and analytics become far more powerful as well. Clean and structured datasets allow dashboards to deliver insights that are both timely and reliable. This improves decision making across finance, operations, and management teams.

Over time, these improvements reduce maintenance efforts and help organizations get more value from their ERP investment. Data First, System Second Technology plays an important role in digital transformation, but it cannot compensate for unprepared data. Even the most advanced ERP platform depends on accurate and well structured information to perform effectively.

Dynamics 365 offers powerful capabilities for operations, reporting, and analytics. When organizations prioritize data readiness, they create the conditions needed for those capabilities to deliver real business value.

Companies that approach implementation with a data first mindset often experience smoother projects, stronger reporting, and a faster return on their technology investment.

From Data Preparation to ERP Success. Connect with us.

Share this blog on:

Search Blog

About Us

Global Data 365 is composed of highly skilled professionals who specialize in streamlining the data and automate the reporting process through the utilization of various business intelligence tools.

Follow us on:

Struggling with complex reports?

Power BI makes it simple!

Industry dashboards

Subscribe to Our Newsletter

[wpforms id="26968"]

Improving Data Readiness in Dynamics 365 Projects Read More »