Jet Reports for Growing Businesses
Jet Reports for Growing Businesses
- Global Data 365
Growing businesses face unique and complex challenges, particularly when it comes to financial reporting. As companies expand, so does the volume of data they need to manage. Many rely on manual data handling, spreadsheets, or outdated reporting systems, which not only slow down processes but also increase the risk of errors. Inaccurate data or delays in reporting can prevent business leaders from making timely, strategic decisions. Effective and efficient reporting is the foundation of strong financial management and plays a vital role in the growth and sustainability of a business. Accurate, timely reports allow companies to analyze performance, manage cash flow, and forecast future opportunities or risks. However, traditional reporting tools and methods often fail to meet the needs of growing businesses. This is where Jet Reports stands out as a robust solution built specifically for Microsoft Dynamics ERP users. Growing businesses need more than numbers — they need real-time insights. That’s the power of Jet Reports for business.
How Jet Reports for Business Empowers Growing Companies?
In this blog, we will explore the top 5 reasons why Jet Reports is built for growing businesses and how it helps overcome common financial reporting challenges:
1. Faster Report Generation
In the fast-paced world of business, speed is critical particularly in financial reporting. Businesses need quick access to data that’s accurate and actionable to make informed decisions. The faster a report can be generated, the sooner a company can respond to market trends, internal challenges, or financial changes.
Jet Reports excels in enabling quick report generation by leveraging real-time connections to Microsoft Dynamics 365 and other ERP systems. This direct integration eliminates the need for manual data exports, data cleansing, and repetitive tasks. Reports that once took hours or even days to compile can now be generated in a matter of minutes, streamlining the decision-making process and giving businesses a competitive edge.
- Benefits:
Quick Report Compilation: Generate detailed reports within minutes rather than hours or days.
Real-time Decision Making: Immediate access to updated data allows for faster business responses.
Reduced Manual Errors: Automation minimizes human error caused by manual data handling.
Increased Productivity: Employees spend less time creating reports and more time analyzing insights.
On-Demand Reporting: Pull reports whenever needed without waiting for scheduled batch updates.
- Comparison with Traditional Methods: Traditional reporting methods are time-consuming and prone to errors; Jet Reports automates these processes, drastically reducing the time needed to compile accurate reports.
- Example:
A retail chain previously spent 2-3 days compiling monthly sales reports manually. After implementing Jet Reports, they could produce complete, real-time sales reports within 30 minutes, allowing management to launch timely promotional campaigns and adjust inventory strategies dynamically.
2. Enhanced Security
As companies grow, data security becomes an increasingly important concern, especially when handling sensitive financial information. The risk associated with data breaches, unauthorized access, and data corruption can have devastating consequences, including financial losses and damage to a company’s reputation.
Jet Reports is built with robust security features, including data encryption and strict compliance with industry standards. This level of protection ensures that sensitive financial data remains secure, mitigating the risks of data breaches or unauthorized access. For businesses managing high volumes of financial information, these features are invaluable in maintaining compliance and safeguarding critical data.
Moreover, as financial data flows through various departments and systems, maintaining data integrity is essential. Jet Reports’ built-in security measures ensure that only authorized personnel have access to specific data sets, further enhancing security and reducing the chances of internal data leaks or misuse.
- Benefits:
- Role-Based Access Control: Only authorized users can view or manipulate specific datasets.
- Data Encryption: Jet Reports uses high-level encryption protocols to protect sensitive data from unauthorized access or breaches.
- Compliance Standards: Adhering to SOC 2 and other relevant compliance regulations ensures that your business remains in good standing with industry standards.
- Audit Trail Capabilities: Monitor who accessed what data and when, ensuring accountability.
- Minimized Risk of Internal Leaks: Restricts sensitive reports to designated personnel only.
- Example:
A financial services firm needed to ensure that only senior accountants could access profit and loss statements. Using Jet Reports’ role-based access features, they easily restricted access by user roles, dramatically reducing the risk of unauthorized financial disclosures.
3. Real-time Data Accessibility
In an increasingly competitive business landscape, the ability to access real-time data is a game-changer. For growing businesses, having up-to-date financial information readily available enables more agile decision-making and more accurate performance assessments.
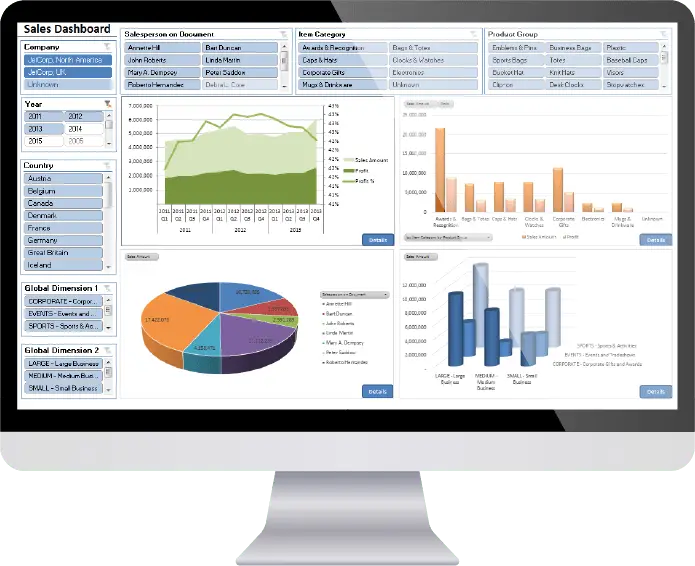
Jet Reports connects directly to ERP systems like Microsoft Dynamics, providing immediate access to the latest financial data. This eliminates the need for frequent manual data refreshes or reconciliations, which can lead to discrepancies or delays. Instead, business leaders can monitor KPIs such as revenue, expenses, and cash flow in real time, making it easier to spot potential issues before they escalate.
Having real-time insights is particularly crucial for industries that are dynamic and fast-changing. For instance, retail businesses with fluctuating inventory levels need to monitor stock movement, sales performance, and customer demand closely. With Jet Reports, they can immediately generate reports that reflect the latest data, allowing them to make proactive decisions about restocking, promotions, or pricing.
- Benefits:
- Instant Insights: Real-time data enables quicker, more accurate decisions that can have an immediate impact on operations or financial performance.
Increased Accuracy: Reduces discrepancies caused by outdated data exports.
Proactive Issue Resolution: Identify and address risks before they escalate.
Better Resource Management: Quickly allocate budgets or staff based on the latest financial standing.
- Impact on Business Operations: In scenarios like cash flow management or inventory tracking, having access to real-time data can be the difference between identifying a minor issue and facing a major financial problem.
- Example:
A wholesale distributor used real-time inventory reports generated through Jet Reports to manage their stock levels daily. This allowed them to optimize reordering processes and reduce overstock issues by 40%, improving cash flow management significantly.
4. Reduced Dependence on IT
One of the biggest advantages of Jet Reports for growing businesses is its ability to significantly reduce dependence on IT. In many organizations, finance teams rely heavily on IT departments to pull data from ERP systems, troubleshoot issues, or generate custom reports. This dependency not only slows down reporting but also puts a strain on IT resources.
Jet Reports, easy-to-use interface and direct integration with ERP systems empower finance professionals to manage reporting tasks independently. This allows businesses to operate more efficiently by freeing up IT teams to focus on higher-level projects and reducing bottlenecks in the reporting process.
- Benefits:
Self-Service Reporting: Finance users create reports themselves without waiting for IT assistance.
Faster Report Turnaround: Cut delays caused by IT backlogs and prioritizations.
Reduced IT Bottlenecks: By lowering dependence on IT for report generation, businesses can streamline their workflows and enable IT teams to focus on more strategic tasks.
Greater Agility: Finance teams can adjust and tweak reports on the fly as business needs evolve.
Cost Savings: Reduces overhead by minimizing the need for dedicated reporting IT staff.
- Example:
A mid-sized manufacturing company saved over 150 hours per quarter previously spent coordinating with IT for financial reporting. After adopting Jet Reports, their finance team could generate, customize, and analyze reports independently, allowing IT to redirect focus toward a major ERP upgrade project.
5. Ease of Use
One of key challenges for growing businesses is adopting new tools and systems without disrupting daily operations. Jet Reports is specifically designed to be user-friendly, making it accessible to non-technical users. Its intuitive interface ensures that finance teams can generate and customize reports without needing extensive training or relying on IT support.
This user-friendly design not only empowers finance teams but also reduces the strain on IT departments, which can focus on more strategic initiatives rather than being bogged down with report requests. Jet Reports comes with pre-built templates that users can easily customize, allowing for faster report generation and minimal time spent learning the system.
Additionally, the quick learning curve reduces the need for extensive training, making it easier for new hires or less-experienced team members to adapt quickly.
- Benefits:
Minimal Learning Curve: Most finance professionals can master it within a few sessions.
Pre-built Templates: Quickly generate essential 100+ financial reports samples without starting from scratch.
Drag-and-Drop Functionality: Simplifies report customization even for non-technical users.
Excel-Based Interface: Familiar environment reduces training needs.
Increased User Adoption Rates: Ensures company-wide buy-in and consistent usage.
- Example:
A growing tech startup with no dedicated reporting department needed quick reporting capabilities. Jet Reports’ Excel-based environment meant that their CFO and junior analysts were building complex financial reports within just a week of implementation, driving faster insights without hiring additional reporting staff.
In Conclusion
For growing businesses, having a powerful, scalable, and user-friendly financial reporting tool is critical. Jet Reports provides the speed, security, real-time insights, ease of use, seamless Power BI integration, and reduced IT dependence that businesses need to thrive. As companies scale, Jet Reports grows with them, ensuring that their reporting remains efficient and accurate.
If your business is looking for a reporting solution that can keep pace with your growth, contact us today to explore Jet Reports and see how it can help drive your success.
Grow your business with Jet Reports Today!
Search Blog
Related Resources

Jet Reports AI Assistant

Power BI vs. Jet Reports: 11 Key Differences