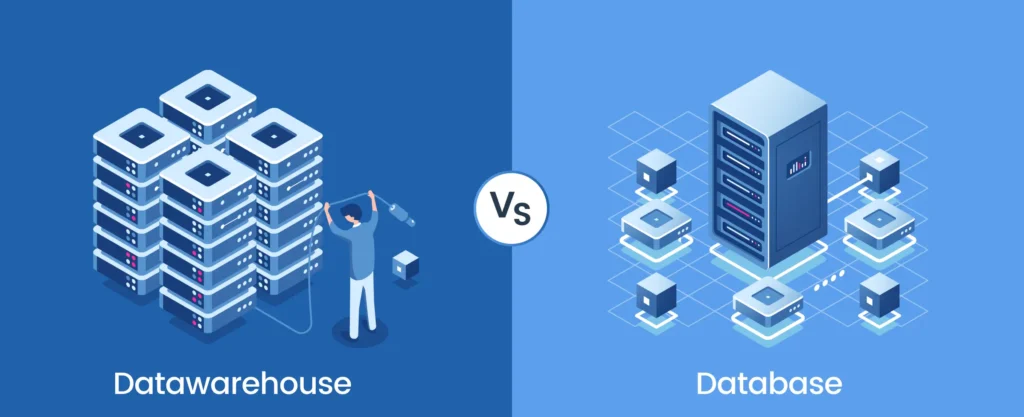
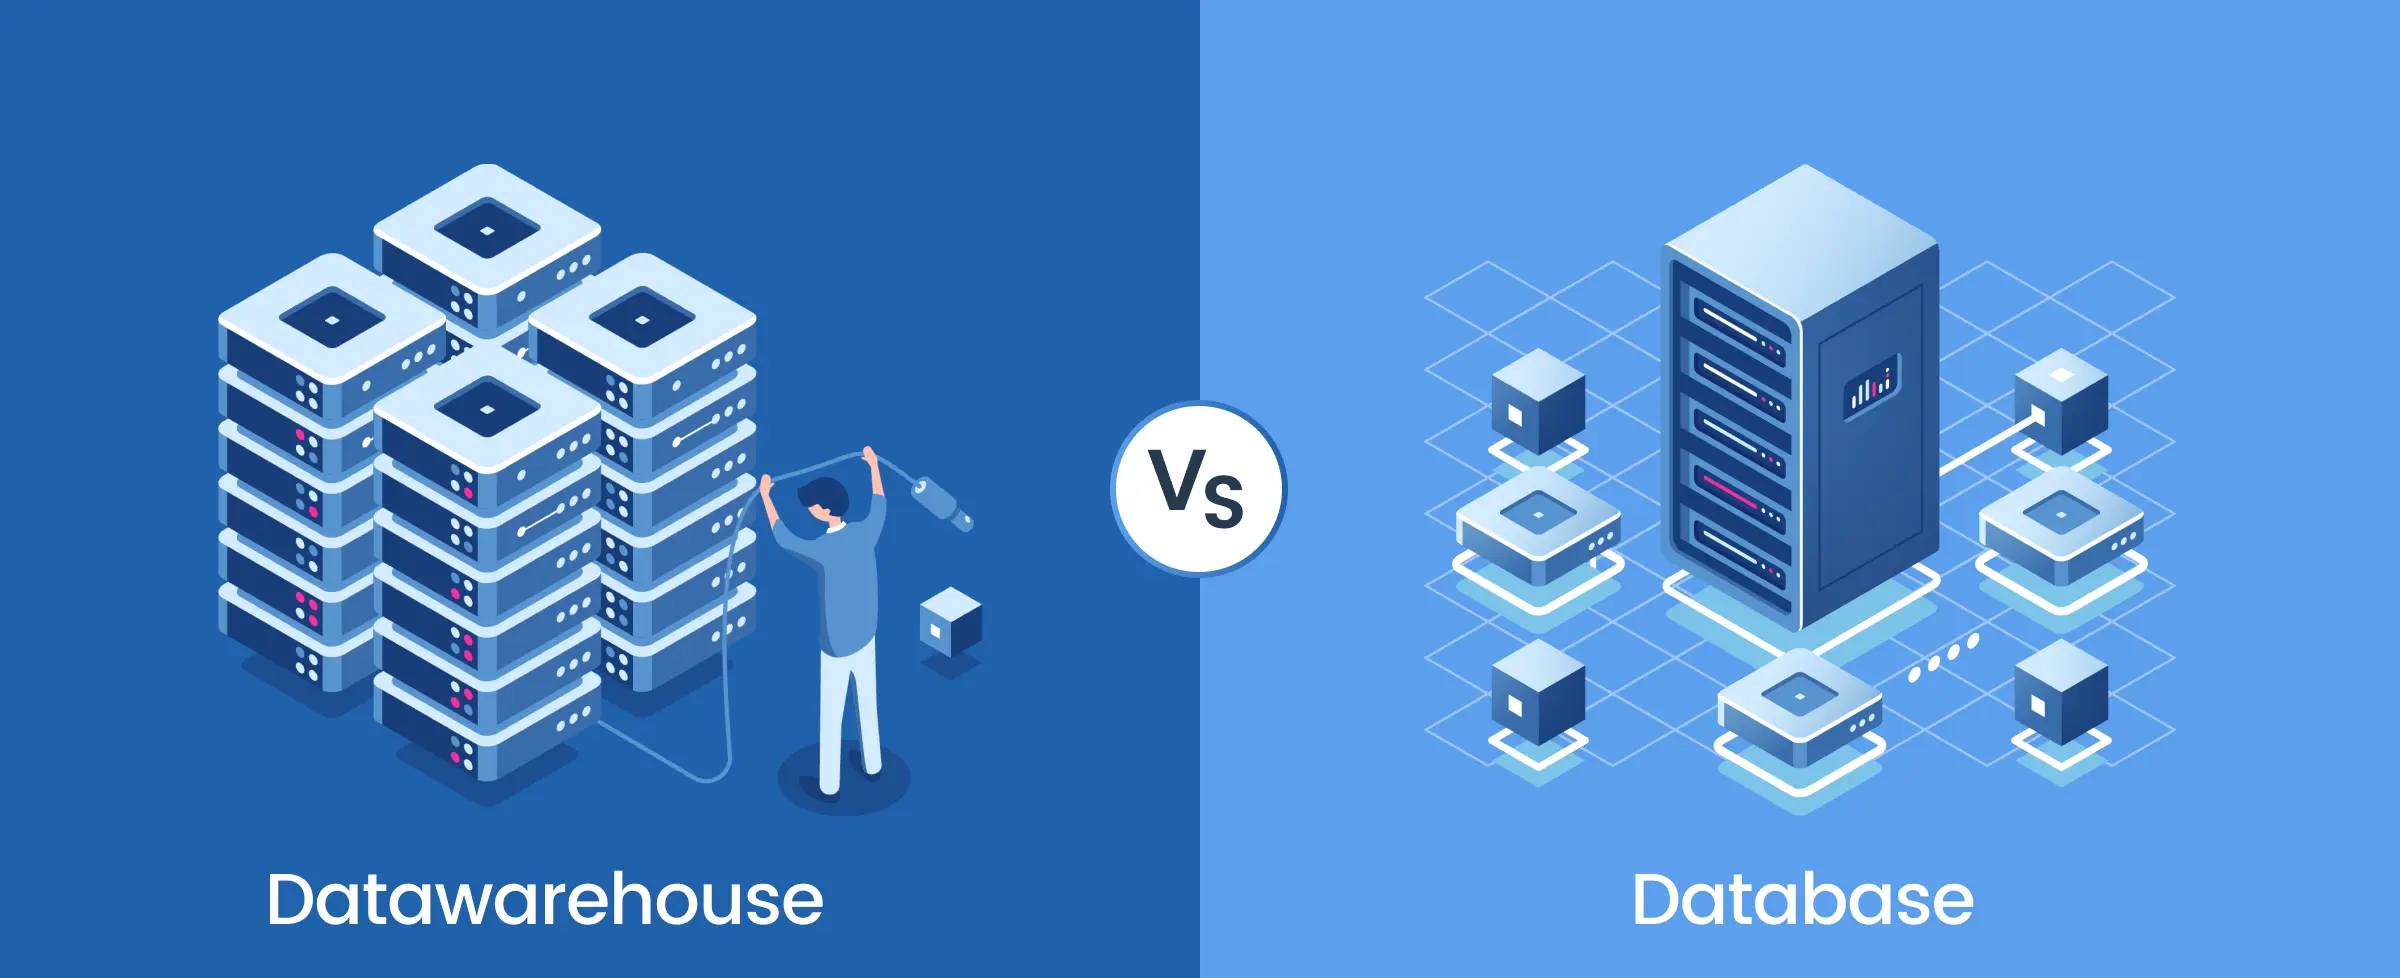
Datawarehouse vs. Database: 12 key differences
The Difference between Database and Data Warehouse
- Global Data 365
For corporations of all sizes and sectors, the world of Big Data keeps expanding. The performance and profitability of any business rely mainly on the volume, consistency, and reports of the information they gather. However, the real challenge lies in how companies analyze, gain input from, and take action on the collected data. Understanding the difference between database and data warehouse is crucial in this process, as each plays a distinct role. The ability to distinguish between database vs data warehouse can significantly impact how effectively raw data is transformed into valuable insights.
It requires organizations to learn the practice of corporate data management so that workers can effectively produce, archive, view, handle and interpret the data they need to succeed at their work. So, when it comes to gathering, storing, and analyzing data, what could prove to be the right decision for your company? The most common types of data storage in enterprise data management are databases and data warehouses. So what is the difference between a database and data warehouse, and which one is the right choice for your company?
What is a Database?
A database is a digital system used for storing, managing, and retrieving data in a structured format. It acts as a centralized repository where information can be organized into tables, making it easy to access and manipulate. Databases are essential in various applications, from small-scale software solutions to large enterprise systems, and they support a wide range of data types, including text, numbers, and multimedia.
In essence, databases form the backbone of modern information systems, supporting activities in sectors like finance, healthcare, retail, and more. They enable businesses to harness their data for decision-making, reporting, and operational efficiency, thereby driving growth and innovation.
What is a Data Warehouse?
A Data Warehouse can be defined as a system that collects and stores data from several diverse resources within an enterprise. In comparison to a database, a data warehouse’s infrastructure is designed to get the data out, and not just by technical tools, but for regular users like finance professionals, executives, management, and other workers.
The objective of a data warehouse is specifically business-oriented: it is intended to promote decision-making by enabling end-users to consolidate and interpret data from multiple sources. Being the basis for BI and analytics, it takes out information from existing databases, defines a series of rules to convert the data, and then transferring it into a single central repository to view and manage easily.
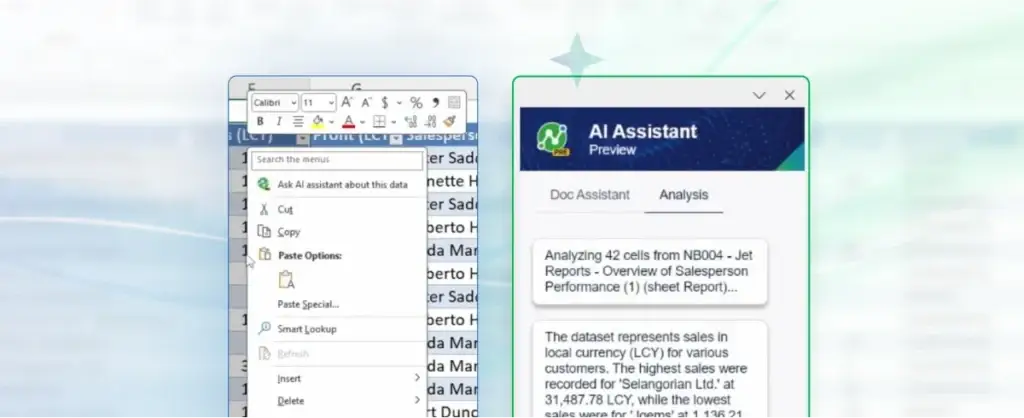
A data warehouse stores information of the transfer level and supports the larger reporting and analytical needs of an organization, providing one basis of reality for building semantic models or the provision of organized, simplified, and aligned data for tools, such as Excel, Power BI, or even SSRS. Companies that have a higher level of data or analytical needs tend to use a data warehouse.
Key Differences: Database vs Data Warehouse
With more volume and complexity of data used in the organizations, they want to receive more analytical insight, which is why data warehouses are receiving more visibility for database reporting and analytics. The key distinctions of database vs data warehouse is that databases contain accumulated data that are organized. Whereas data warehouses are data systems constructed from various information sources, as they are used to analyze information.
Data Type
- Database: Contains detailed transactional data.
- Data Warehouse: Stores summarized, aggregated, and historical data.
Purpose
- Database: Used for real-time transaction processing, storing current data for operational tasks.
- Data Warehouse: Optimized for large-scale analytical queries and historical data analysis.
Data Structure
- Database: Optimized for read/write operations (OLTP – Online Transaction Processing).
- Data Warehouse: Optimized for read-heavy operations (OLAP – Online Analytical Processing).
Users
- Database: Primarily used by operational staff (e.g., clerks, IT staff).
- Data Warehouse: Mainly used by business analysts, data scientists, and decision-makers.
Data Volume
- Database: Holds less data, focused on current transactions.
- Data Warehouse: Handles large volumes of historical data from multiple sources.
Performance
- Database: High performance for inserting, updating, and deleting transactional records in real-time.
- Data Warehouse: High performance for complex queries and large-scale data retrieval.
Schema Design
- Database: Normalized schema (e.g., third normal form) to ensure data integrity.
- Data Warehouse: Denormalized schema (e.g., star or snowflake schema) for faster query performance.
Data Processing
- Database: Processes a large number of small transactions.
- Data Warehouse: Processes complex queries requiring significant data aggregation.
Concurrency
- Database: Supports multiple users. Data Warehouse: Supports a lower number of users.
Storage Cost
- Database: Typically cheaper per unit of data.
- Data Warehouse: Higher storage costs due to large datasets and complex processing.
Data Source
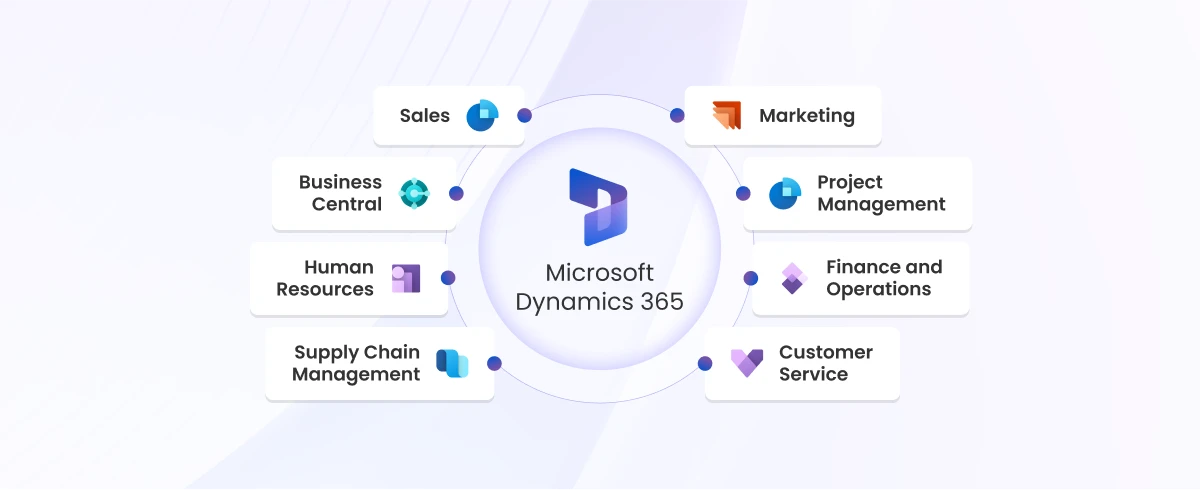
- Database: Captures current data from operational systems like CRM, ERP, and other applications.
- Data Warehouse: Aggregates data from multiple sources, including databases, external systems, and log files.
Example Use Cases
- Database: E-commerce transactions, banking systems, inventory management.
- Data Warehouse: Business intelligence reporting, trend analysis, forecasting.
|
Features |
Database |
Data Warehouse |
|
Purpose
|
Used for real-time transaction processing, storing current data for operational tasks. |
Optimized for large-scale analytical queries, storing historical data for reporting and analysis. |
|
Data Type
|
Contains detailed, transactional data. |
Stores summarized, aggregated, and historical data. |
|
Data Structure |
Optimized for read/write operations (OLTP – Online Transaction Processing). |
Optimized for read-heavy operations (OLAP – Online Analytical Processing). |
|
Users
|
Primarily used by operational staff (e.g., clerks, IT staff). |
Mainly used by business analysts, data scientists, and decision-makers for insights and reporting. |
|
Data Volume |
Holds less data, focused on current transactions. |
Handles large volumes of historical data from various sources. |
|
Performance
|
High performance for inserting, updating, and deleting transactional records in real-time. |
High performance for complex queries and large-scale data retrieval for analysis. |
|
Schema Design |
Normalized schema (e.g., third normal form) to eliminate redundancy and ensure data integrity. |
Denormalized schema (e.g., star or snowflake schema) for faster query performance. |
|
Data Processing
|
Processes a large number of small transactions. |
Processes complex queries requiring significant data aggregation. |
|
Concurrency |
Supports multiple users.
|
Supports a lower number of users. |
|
Storage Cost
|
Typically cheaper per unit of data.
|
Higher storage costs due to large datasets and complex processing requirements.
|
|
Example Use Cases
|
E-commerce transactions, banking systems, inventory management. |
Business intelligence reporting, trend analysis, forecasting, decision support. |
|
Data Source |
Captures current data from operational systems like CRM, ERP, and other applications. |
Aggregates data from multiple sources, including databases, external systems, and log files. |
Importance of Databases and Data Warehouses for Businesses
Companies can reap the benefits of both database and data warehouse for reporting and analysis in different ways. Let’s see why:
- Data Quality and Accuracy
Data warehouse includes transferring information from different sources, standardising it, naming it, arranging it, and making sure the uniform restrictions are sorted and labelled. This ensures better confidence in the information being displayed, minimizes organizational errors, and gives better possibilities for partnership as independent business sectors like sales, marketing, and finance all depend on similar reporting from the data repository.
- Power Business Intelligence
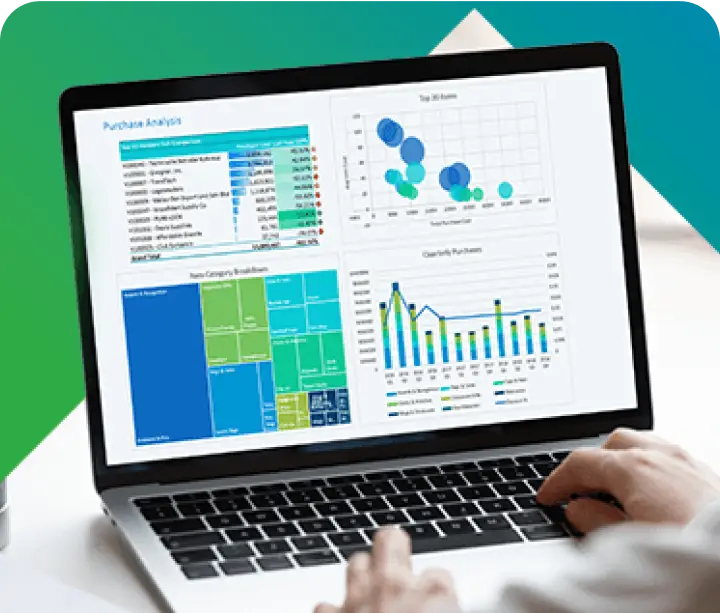
One of the greatest advantages of data warehousing is the rising scope and efficiency of data storage. By optimizing access to the data of your organization, you are strengthening the leadership’s willingness to adopt a smarter plan centered on a more complete and effective solution. Data warehouse-powered business intelligence provides deeper insight into sales operation, financial stability, and much more.
- Increased ROI
The use of data warehousing helps organizations to save money on their analytics, and as a result, a larger amount of profit is generated. As the expense of data warehousing reduces, this effect grows exponentially, and by using BI software and data warehousing in coordination to effectively democratize data and slash headcount in reporting and analytics operations, companies can generate a return on investment faster.
- Improved Efficiency
Data warehouses are designed for speed, in particular to providing large businesses quick access to retrieval and analysis of data. Instead of devoting useful numerical data, data warehouses are all about the ability to edit and maintain specific data records. By making sure that the data can be obtained, collated, and processed as easily as possible, the process of making important business decisions in an instant becomes easier.
Best Way to Build a Data Warehouse
It is popularly known that there are as many ways to create data warehouses as there are companies to develop them. Every data warehouse is special, as it adheres to the requirements of business users in numerous functional areas in which firms face diverse market environments and competitive forces.
- Creating the Staging Area
Before analysis of the data, it goes through the process of retrieval, conversion, and loading of data. As the warehouse is as strong as the data stored within it, for the success of your company it needs to match department requirements and objectives.
- Building an Environment
Usually, data warehouses have three main physical settings: development, testing, and manufacturing. And these three settings will exist on entirely different physical services.
- Data Modelling
Data Modeling is the process of visualizing the distribution of data in your data warehouse. Before constructing a data warehouse, it is important to know where and why data goes. This is why data modelling is used.
- Choosing Your Extract, Transfer, Load Solution
ETL Solution is the process you will use to extract data from your existing storage solution and place it in your warehouse. That is why it is pertinent to carefully choose the right ETL solution for your warehouse.
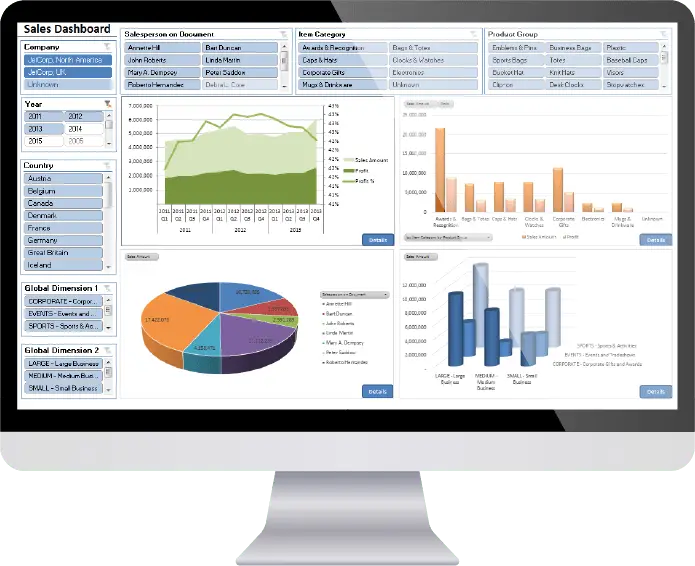
- Create Front-End
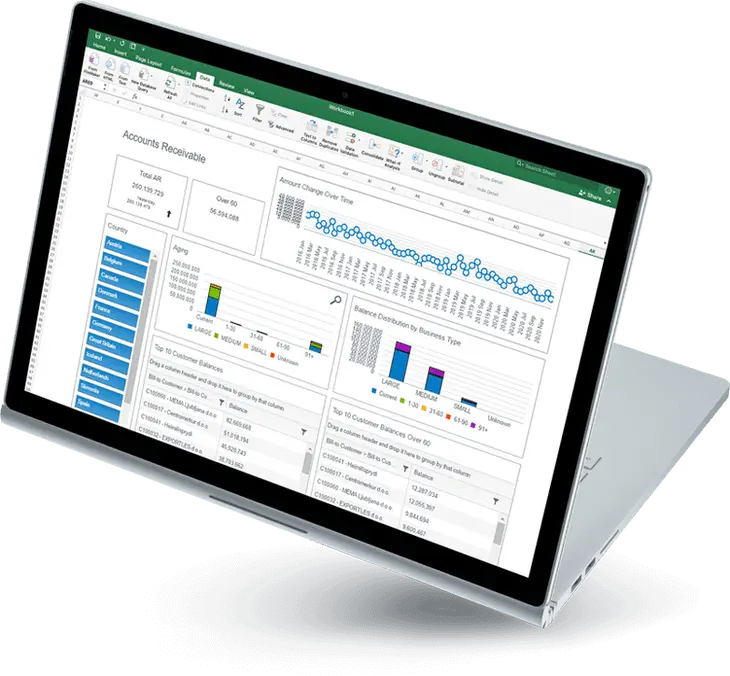
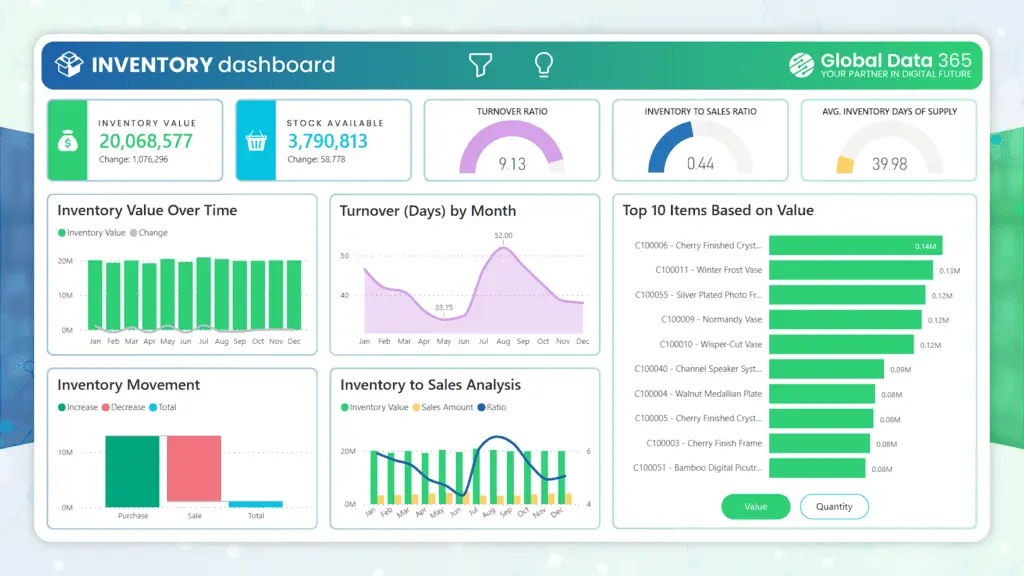
It is important to have front-end visualization, so users can instantly comprehend and utilize the results of data queries. BI tools like Power BI work best for visualization, and you can also customize your own solution.
- Queries Optimized
Having your queries optimized is a complicated process that answers your required needs. Make sure that your manufacturing, testing, and development setting have similar resources to prevent lagging.
In Conclusion
Database and data warehouse serve different functions in practice. If you are contemplating about building your own database vs data warehouse, then it is one indication that the organization is dedicated to the practice of effective corporate data management.
Every company has different needs to build a data warehouse and database, which is why Global Data 365 designed a reporting and BI solution that provides the user with a pre-built data warehouse and cubes set ready to be used. With a wide dashboard library and report templates, Jet Analytics is built to provide you useful insight day one into your results. In the years to come, the accuracy, durability, and usability of data will be the key differentiator for firms of all types. That is why organizations would want to make sure that they are placing themselves up for sustainable growth by selecting the best infrastructure and storage.
To know more about database vs data warehouse and how you can implement it in your business, contact us now.
Talk to Our BI Experts!
Search Blog
Related Resources

What is Data Mart?

Data Lake vs Data Warehouse

What are Data Lakes?
Interact Live with Dashboards
Increase efficiency and deliver success now with Microsoft Power BI. Enjoy a 20% discount on all Power BI services.
Subscribe to Our Newsletter
The Difference between Database and Data Warehouse Read More »