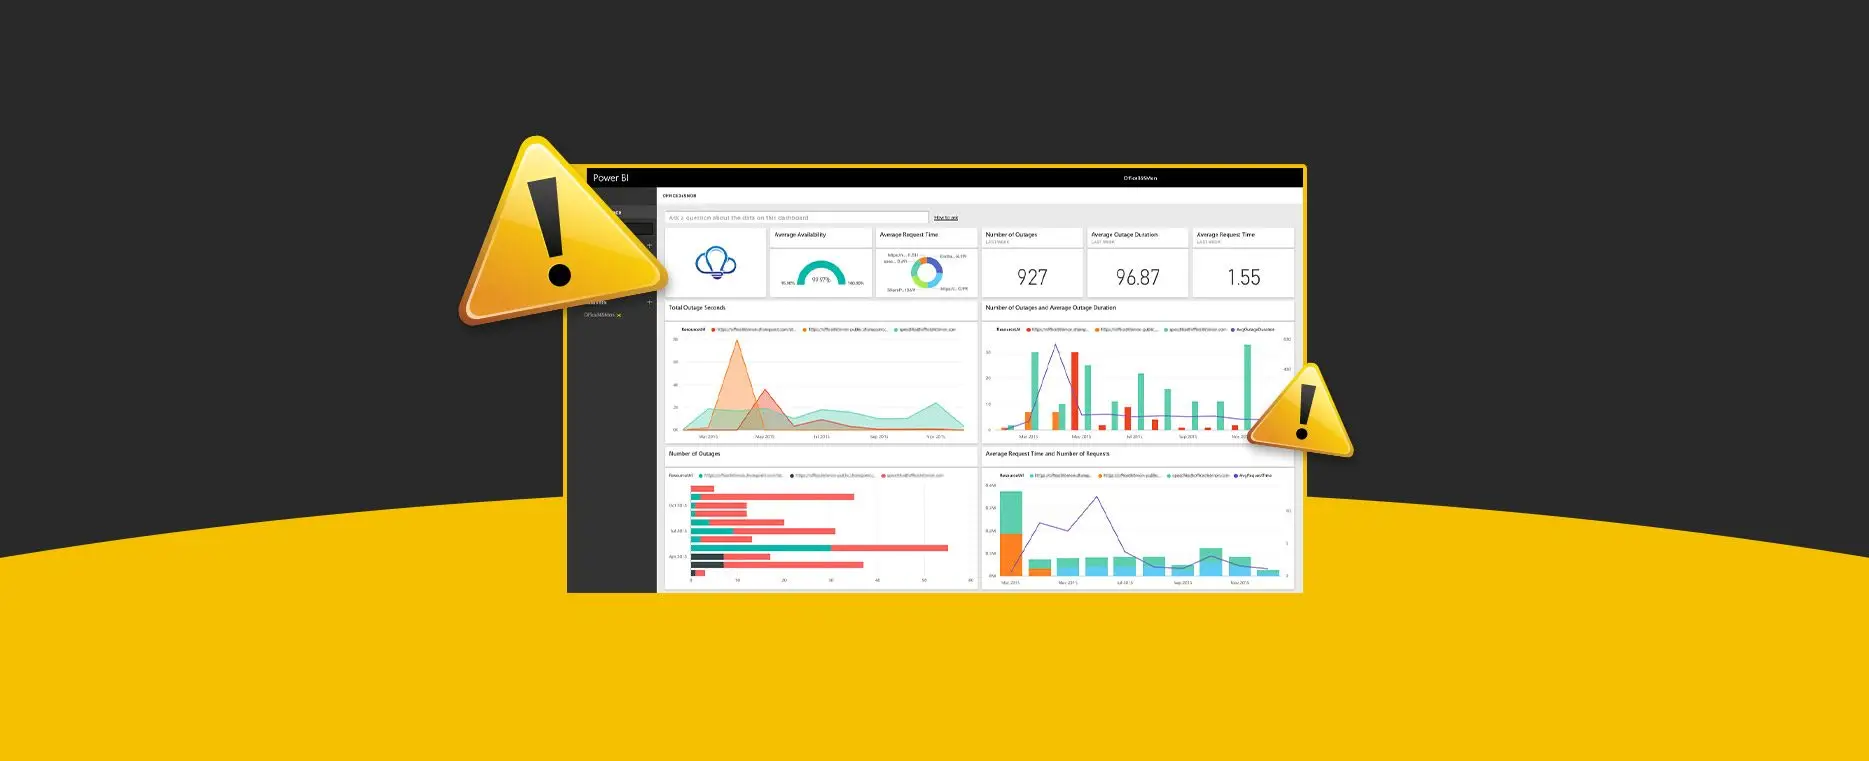
9 Ways you are failing at Business Intelligence(BI)

- Haseeb Tariq
Business intelligence is critical for making strategic business decisions, but often organizations’ BI efforts are hindered by bad data practices, tactical errors, and other factors. Executives understand the importance of having high-quality data when making business decisions. However, obtaining reliable data in a timely and user-friendly format continues to be difficult. Yes, there is a struggling market for business intelligence (BI) analysts and distributors. How can you determine 9 ways you are failing at Business Intelligence and it’s time to update or recruit specialist experts? Knowing where others have gone wrong will help you answer these questions.
Doing What Customers Ask, Instead of What a Company Needs
Surely placing customer satisfaction as the top priority leads a company to success. However, when it comes to technology, business users can not always grasp what they are requesting. Apart from that, they try to impose the solution’s technical information.
BI failure is a result of implementing what consumers want rather than what they need. Successful BI projects necessitate the ability to adequately verify BI findings, and the ability to elaborate and manage requirements. One way of understanding what consumers really need is to use the “5 whys” approach, which involves asking why five times about a single problem to gain greater depth.
Using Less Time and Money for Testing
In the marketing world, thinking about moving fast and breaking things is a common mantra. And well-established companies need pace. However, in the race to go faster, things that are seen as additional services, such as testing, will suffer. Seeing testing as a waste of time may lead to serious quality problems, particularly if manual testing is used. Instead, look to research and related “ancillary” processes to provide a better BI experience.
Limiting testing, particularly when the only testing performed is manual, results in a high number of errors in user testing, which has an impact on product delivery.
Short-Term Broader Data Integrity is Important
Reading, viewing, and analysing data is convenient with business intelligence software. But what if the data you’re providing the system is tainted? Or, to put it this way, how can you show an IT analyst that your management decisions are based on high-quality data? If you concentrate solely on the BI tool and its setup, you can overlook this crucial information.
Taking a Defensive Approach to Unsatisfied Customers
Dealing with irritated users is not something any technology expert looks forward to. There will be system errors and annoying points. Your response to these issues will determine if your BI project succeeds.
The two most common mistakes that BI newcomers make are concentrating all their attention on delivering requests and failing to include business end-users in the project. What matters is, are you providing your customers with the information they require to make decisions? Do you know what information they require? Is there an alternative to making a new report to solve the problem? It’s preferable to prioritize user complaints based on their relative relevance to your overall plan rather than simply dismissing them.
Conducting Analysis with No Purpose
When you have effective resources at your side, it’s only normal to look for ways to use them. Business intelligence without guidance, on the other hand, is a waste of time. This issue is especially prevalent among young professionals.
Inexperienced and eager business intelligence practitioners risk developing tunnel vision and doing interesting research that isn’t motivated by meaningful questions. The findings often lack a ‘so what’ finding and struggle to offer actionable insights. It takes business knowledge and judgement to avoid this blunder. One way to avoid the “so what” dilemma is to ask yourself, “How does this research apply to the company’s goals?”
Thinking Data is Sufficient
Is it possible that “more data” can solve all our business problems? Many aspects of business intelligence and analytics are based on this unspoken presumption. It’s not going to be working to just drop data at an executive and hope for the best.
Data is dismissed or trumped by belief if it isn’t interpreted and argued convincingly. The importance of making a strong case and crafting a compelling narrative can never be underestimated. The field analysts may be aware of the implications of data collection. You can’t presume that those who are a few steps away from the data will understand that argument.
Relying only on BI tools
Technologists understand that the right method will make a huge difference. Consider the first time you used a script to automate a time-consuming process. Those early victories motivate you to keep looking for new ways to solve business problems. Unfortunately, putting too much reliance on your business intelligence tool can lead to disappointing results.
Even if the tools are becoming more user-friendly, there are process, cultural, and learning elements that must be addressed to achieve progress.
Vendor Management is Ineffective
It is possible that your organization doesn’t have a business intelligence department. Working with outside experts makes sense in that situation. You could hire them to act as an outsourced service provider or to help on a particular project. In any case, you must know your vendor and provide oversight, particularly when it comes to subcontractors.
It is your duty to manage the problem and figure out who is working on your behalf if a third party is involved. Otherwise, you might be in for a BI failure.
Dismissing Tools like SQL and Excel
Are you aware that there are Microsoft Excel championships held every year? Take, for example, the Microsoft Office Specialist World Championship, which attracts over 500 thousand participants and offers cash prizes to the winners. That is just one indication of Excel’s growing popularity in the corporate world. SQL has a large following in the technology community but to a lesser extent.
Identify these 9 ways you are failing at Business Intelligence and make a big shift with power of BI in a company with ramifications for employees’ jobs. In leading people through the process, the practice of change management and leadership cannot be overlooked.
If you’re interested in knowing how agile BI solutions can lead your company to success, contact us now, to eliminate these 9 ways you are failing at business intelligence and lead your way to data driven insights.
Talk to Our BI Experts Today!
Search Blog
Related Resources

Why is Building a BI Strategy Important?

Where BI fits into your Data Strategy?

Interact Live with Dashboards
Increase efficiency and deliver success now with Microsoft Power BI. Enjoy a 20% discount on all Power BI services.
Subscribe to Our Newsletter
9 Ways you are failing at Business Intelligence(BI) Read More »