Jet Analytics vs. Microsoft Fabrics: For Business Central
- Global Data 365
As organizations increasingly depend on data to drive smarter decisions, the tools used for data integration, reporting, and business intelligence are more important than ever. For users of Microsoft Dynamics 365 Business Central, two options often come into consideration: Jet Analytics and Microsoft Fabrics. But which one truly aligns with the needs of Business Central users, especially those looking for ease, speed, and clarity in reporting? Find the differences between Jet Analytics vs Microsoft Fabrics to find best fit for business central.
What is Jet Analytics?
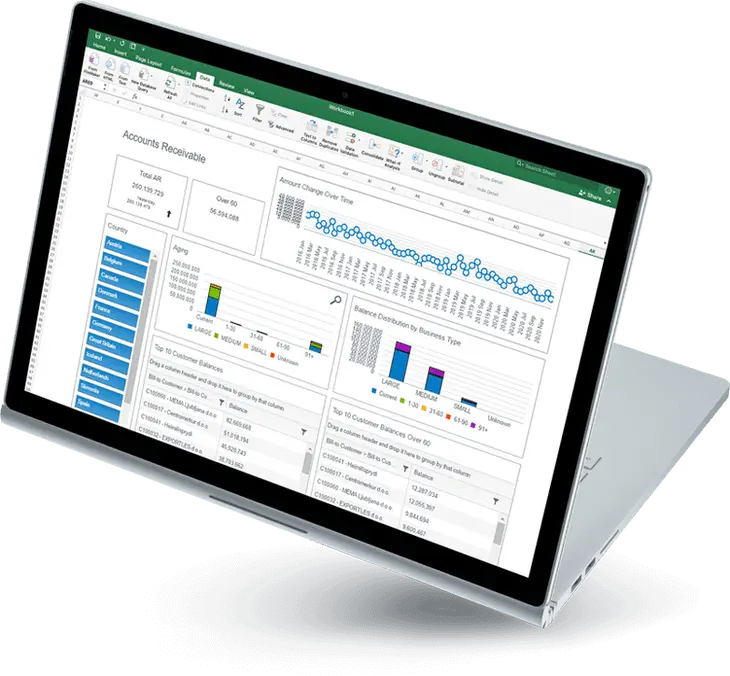
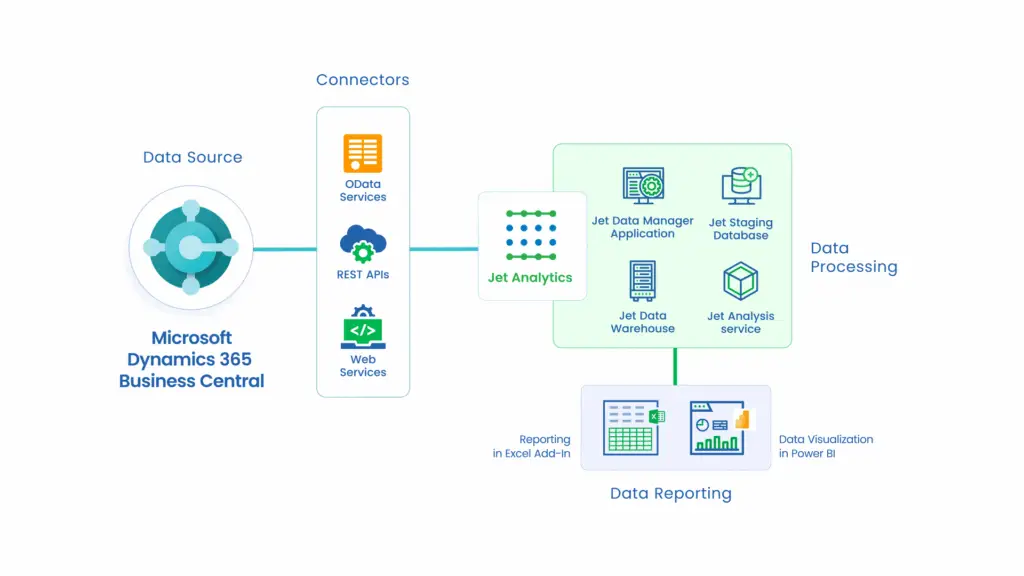
Jet Analytics is a business intelligence solution built specifically for Microsoft Dynamics ERP systems, including Business Central and NAV. It combines pre-built OLAP cubes, a data warehouse, and visual ETL tools in an easy-to-use, Excel-integrated platform. At the core of Jet Analytics is the Jet Data Manager, which automates data extraction, transformation, and loading (ETL) without the need for heavy coding.
Jet Analytics is designed for rapid deployment, self-service reporting, and minimal IT dependency, making it ideal for finance, operations and business teams that want quick access to accurate data.
See how businesses profit from Jet Analytics: IKEA Case Study.
What is Microsoft Fabrics?
Microsoft Fabrics is a new unified analytics platform from Microsoft that brings together data engineering, data integration, data warehousing, data science, and real-time analytics, all within the Power Platform and Azure ecosystem. It allows users to build end-to-end data solutions using tools like Data Factory, Synapse, Spark notebooks, Lakehouses and Power BI.
While powerful, Microsoft Fabric is developer-oriented and designed to support large-scale, complex data environments. It requires strong technical skills and an in-depth understanding of multiple tools across Azure and Power Platform.
10 Key Differences for Business Central Users: Jet Analytics vs. Microsoft Fabrics
Now, let’s compare how Jet Analytics and Microsoft Fabrics differ in real-world scenarios for Business Central users.
| Feature | Jet Analytics | Microsoft Fabrics |
|---|---|---|
| Business Central Integration | Native, pre-built cubes and dimensions | Manual setup required |
| Tabular Cube Support | Out-of-the-box cubes for BC | Custom modeling via datasets |
| Data Warehouse Creation | Automated with Jet Data Manager | Manual via pipelines & lakehouses |
| Ease of Use | Built for business users, Excel-friendly | Developer-centric, steeper learning curve |
| Deployment Time | 1–2 weeks | 3–6 weeks or more |
| ETL Tool | Drag-and-drop visual ETL | Code-heavy tools (Data Factory, notebooks) |
| Licensing & Cost | Simple, fixed licensing | Usage-based, potentially unpredictable |
| On-Premise Capability | Available | Cloud-only |
| User Training & Support | Guided onboarding, strong partner ecosystem | Self-service or paid consulting required |
| Time-to-Insights | Fast, business-ready out of the box | Slower setup and modeling process |
1. Seamless Integration with Business Central
Integration is one of the most important aspects when selecting a BI solution. Business Central users need tools that understand their data model, business rules, and dimensions—without requiring complex setup or custom mapping.
- Jet Analytics:
Jet Analytics provides deep, native integration with Business Central. It comes with pre-built cubes and ETL processes tailored specifically for BC data structures, enabling users to start generating reports quickly with minimal configuration.
- Microsoft Fabrics:
Fabrics requires manual configuration of pipelines or Power BI dataflows to connect with Business Central. This adds time, complexity, and potential for errors during integration.
2. Built-In Tabular Cube Support
Cubes provide structured, high-performance analytics for users needing fast, slice-and-dice reporting capabilities. The ease with which these cubes can be created and maintained is vital.
- Jet Analytics:
Jet Analytics includes built-in tabular cubes with drag-and-drop measures and KPIs. These cubes are pre-configured for business users and offer seamless integration with Excel and Power BI.
- Microsoft Fabrics:
Microsoft Fabrics supports tabular models through Power BI datasets, but requires custom modeling. Business Central users must build these datasets from scratch, increasing setup time and reliance on technical staff.
3. Automated Data Warehouse Creation
A robust BI solution must include a flexible and scalable data warehouse. Automating the creation and maintenance of this warehouse saves time and reduces the need for ongoing developer involvement.
- Jet Analytics:
Jet Analytics uses Jet Data Manager to automate data warehouse creation, manage historical data, and simplify maintenance. It eliminates the need for writing custom scripts or managing complex infrastructure.
- Microsoft Fabrics:
Microsoft Fabrics requires setting up data pipelines, lakehouses, and notebooks, which are typically suited for data engineers and not business analysts. The manual nature of these components increases implementation complexity.
4. Ease of Use for Business Users
An analytics platform is only valuable if the people who need insights can use it effectively. For many organizations, business users—not developers—are the primary consumers of data.
- Jet Analytics:
It is built for non-technical users, with a familiar Excel-integrated experience that reduces training time and increases adoption. Users can build and modify reports without relying on IT.
- Microsoft Fabrics:
Fabric is designed for technical professionals. It requires a solid understanding of Power Query, DAX, or Python, which limits its accessibility to business users.
5. Faster Deployment Time
Time-to-value is a critical factor when implementing analytics. The longer it takes to get up and running, the longer the organization waits for actionable insights.
- Jet Analytics:
With ready-made templates and native Business Central integration, Jet Analytics can be deployed in as little as 1–2 weeks.
- Microsoft Fabrics:
Because Fabric relies on custom development, pipeline configuration, and modeling from scratch, it usually takes 3–6 weeks or longer to get operational.
6. Visual ETL Tools
Transforming raw data into meaningful information should not require coding expertise. A visual ETL tool accelerates development and empowers non-developers to manage their data flows.
- Jet Analytics:
Jet Data Manager includes a visual drag-and-drop interface for ETL/ELT processes, allowing users to manage transformations, lookups, historical tracking, and data cleansing without writing code. This simplifies data preparation and empowers business analysts to control their own pipelines.
- Microsoft Fabrics:
Fabric requires the use of Azure Data Factory, Spark notebooks, or other developer-centric tools to build data pipelines. These tools offer flexibility but demand significant technical skills, making it unsuitable for business users or smaller teams lacking full-time data engineers.
7. Licensing & Cost
Understanding the licensing model is crucial for budgeting and long-term planning. Solutions that include everything under a single license often result in a lower total cost of ownership.
- Jet Analytics:
Jet Analytics provides a single license that covers Jet Data Manager, Jet Reports, and pre-built cubes, eliminating the need for multiple Azure services or unexpected usage-based costs. This makes budgeting and deployment more straightforward.
- Microsoft Fabrics:
Fabrics uses a capacity-based pricing model based on data storage, compute usage, and Azure services. This model can lead to unpredictable costs as data volumes or usage grow—especially for organizations with frequent report refreshes or large datasets.
8. Offline / On-Premise Capability
Not all businesses are ready to move fully to the cloud. Industries with data sovereignty concerns or specific IT policies may require hybrid or fully on-premise options.
- Jet Analytics:
Jet Analytics can be deployed on-premise, in a private cloud, or in the public cloud—giving organizations full control over their infrastructure based on compliance and security needs.
- Microsoft Fabrics:
Fabric is a cloud-native platform and does not support offline or on-prem deployments. This limits its suitability for businesses with strict data governance policies or disconnected environments.
9. User Training & Support
No matter how advanced a tool is, effective onboarding and support can make or break the success of an implementation—especially for non-technical users.
- Jet Analytics:
Jet Analytics offers partner-led training, user onboarding, and dedicated support to help organizations quickly realize value from their investment. The learning curve is short due to the Excel-based interface and pre-built assets.
- Microsoft Fabrics:
Fabric requires learning multiple components across Power BI, Azure Synapse, Data Factory, and more, making it challenging for new users. Support is generally limited to Microsoft documentation unless organizations invest in additional consulting or partner services.
10. Time-to-Insights & Business Value Delivery
Ultimately, the goal of any analytics solution is to deliver actionable insights quickly. The faster stakeholders get access to trustworthy data, the quicker they can make decisions that drive growth.
- Jet Analytics:
With pre-built cubes tailored for Business Central, intuitive visual tools, and Excel integration, Jet Analytics enables organizations to start analyzing within days—not weeks or months. Reports, dashboards, and KPIs are available out of the box, which accelerates ROI and ensures rapid business value.
- Microsoft Fabrics:
Fabric requires setting up multiple components (e.g., Data Factory, Lakehouse, Power BI datasets), coding data transformations, and building everything from scratch. This can result in weeks or even months before usable insights are available, especially for organizations without an in-house data team.
In Conclusion
While Microsoft Fabrics is a powerful analytics platform, it’s designed with data engineers and developers in mind. Business Central users looking for a solution that delivers fast time-to-value, ease of use, and built-in integration will find Jet Analytics to be the more practical, scalable, and cost-effective choice.
With its automated data warehouse, visual ETL, Excel-friendly experience, and faster deployment, Jet Analytics empowers business users to take control of their data—without the technical complexity of Microsoft Fabrics.
Simplify you Business Central Reporting with Jet Analytics!
Search Blog
Related Resources

Jet Reports AI Assistant

Power BI vs. Jet Reports: 11 Key Differences

Power BI with Jet Analytics
Subscribe to Our Newsletter
Jet Analytics vs. Microsoft Fabrics: Which One Fits Business Central Best? Read More »