Data Analysis

what is data pipeline

What is Data Pipeline?

what is data pipeline

In today’s data-driven world, businesses generate massive amounts of information every second. Managing this data efficiently is crucial for making informed decisions, improving operations, and gaining a competitive edge. This is where data pipeline comes into play. A data pipeline is a structured process that automates the flow of data from various sources to a destination—be it a data warehouse, analytics tool, or real-time dashboard. By ensuring smooth data movement, transformation, and integration, data pipelines help organizations maintain data accuracy, consistency, and accessibility, forming the backbone of modern data management strategies.

What is Data Pipeline?

Data Pipeline is a method employed to process unrefined data from diverse origins, refine it, and then deposit it into a data repository like a data lake or data warehouse for scrutiny. 


Preceding its storage, data typically undergoes processing such as filtering, masking, and aggregations to guarantee data integration and standardization, especially when the target is a relational database with a specified schema. 


Data pipelines are pivotal for data science projects and business intelligence as they prepare data for analysis and reporting. Data can originate from APIs, SQL and NoSQL databases, files, etc., but it often necessitates preprocessing before use.  


Data scientists or data engineers commonly manage data preparation, structuring it to meet business needs and managing substantial volumes of data. The type of data processing required in a data pipeline is ascertained through a combination of exploratory data analysis and defined business requirements. Well-designed data pipelines are essential for various data projects, including exploratory data analysis, data visualizations, and machine learning tasks. 

Types of Data Pipelines:

  1. Batch Processing:
    Batch processing involves collecting and processing data in large batches at scheduled intervals. Data is collected over a period of time, stored, and then processed in a single batch. Batch processing is well-suited for scenarios where data latency is not critical, such as generating daily reports or performing historical analysis. 
  1. Stream Processing:
    Stream processing involves processing data in real-time as it is generated. Data is processed as a continuous stream, allowing for immediate analysis and action on incoming data. Stream processing is ideal for applications that require low latency and real-time insights, such as fraud detection or monitoring IoT devices.  

Organizations often use a combination of batch and stream processing to handle different types of data processing requirements. Batch processing is used for tasks that can tolerate some delay, while stream processing is used for tasks that require immediate processing and response. 

The Data Pipeline Process:

A data pipeline automates the flow of data from various sources to storage, processing, and visualization platforms. It ensures data is collected, cleaned, stored, processed, and analyzed efficiently. Here’s how it works:

data pipeline process

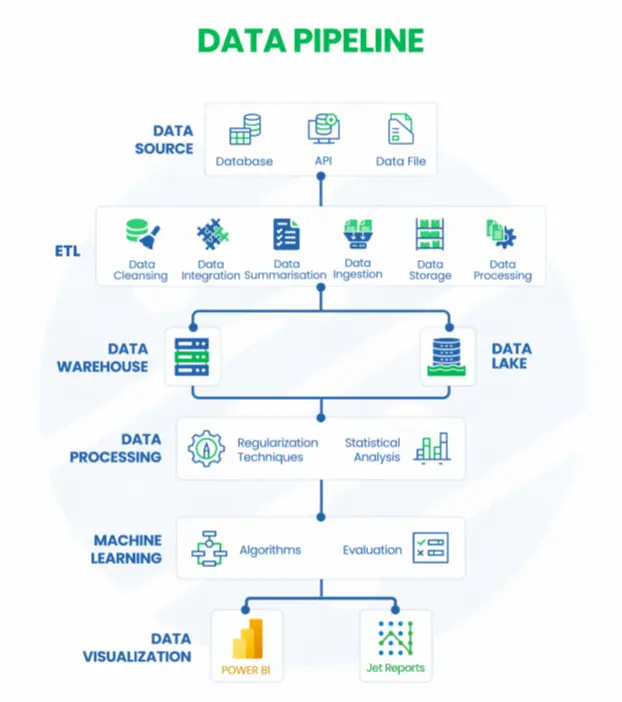
1. Data Source: Gathering Raw Data

Data is collected from multiple sources, including databases (SQL/NoSQL), APIs (real-time data exchange), and data files (CSV, JSON, XML). These sources provide the foundation for business intelligence and analytics.


2. ETL (Extract, Transform, Load): Preparing the Data:

The ETL process ensures data quality and usability. Data cleansing removes errors and duplicates, while integration and summarization combine data from different sources. Data ingestion loads the cleaned data into storage, and processing transforms it for analysis.


3. Data Storage: Organizing and Managing Data

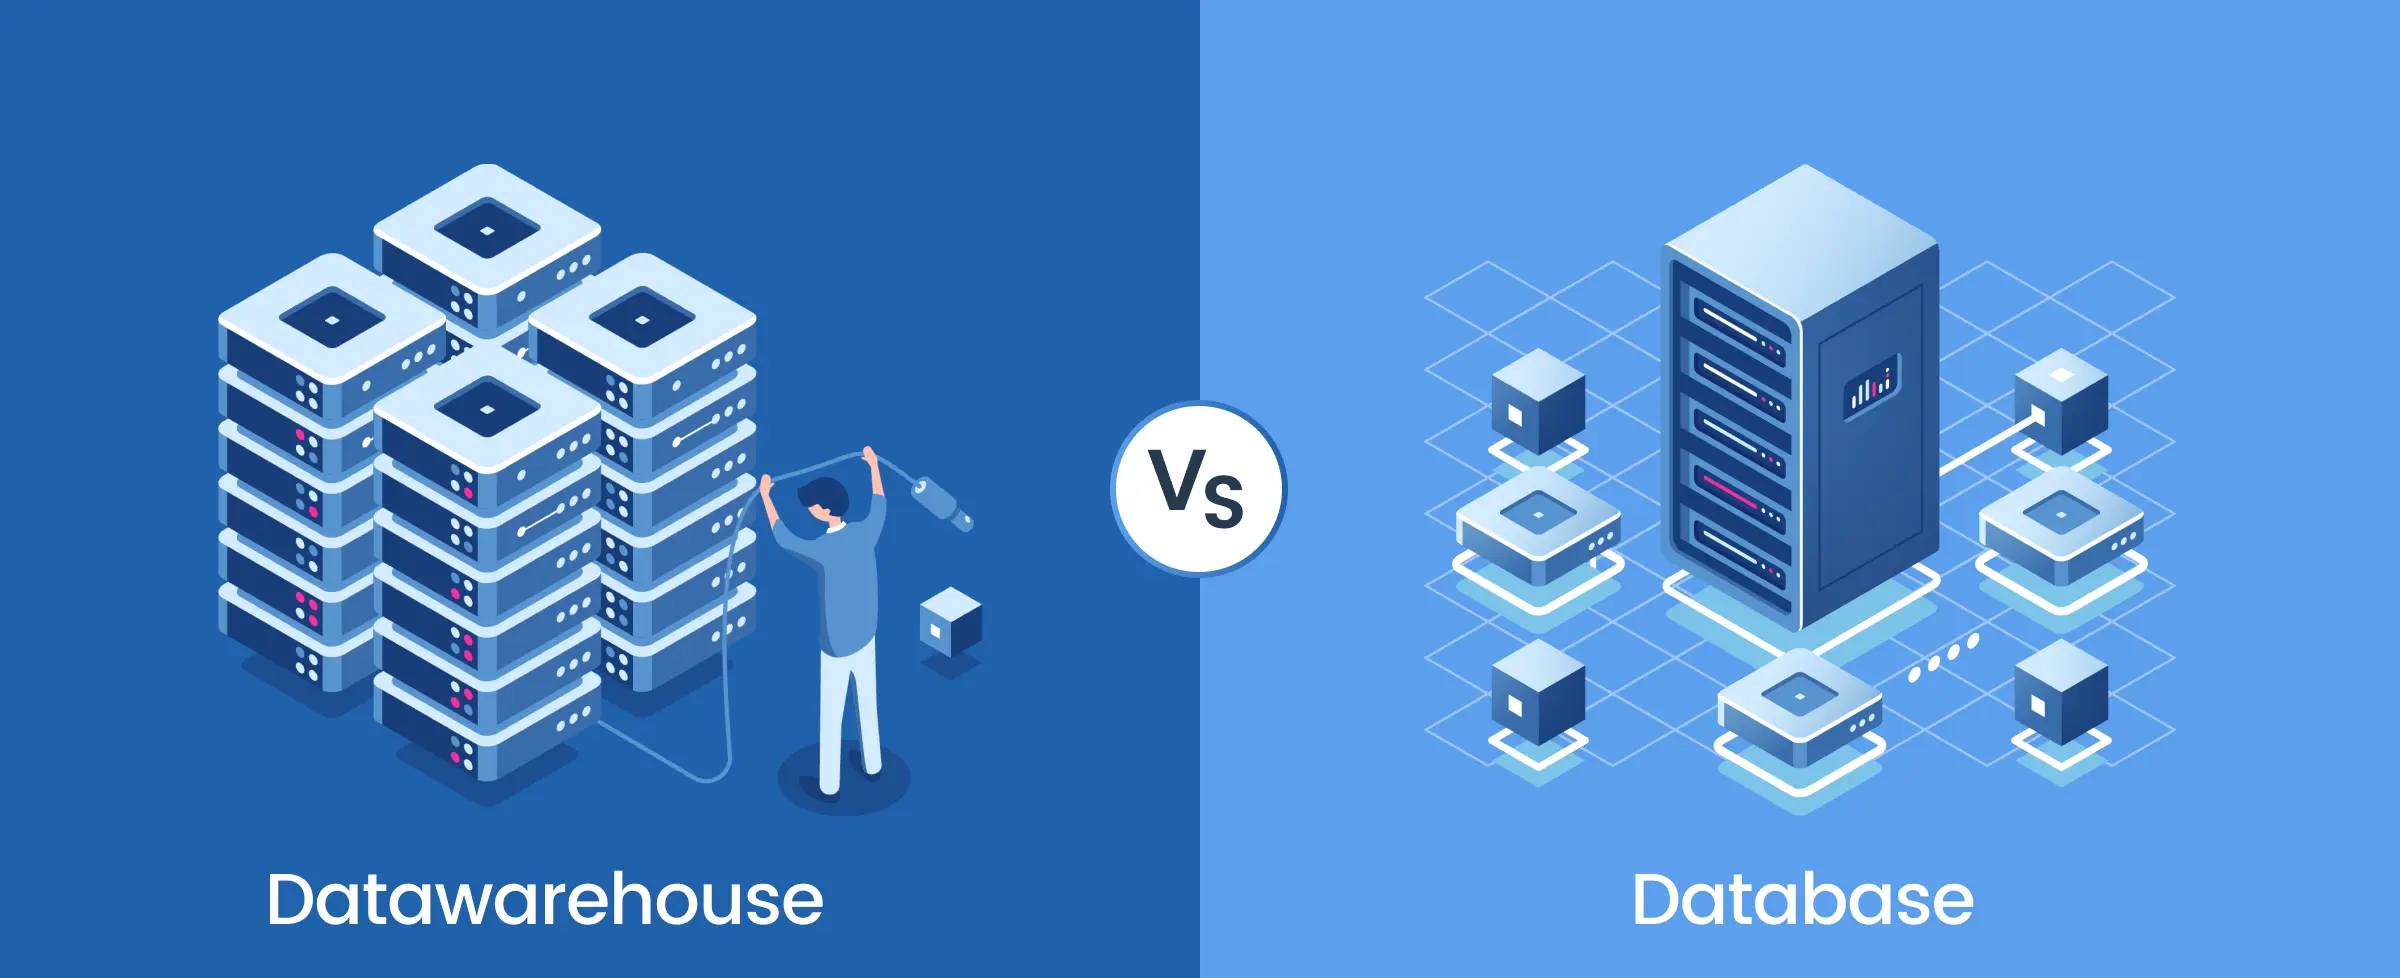
Processed data is stored in either a data warehouse (structured, optimized for fast queries) or a data lake (raw, flexible for future processing). Warehouses support real-time analytics, while lakes store vast amounts of diverse data.


4. Data Processing: Extracting Insights

Regularization techniques ensure data consistency, while statistical analysis identifies trends and patterns. This step refines data for deeper insights and advanced analytics.


5. Machine Learning: Driving AI-Powered Insights

Algorithms detect patterns, classify data, and automate decision-making. The evaluation phase tests models for accuracy, enabling predictive analytics and AI-driven insights.


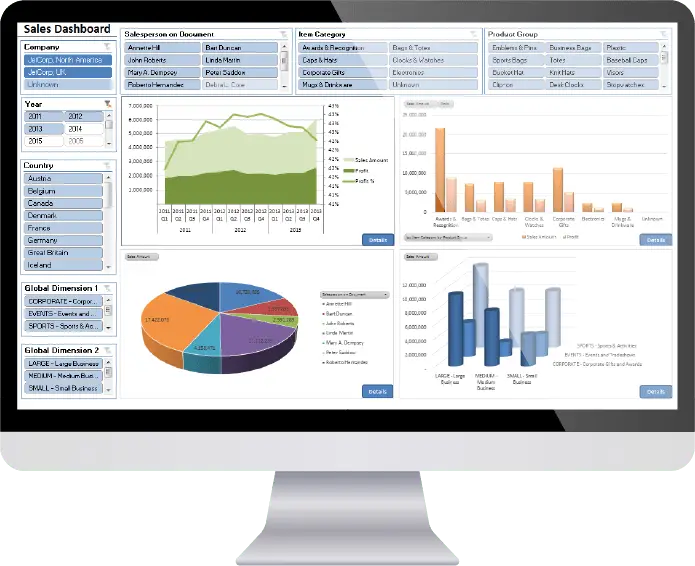
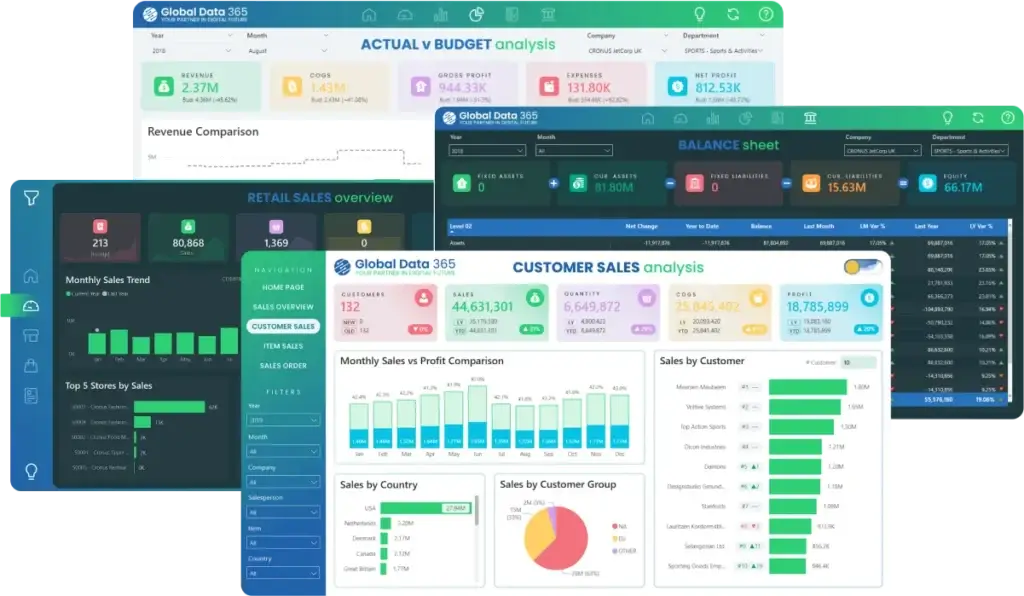
6. Data Visualization: Presenting Insights for Decision-Making

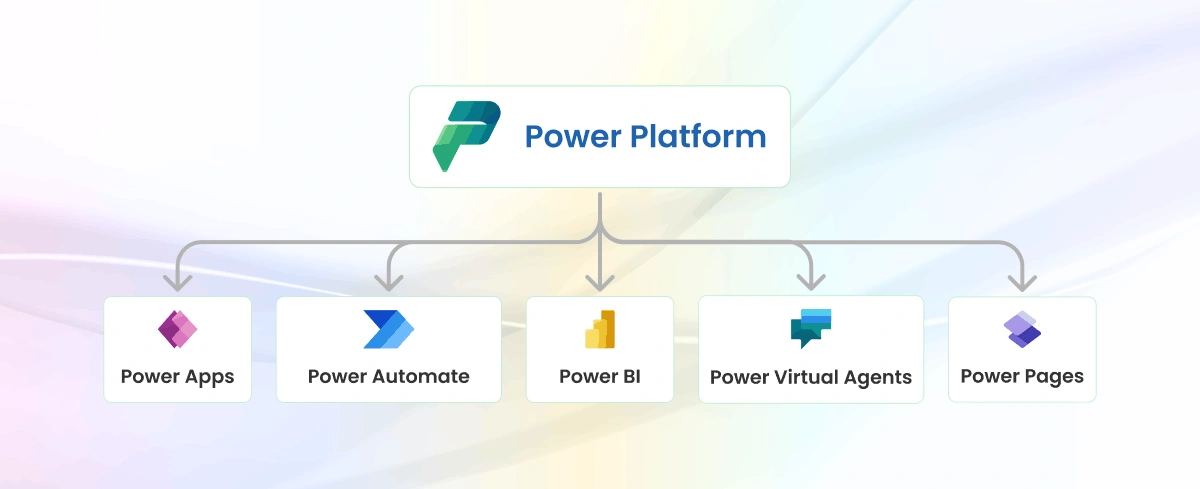
Power BI and Jet Reports create interactive dashboards and reports, making complex data easy to understand. These tools help businesses monitor key metrics and make data-driven decisions.

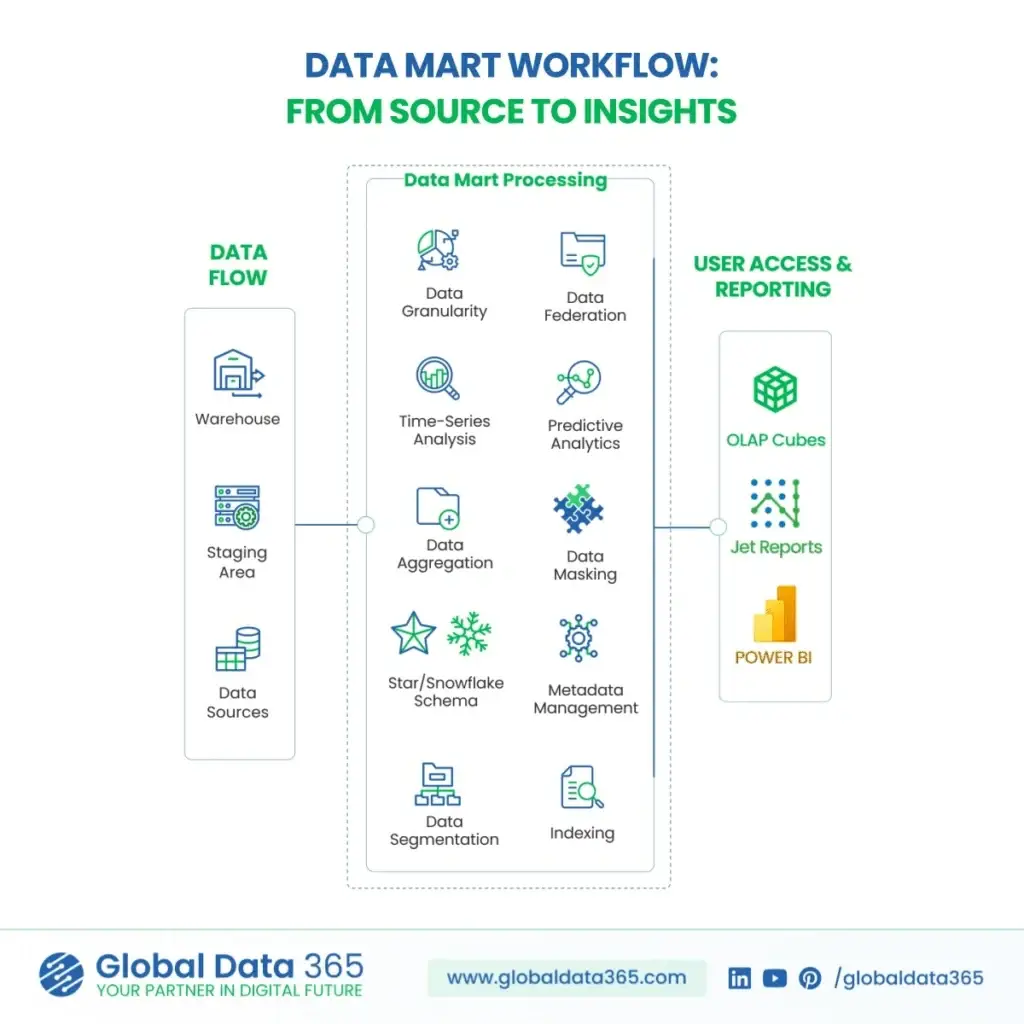
Data Pipeline Architecture:

The architecture of a data pipeline typically consists of three core steps: data ingestion, data processing, and data storage. 


  1. Data Ingestion:
  • Data ingestion is the process of collecting raw data from various sources such as databases, files, APIs, sensors, or streaming platforms. 
  • This step involves extracting data from the source systems and loading it into the data pipeline for further processing. 
  • Common tools used for data ingestion include Apache Kafka, AWS Kinesis, and Apache Flume. 
  1. Data Transformation:
  • In data transformation, a sequence of tasks is performed to convert data into the necessary format for the target data repository.  
  • These tasks incorporate automation and governance to streamline repetitive processes like business reporting, ensuring consistent cleansing and transformation of data. 
  1. Data Storage:
  • Data storage involves storing processed data in a data repository such as a data lake, data warehouse, or database. 
  • The refined data is stored in a data repository, ready for access by various stakeholders. 
  • In the context of streaming data, these refined datasets are commonly referred to as consumers, subscribers, or recipients. 

Benefits of Data Pipeline:

Automated data pipeline brings together data from different sources, helping organizations make the most of their data. In simple terms, a data pipeline helps organizations unlock the full potential of their data assets. Here are some benefits of using data pipelines: 


  1. Improved Efficiency:
    Data pipeline automate data workflows, which means less manual work and better efficiency in handling data. This makes data operations smoother, helps organizations use their resources more wisely, and reduces costs associated with manual data management. 
  1. Scalability:
    Data pipeline can handle large amounts of data, allowing organizations to expand their operations as their data needs grow. With a scalable setup, businesses can manage increasing data demands without any drop in performance. 
  1. Better Data Quality:
    Data pipeline clean and transform data, enhancing its quality and ensuring it’s accurate for analysis and decision-making. This ensures that organizations can rely on the insights they get from their data to guide their business activities.
  2. Real-time Insights:
    The Data pipeline provide access to real-time data, which means organizations can get up-to-date information for immediate action. By using timely data insights, businesses can make quick and informed decisions, giving them an edge in fast-paced markets.
     
  3. Cost-effectiveness:
    The Data pipeline optimize resource use, reducing costs related to manual data processing. By saving time and effort in handling data, organizations can allocate their resources efficiently and achieve cost-effectiveness. 

Data Pipeline Use cases:

As big data continues to grow, data management becomes an ever-increasing priority. Data pipelines serve various functions, especially in business applications: 


  1. Exploratory Data Analysis (EDA):
    Data scientists use EDA to analyze and investigate datasets, summarizing their main characteristics. EDA helps determine the best way to manipulate data sources to get needed answers, making it easier to discover patterns, spot anomalies, test hypotheses, or check assumptions. 
  1. Data Visualizations:
    Visual representations of data, such as charts, plots, infographics, and animations, help communicate complex data relationships and insights in an easy-to-understand manner. 
  1. Machine Learning:
    A branch of artificial intelligence, uses data and algorithms to imitate the way humans learn, gradually improving accuracy. Statistical methods and algorithms are trained to make classifications or predictions, uncovering key insights in data mining projects. 
  1. Data Observability:
    This practice uses various tools to monitor, track, and alert for both expected events and anomalies, ensuring the accuracy and safety of the data being used. 
  1. Data Integration and Data Warehousing:
    Data pipelines are crucial for integrating data from multiple sources and storing it in a data warehouse for analysis. This allows organizations to have a unified view of their data, enabling better decision-making. 
  1. Real-time Analytics:
    Data pipelines can process streaming data in real-time, enabling organizations to analyze data as it is generated and make timely decisions. 
  1. Data Migration:
    Data pipeline can be used to migrate data between systems, such as moving data from an on-premises database to a cloud-based data warehouse. 
  1. Log Processing and Analysis:
    Data pipeline can process and analyze log data from applications and systems, helping organizations monitor performance, detect issues, and improve security. 

Challenges and Limitations of Data Pipeline:

While data pipeline offer numerous advantages, they also come with challenges and limitations that organizations must address:

  • Complexity in Implementation:
    Designing and maintaining a robust data pipeline requires expertise in data engineering, integration, and automation. Poorly designed pipelines can lead to inefficiencies and failures.

  • Data Quality Issues: 
    Inconsistent or incomplete data from various sources can lead to inaccurate insights. Ensuring data validation, cleansing, and transformation at every stage is crucial but can be resource-intensive.

  • Scalability Constraints: 
    As data volume grows, pipelines must be able to scale efficiently. Without proper infrastructure, organizations may face bottlenecks, slow processing speeds, or system failures.

  • Latency and Real-Time Processing Challenges:
    While real-time data pipelines enable faster decision-making, maintaining low latency in streaming data environments requires powerful computing resources and optimized architecture.

  • Security and Compliance Risks:
    Data pipelines handle sensitive information, making them vulnerable to breaches and compliance violations. Implementing encryption, access controls, and governance policies is essential but adds complexity.

  • High Maintenance and Monitoring Overhead:
    Pipelines require continuous monitoring, debugging, and optimization to prevent failures, data loss, or corruption. Unexpected schema changes or source disruptions can break pipelines, demanding quick fixes.

  • Cost Considerations:
    Cloud-based and on-premise data pipelines incur costs related to storage, compute resources, and third-party tools. Inefficient pipelines can lead to excessive spending on data processing and storage.

In Conclusion

In conclusion, data pipelines are crucial components of modern data management, facilitating the collection, processing, and analysis of data to drive informed decision-making. They play a pivotal role in various applications such as exploratory data analysis, data visualizations, machine learning, and real-time analytics. By enabling organizations to integrate data from multiple sources, data pipelines help break down data silos and improve overall data quality. As data continues to grow in volume and complexity, data pipelines will remain essential tools for organizations looking to harness the power of data to gain insights and drive business success. 

Talk to our BI Experts!

Share this blog on:

Search Blog

About Us

Global Data 365 is composed of highly skilled professionals who specialize in streamlining the data and automate the reporting process through the utilization of various business intelligence tools.

Follow us on:

Want to try Jet Analytics?

Get Free License for 30 Days

Jet Analytics Hero Section

Subscribe to Our Newsletter

What is Data Pipeline? Read More »

data marts

What is Data Mart?

data marts

We use many data storage and repository solutions, but do you know what a data mart is? Data marts are a subset of a data warehouse, specifically designed to serve the needs of a particular department, business unit, or team. While a data warehouse contains enterprise-wide data and serves as a central repository, but they focus on specific area of the business, providing relevant data for faster, more efficient analysis. 


For example, a marketing team may use a marketing data mart to track campaign performance, while the sales department uses a sales data mart to analyze customer interactions. By narrowing down the data scope, you can enable quicker insights and more efficient decision-making. 

What is Data Mart?

A precise definition of data mart is a specialized subset of a data warehouse, designed to meet the specific data analysis needs of a particular department, business unit, or team within an organization. Unlike a data warehouse, which stores enterprise-wide data as a central repository, they focus on a narrower scope, providing only relevant data for faster and more targeted analysis. By offering a streamlined view of data, it enables users to extract actionable insights quickly without navigating through extensive datasets. This tailored approach makes them a valuable tool for optimizing decision-making and improving operational efficiency. Data Warehouses are composed entirely of proprietary corporate data, while data marts take advantage of data purchased from third-party firms.

Why Are Data Marts Important for Businesses?

There is a critical role of data mart in business intelligence and data accessibility. Their department-specific focus allows teams to quickly analyze relevant data without sifting through large, complex datasets found in a full-scale data warehouse. With quicker access to accurate data, organizations can make informed decisions and respond to market changes faster, leading to a competitive edge. 

Types of Data Marts

There are three main types, each serving different organizational needs: 

  1. Dependent Data Mart:
    A dependent mart is built from a centralized data warehouse. Data is first stored in the warehouse and then extracted and loaded into the mart. This ensures consistency and data integrity across the organization.
  2. Independent Data Mart:
    An independent mart is a standalone system that does not rely on a data warehouse. It pulls data directly from source systems. While quick to implement, it can result in data silos and inconsistencies if not properly managed.
  3. Hybrid Data Mart:
    A hybrid mart combines elements of both dependent and independent data marts. It leverages centralized data from the warehouse while allowing departments to store and manage their own data as needed. 

How to Build a Data Mart?

Building a mart involves several key steps to ensure it aligns with business needs and supports efficient data analysis: 

data mart process
  1. Define Business Requirement:
    The first step in building is understanding the business requirements of the department or team it will serve. This involves identifying the specific data they need, how they will use it, and what type of analysis they’ll conduct.  
  1. Design Architecture:
    When designing the architecture, businesses need to choose between a star schema and a snowflake schema:
    Star Schema: Data is organized around a central fact table with related dimension tables. It’s simple and efficient for querying. 
    -Snowflake Schema: A more normalized version of the star schema, where dimension tables are further broken down into additional tables. It can improve storage efficiency but may be more complex to query. 
  1. Extract, Transform, and Load (ETL) Process:
    The ETL process is critical to build: 
    -Extract: Data is pulled from source systems or the data warehouse. 
    -Transform: Data is cleaned, normalized, and transformed to fit the data mart’s schema. 
    -Load: The transformed data is loaded into the data mart for querying and analysis. 
  1. Testing and Validation:
    Testing ensures the data mart is working correctly and the data is accurate. Validation includes checking data consistency, performance, and ensuring that queries return correct results. 
  1. Maintenance and Scaling:
    They require ongoing maintenance, such as updating data, optimizing queries, and scaling the infrastructure to meet future growth and usage needs. 

Benefits of Data Mart for Business Intelligence

  1. Improved Performance:
    With smaller, focused datasets, they provide faster query performance, allowing users to retrieve the data they need quickly without waiting for large-scale processing. 
  1. Enhanced Decision-Making:
    By offering department-specific data, they empower teams to make informed, data-driven decisions. This business intelligence leads to improved strategic planning and execution. 
  1. Cost Efficiency:
    They are more cost-effective compared to a full data warehouse implementation. For small or mid-sized teams, the reduced scope means lower infrastructure and maintenance costs. 
  1. Focused Analysis:
    They allow departments to concentrate on the data that matters most to them, leading to more precise analysis and actionable insights. 
  1. Easier to Manage:
    It is simpler to design, build, and maintain than a large data warehouse. This simplicity translates to lower maintenance costs, less complexity in data integration, and fewer challenges in ensuring data quality and consistency. 
  1. Enhanced Security and Control:
    They can be designed to limit access to specific data, giving organizations more control over who can view or modify sensitive information. This targeted control is crucial for departments dealing with confidential or proprietary data. 

When Should You Use a Data Mart?

The Data Marts are designed for the end-user needs in a strategic business unit or department.

  • Department-Specific Analysis: If a department needs tailored insights from data, a data mart is the ideal solution. 
  • Budget Constraints: They are a more affordable option than building a full-scale data warehouse. 
  • Quick Deployment Needs: If your organization needs a fast solution for data analysis, they are quicker to implement. 
  • Simpler Data Requirements: When only a small, focused data set is needed for analysis, it is more efficient. 

Common Use Cases for Data Marts

  1. Sales and Marketing Teams:
    Sales departments can use it to track performance metrics and customer trends. Marketing teams can monitor campaign effectiveness and return on investment. 
  1. Finance Departments:
    Finance teams can use them for financial reporting, budget analysis, and cost tracking, allowing them to make more informed financial decisions. 
  1. Customer Service and Support:
    Customer service teams can track performance metrics like response times, satisfaction rates, and case resolution data through a dedicated data mart. 
  1. Healthcare:
    In healthcare organizations, it can be used to analyze patient data, medical billing, and track performance metrics for different departments. 

Challenges and Limitations of Data Marts

While it offer numerous benefits, they are not without their challenges, following are some disadvantages of data mart: 


  • Data Silos: Independent data marts can result in isolated systems that don’t communicate with other business units, leading to inconsistent data across departments. 
  • Maintenance: Overhead managing multiple marts can be time-consuming, especially if each department operates its own independent system. This can increase maintenance costs over time. 
  • Scalability: As businesses grow, integrating multiple marts or scaling them can become complex. Without careful planning, businesses may struggle to scale their data infrastructure.


  • Data Redundancy and Maintenance: They can lead to data redundancy across the organization, especially when multiple departments create their own marts with overlapping data. This duplication not only increases storage costs but also complicates data maintenance and synchronization, potentially resulting in inconsistent data across departments.

Best Practices for Implementation

  • Start Small, Scale Gradually: Begin with a single mart for one department and scale based on business needs. This minimizes complexity and ensures the system can evolve without becoming overwhelming. 
  • Ensure Data Quality: To avoid issues with incorrect or outdated information, focus on data quality and implement strong governance measures. 
  • Align with Business Goals: Ensure thar it aligns with the organization’s goals and serves a clear business purpose. Each should be designed to support decision-making within the relevant department. 
  • Regular Monitoring and Optimization: Continuously track the performance of the data mart and optimize it for better efficiency and faster query times. This helps ensure it remains an effective tool for data analysis. 

Future Trends in Data Marts

  • Cloud-Based Data Marts: With the rise of cloud computing, cloud-based data marts offer businesses the flexibility to scale their infrastructure without the need for costly on-premises hardware. It also improve accessibility and performance. 
  • Data Mart Automation: AI and machine learning are revolutionizing data marts by automating ETL processes, improving data quality, and optimizing query performance.


  • Integration with Real-Time Analytics: As businesses demand faster insights, they are increasingly being integrated with real-time analytics platforms. This trend enables to provide near-instantaneous insights by processing and delivering data as it’s generated, allowing for more agile decision-making and up-to-the-minute reporting across departments.


  • Data Mart Virtualization: Data Virtualization is emerging as a way to create a unified view of data across multiple sources without physically consolidating the data. This approach allows organizations to access and analyze data from different systems in real time, improving flexibility, reducing data duplication, and lowering storage costs.
  • Self-Service Data Marts: Self-service tools empower business users to create and manage their own data marts, reducing dependency on IT departments and fostering faster decision-making. 

In Conclusion

In conclusion, they are an essential part of modern business intelligence, enabling organizations to access, analyze, and leverage data quickly and efficiently. Whether you’re looking to improve decision-making, reduce costs, or enhance performance, implementing a well-designed mart can help your business thrive in today’s competitive environment. By understanding their benefits, challenges, and best practices, you can ensure that your organization is making the most of its data-driven opportunities. 


Are you ready to empower your teams with faster, more targeted insights? Consider implementing a data mart tailored to your department’s specific needs. If you’re unsure where to begin, our experts can help you assess your data strategy and build a solution that drives meaningful results. Contact us today to start your journey toward more efficient and effective data management! 

Talk to our BI Experts!

Share this blog on:

Search Blog

About Us

Global Data 365 is composed of highly skilled professionals who specialize in streamlining the data and automate the reporting process through the utilization of various business intelligence tools.

Follow us on:

Related Resources

Want to try Jet Analytics?

Get Free License for 30 Days

Jet Analytics Hero Section

Subscribe to Our Newsletter

What is Data Mart? Read More »

power bi vs jet reports

Power BI vs. Jet Reports: 11 Key Differences

power bi vs jet reports

Power BI vs. Jet Reports: the ultimate comparison between two powerful tools that cater to different aspects of data analysis and reporting, each with its strengths and unique features. 


Power BI, developed by Microsoft, is a comprehensive business analytics tool that enables users to visualize and analyze data through interactive reports and dashboards. It excels at creating interactive dashboards and reports for tailored insights. However, Power BI does have some limitations when it comes to financial and operational reporting. Creating reports is complex, requiring DAX scripting and technical knowledge. It lacks drill-down capability to Dynamics NAV/365 Business Central, and needs detailed transactions in the data model. 


While Jet Reports is a business reporting solution designed to work with Microsoft Dynamics ERP systems, such as Dynamics NAV and Dynamics 365 Business Central. It provides fast, flexible financial and business reporting within Excel environment. It simplifies access to information by enabling real-time reporting on Microsoft Dynamics data and allows easy sharing of reports across your organization. 

Power BI and Jet Reports: What's the difference?

Both Power BI and Jet Reports are complementary tools in the realm of data analysis and reporting, but they have core differences in their functionality and focus. 

Aspects 

Power BI 

Jet Reports 

Purpose

Microsoft’s robust analytics, best for data visualization and dashboards with interactive visuals.

Focused on detailed financial and operational reporting from Dynamics ERP.

Interface  

Uses Power BI Desktop, requires learning for new users.

Integrates with Excel, familiar for finance professionals.

Visualization

Offers rich, interactive visuals with numerous chart types.

Basic visualizations, prioritizing details on transactions.


Data Integration  

Connects to various on-premises, cloud, and third-party sources.

Optimized for Microsoft Dynamics ERP data.

Customization

Strong visual customization, limited for detailed formatting.

High flexibility in formatting and layout via Excel.


User Base

Used by executives and analysts for high-level insights.

Preferred by finance teams for detailed reporting.


Security 

Robust security with role-based access and Azure integration. 

Utilizes the NAV-BC security model, eliminating the need to manage a separate security model. 

Real Time Reporting

Supports live data and frequent refreshes.

Real-time data from Dynamics ERP. 

Drill-down Capabilities 

Advanced drill-down on interactive dashboards.

Excel-based drill-down functionality.

Report Scheduling and Distribution 

Automates report sharing via Power BI Service.

Reports scheduled and distributed directly from Excel.

Dimensions 

Supports dimensional analysis for detailed data slicing.

Works seamlessly with Dynamics dimensions.


In Conclusion

In conclusion of Power BI vs. Jet Reports; both offer valuable solutions for data analysis and reporting, each has its own strengths and focus. Power BI is a comprehensive tool suitable for users working with diverse data sources, offering advanced data visualization and analysis capabilities. On the other hand, Jet Reports, is specifically designed for reporting of Microsoft Dynamics ERP systems, providing a more streamlined and tailored reporting solution. 


The core differences between Power BI and Jet Reports lie in their functionality and integration capabilities. Power BI requires manual or scheduled refreshes for its data model and lacks real-time reporting directly from the ERP. In contrast, Jet Reports enables real-time reporting by directly refreshing reports against the live ERP system, providing a more seamless and integrated reporting experience within the Dynamics environment. 


Ultimately, the choice between Power BI and Jet Reports depends on the organization’s specific needs and requirements. Power BI is ideal for users who require extensive data visualization and analysis capabilities, while Jet Reports is more suitable for users within the Dynamics ERP environment who need a specialized reporting solution. Integrating these tools can enhance an organization’s data analysis and reporting capabilities, especially for those leveraging Microsoft Dynamics ERP systems. 


Still exploring which solution is right for you? Our experts are here to help! Contact us today to discuss your unique business needs and find the perfect fit. 


Our team will guide you through the features and benefits of both Power BI and Jet Reports, helping you understand how each solution aligns with your goals. Whether you need advanced data visualization and analysis capabilities or a specialized reporting tool for Microsoft Dynamics ERP systems, we’ll help you make an informed decision. 


Don’t let uncertainty hold you back. Contact us today and discover which tool; Power BI vs. Jet Reports leads you to winning data transformation!

Unlock Powerful Insights: Get Your Free Jet and Power BI Demo!

Share this blog on:

Search Blog

About Us

Global Data 365 is composed of highly skilled professionals who specialize in streamlining the data and automate the reporting process through the utilization of various business intelligence tools.

Follow us on:

Related Resources

Transform Business with BI Tools

Get Free Personalized Consultation Today!

power bi dashboard

Interact Live with Dashboards

Increase efficiency and deliver success now with Microsoft Power BI. Enjoy a 20% discount on all Power BI services.

dashboards

Subscribe to Our Newsletter

Power BI vs. Jet Reports: 11 Key Differences Read More »

Data Mining

What is Data Mining?

Data Mining

Data mining refers to the process of extracting valuable patterns, information, and knowledge from large datasets. It involves uncovering hidden trends, correlations, and associations within the data, providing organizations with actionable insights for informed decision-making.

How Data Mining Works?

  • Data Collection: This involves gathering relevant data from various sources, such as databases, logs, and external datasets. The richness and diversity of the data contribute to the effectiveness of the mining process.
  • Data Cleaning: Identifying and rectifying errors, inconsistencies, and missing values in the dataset is crucial. Clean data ensures the accuracy and reliability of the mining results.
  • Exploratory Data Analysis: Before diving into the modeling phase, analysts perform exploratory data analysis to understand the structure, relationships, and potential patterns within the dataset. This step guides subsequent modeling decisions.
  • Model Building: Mathematical models or algorithms are created in this step to identify patterns and relationships within the data. This phase requires a deep understanding of the dataset and the goals of the analysis.
  • Pattern Evaluation: The effectiveness of the models is evaluated in terms of their ability to reveal meaningful insights. This step ensures that the patterns identified are relevant and reliable.
  • Knowledge Deployment: Implementing the discovered knowledge is the final step, where insights gained from the analysis are applied to drive decision-making and improve business processes.

Data Mining Techniques

Data mining employs various techniques, including:


  • Classification: This technique categorizes data into predefined classes or groups based on identified patterns. It is often used for tasks such as spam filtering or customer segmentation.
  • Clustering: Grouping similar data points together helps identify inherent structures within the dataset. This technique is valuable for market segmentation and anomaly detection.
  • Regression: Predicting numerical values based on identified relationships within the data. It is widely used in areas such as sales forecasting and risk assessment.
  • Association Rule Mining: This technique discovers relationships and patterns that frequently co-occur in the dataset. It is applied in areas like market basket analysis in retail.

The Process of Data Mining

  1. Data Collection: Gathering relevant data from diverse sources sets the foundation for meaningful analysis. The more comprehensive the dataset, the richer the insights.
  2. Data Preprocessing: Cleaning and transforming the data for analysis is essential for accurate results. This step involves handling missing values, outliers, and ensuring data consistency.
  3. Exploratory Data Analysis: Understanding the characteristics and relationships within the dataset guides subsequent modeling decisions. Visualization tools are often employed to aid in this exploration.
  4. Model Building:Developing algorithms or models to identify patterns requires expertise in both the domain and the intricacies of the data. This step is crucial for accurate and meaningful results.
  5. Validation and Testing: Evaluating the model’s performance on new data ensures its generalizability. Techniques like cross-validation help in assessing the model’s robustness.
  6. Implementation: Deploying the knowledge gained from the analysis for practical use completes the data mining process. This step often involves integrating insights into existing business processes.

Applications of Data Mining in Business Intelligence

The data mining process is fundamental to strengthening business intelligence, offering a range of applications that enhance decision-making and operational efficiency:

  1. Strategic Decision-Making: Leveraging data-driven insights enables organizations to make well-informed decisions, fostering strategic planning and optimizing resource allocation for sustained success.
  2. Customer Segmentation: Identifying and comprehending diverse customer segments are pivotal. Data mining facilitates targeted marketing strategies and cultivates personalized customer experiences, driving customer satisfaction and loyalty. The reporting capabilities of business intelligence tools, such as Jet Analytics, offer a robust solution for creating customer-centric reports. By delving into customer data, organizations can tailor their strategies enhancing overall customer satisfaction.
  3. Fraud Detection: Uncovering anomalies and unusual patterns in financial transactions is a critical aspect of business intelligence. Data mining plays a crucial role in proactively identifying fraudulent activities and safeguarding financial integrity.
  4. Market Analysis: In a dynamic business environment, analyzing market trends and predicting future conditions is indispensable. Data mining empowers businesses to stay competitive by providing insights that aid in adapting to changing market landscapes. Integrated reporting solutions, such as Jet Reports, for visualizing and interpreting market data. Organizations can generate reports that highlight key market trends, enabling them to make proactive decisions and stay ahead in dynamic market scenarios.

Data Mining Uses

Data mining finds applications across various industries, including healthcare, finance, retail, and manufacturing. It is utilized for:


  • Healthcare: In healthcare, data mining is instrumental in predicting disease outbreaks and optimizing patient care. By analyzing vast datasets, it contributes to improved public health initiatives, early detection of health trends, and personalized treatment strategies.
  • Finance: Data mining plays a crucial role in the financial sector by identifying fraudulent transactions and predicting market trends. These insights aid in effective risk management, fraud detection, and the formulation of sound investment strategies, contributing to the stability of financial systems.
  • Retail: In the retail industry, data mining is employed to analyze customer behavior and optimize inventory management. Understanding consumer preferences and purchasing patterns enhances the overall retail experience, enabling businesses to tailor their offerings and improve customer satisfaction. This can be further visualized with Power BI Dashboard that can be custom made for your preference.
  • Manufacturing: For manufacturing, data mining is utilized to improve production processes and predict equipment failures. By analyzing data related to machinery performance, production workflows, and quality control, manufacturers can enhance efficiency, reduce downtime, and make informed decisions to optimize operations.

Pros and Cons of Data Mining

Pros:

  • Informed Decision-Making: The insights gained from data mining empower organizations to make informed decisions, leading to strategic advantages. This results in a more agile and adaptive approach to changing market conditions.
  • Efficiency: By optimizing processes and identifying areas for improvement, data mining contributes to increased operational efficiency. Streamlining workflows and resource allocation enhances overall business productivity.
  • Predictive Analysis: The ability to predict future trends and behaviors enables proactive decision-making and planning. Businesses can anticipate market shifts, customer preferences, and potential challenges, staying ahead of the curve.
  • Innovation Catalyst: Data mining often sparks innovation by revealing hidden patterns and opportunities. Organizations can uncover novel ideas and strategies that drive product development and business growth.

Cons:

  • Privacy Concerns: The use of personal data raises ethical and privacy concerns, necessitating careful handling and compliance with regulations. Striking a balance between data utilization and privacy protection is an ongoing challenge.
  • Complexity: Implementing data mining processes can be complex, requiring skilled professionals and significant resources. The intricacies of algorithmic models and the need for specialized expertise may pose challenges for some organizations.
  • Data Accuracy: The accuracy of results is highly dependent on the quality and precision of the input data. Ensuring data accuracy remains a perpetual challenge, as inaccuracies in the input can lead to misleading insights and flawed decision-making.
  • Integration Challenges: Integrating data mining into existing systems and workflows can be challenging. The process may disrupt established routines, requiring careful planning and effective change management to mitigate potential disruptions.

In Conclusion

In conclusion, data mining is a dynamic process that transforms raw data into actionable intelligence, driving informed decision-making in various industries. While offering numerous benefits, careful consideration of privacy and data accuracy is essential. As businesses continue to leverage data mining for strategic advantage, a balanced approach that addresses both the advantages and challenges will be crucial for success in the data-driven landscape.

Get 30 days free license for Jet Reports

Share this blog on:

Search Blog

About Us

Global Data 365 is composed of highly skilled professionals who specialize in streamlining the data and automate the reporting process through the utilization of various business intelligence tools.

Follow us on:

Want to try Jet Analytics?

Get Free License for 30 Days

Jet Analytics Hero Section

Subscribe to Our Newsletter

What is Data Mining? Read More »

Microsoft 365 Copilot

Microsoft 365 Copilot: Revolutionizing Your Productivity

Microsoft 365 Copilot

In the ever-evolving landscape of digital productivity tools, Microsoft 365 stands tall as a comprehensive suite that empowers businesses worldwide. Among its many offerings, Microsoft 365 Copilot emerges as a transformative solution, promising to revolutionize the way organizations manage their Microsoft 365 environment.

What is Microsoft 365 Copilot?

Microsoft 365 Copilot is a revolutionary management tool designed to simplify the administration of Microsoft 365 services including those crucial for customer relationship management (Microsoft Dynamics 365 CRM), finance and operations (Microsoft Dynamics 365 F&O), and business central management (Microsoft Dynamics 365 BC).

It comprises three main components: Microsoft 365 apps (like Word, Excel, Teams), Microsoft Graph (incorporating files and data across the M365 environments), and OpenAI models (including ChatGPT-3, ChatGPT-4, DALL-E, Codex, and Embedding), all hosted on Microsoft Azure. Unlike traditional management methods, Copilot offers a more efficient and streamlined approach, allowing organizations to focus on their core business activities.

Microsoft 365 Copilot Features:

The Copilot offers many features for vast business community such as;

  • Effortless Automation: Microsoft 365 Copilot improves productivity by automating repetitive tasks and workflows, allowing employees to focus on more strategic initiatives.
  • Reduced Cost and optimizing Resources: It helps organizations save costs and optimize resources by streamlining Microsoft 365 management processes.
  • AI-powered insights: It leverages AI to unlock valuable insights from your Dynamics 365 state. Gain real-time customer behavior trends in Dynamics 365 CRM or identity financial optimization opportunities in Dynamics 365 F&O.
  • Streamlined Collaboration: Microsoft 365 Copilot fosters seamless collaboration within Dynamics 365 applications. Imagine teams working together on sales proposals in Dynamics 365 CRM or project plans in Dynamics 365 Business Central with real-time edits and suggestions.
  • Enhanced Security: It empowers businesses to maintain robust security within Dynamics 365. Leverage advanced monitoring and threat detection to keep your data safe.

Microsoft 365 Copilot

How Much Does Microsoft 365 Copilot Cost?

Microsoft 365 Copilot is available as part of the Microsoft 365 Enterprise subscription, which offers a range of plans tailored to meet the needs of businesses of all sizes. The cost of Copilot varies depending on the specific plan chosen, with pricing starting at $30 per user per month for the basic plan. Find how Microsoft Dynamics transform your business with: Microsoft 365Future plans include tailored Microsoft 365 Copilot for Dynamics 365, Power Platform, security suite, and Windows OS.

How many Modes of Interaction are in Copilot?

  • Microsoft 365 Copilot system offers two main interaction modes: Direct engagement within applications like Word and Teams, and accessibility through Microsoft 365 Chat in Teams
  • Within applications, users seamlessly integrate M365 Copilot for tasks like drafting documents and summarizing meetings in real-time.
  • The second method of interaction is through Microsoft 365 Chat, functioning as a chatbot within Teams. Microsoft 365 Chat serves as a versatile tool for natural language interactions, enabling users to search across diverse sources.
  • Microsoft 365 Copilot enhances productivity in Word by offering text suggestions, facilitates collaboration in Teams with real-time meeting summaries, and streamlines PowerPoint presentations.
  • In addition to automation, Microsoft 365 Copilot also provides advanced monitoring and reporting capabilities, allowing you to keep track of service health and performance metrics. This information can help you identify potential issues before they escalate, ensuring that your Microsoft 365 copilot environment remains stable and reliable.

In Conclusion

Copilot is a transformative tool that empowers businesses to unlock the full potential of Dynamics 365. With its innovative cutting-edge functionality and user-friendly interface, Copilot is empowering teams to collaborate more effectively and achieve their goals efficiently. To experience the benefits of Microsoft 365 Copilot for your business and drive growth, contact us at Global Data 365 today. Our team is ready to help you leverage this powerful tool to take your productivity to new heights.

Get 30 days free license for Jet Reports

Share this blog on:

Search Blog

About Us

Global Data 365 is composed of highly skilled professionals who specialize in streamlining the data and automate the reporting process through the utilization of various business intelligence tools.

Follow us on:

Want to try Jet Analytics?

Get Free License for 30 Days

Jet Analytics Hero Section

Subscribe to Our Newsletter

Microsoft 365 Copilot: Revolutionizing Your Productivity Read More »

Management Reporter Jet Reports

Management Reporter vs Jet Reports

Management Reporter Jet Reports

Importance of Reporting Tools in Business Management

In today’s dynamic business environment, the significance of robust reporting tools cannot be overstated. Efficient financial reporting software and business intelligence reporting play a pivotal role in business management; aiding organizations to make informed decisions, monitor performance, and strategize for the future. Two prominent players in the reporting tools arena are Management Reporter vs. Jet Reports. 

What Is Management Reporter?

Management reports are essential components of business intelligence, providing a comprehensive overview of an organization’s financial performance. Management Reporter, a powerful financial reporting tool, stands out with its versatile report designer, enabling the creation of dynamic reports tailored to specific needs. 

We are going to give you three scenarios where a user should consider switching to Jet Reports or Jet Analytics: 

What is Jet Reports?

Jet Reports, on the other hand, is a dynamic business intelligence tool that goes beyond conventional financial reporting. With its user-friendly interface and Jet Dashboard Designer, organizations can leverage its capabilities for comprehensive financial reporting and analysis. Jet Reports is known for its adaptability and ease of use, making it an asset for businesses aiming to enhance their reporting processes. 

We are going to give you three scenarios where a user should consider switching to Jet Reports or Jet Analytics: 

Management Reporter vs. Jet Reports: 7 Key differences

Management Reporter (MR) is a standalone application from Microsoft that pulls data from Dynamics GP, while Jet Reports is an Excel add-in that pulls data into Excel from Dynamics GP. Jet Reports works with Microsoft Dynamics GP 9 (November 2005 release) and later. Both tools were designed specifically for working with Microsoft Dynamics data and integrated seamlessly with Dynamics GP, but between Management Reports vs. Jet Reports there are several key differences. 

- Building reports

MR reports are built in components one-by-one, starting with defining rows, then defining columns and trees, while Jet Reports are built in whole, not in components, cutting in half or more the time it takes to create a report. 

- Adding new accounts

When a new account is added in Dynamics GP, it must be manually added to Management Reporter. Due to the way MR is structured, not all data changes in Dynamics GP will be tracked on the change tracker and do not update the data mart, which is the tool that syncs MR with Dynamics GP. At times there might be hard coding involved to change how the data mart pulls data from Dynamics GP. However, Jet Reports can refresh data from Dynamics GP at any time, and new accounts will show up, without any hard coding or manually checking for new accounts. 

- Previewing reports

You cannot preview reports in MR, unless you assign a row to an actual report. In Jet Reports, you can easily toggle between design mode and report mode to check and see if the formatting and formulas you used are working as desired. 

- Data extractions

MR connects directly to your instance of Dynamics GP, however you can only create reports in MR using that data – you cannot pull from any other source. In contrast, Jet Reports allows you to pull data from numerous sources and consolidate it together, rather than just pulling data from Dynamics GP for building reports. Jet Reports can extract any data from Dynamics GP into Excel, and when the data refreshes, so does your pivot table. 

- Working in Excel

When building reports in MR, you can link to an Excel spreadsheet as a reference and pull in data from a spreadsheet. MR users often find themselves switching between MR and Excel when building reports to pull in data from different sources that might have been exported into Excel. With Jet Reports, you’re working directly inside Excel and can pull data from a variety of locations in addition to from Dynamics GP. This creates a smoother workflow and reduces the need to switch between applications to find the necessary data for a report or dashboard. Additionally, with designing Jet Reports inside Excel, you can take advantage of formatting options, copying and pasting, and other functionalities you are used to in Excel.

- Compatibility

The most recent version of MR reporter is Management Reporter 2012, last updated in 2014, and is compatible with Dynamics AX 2009 and 2012, Dynamics GP 2013 to 2018, and Dynamics SL 2011 and 2015. Jet Reports is regularly updated by insightsoftware, and is compatible with all Microsoft ERPs including Dynamics 365 products, Dynamics NAV, Dynamics GP, Dynamics AX, Dynamics CRM, and Dynamics SL. 

- Migrating to a newer ERP system

Dynamics GP is no longer supported by Microsoft and many companies realize they will eventually need to migrate to a newer ERP such as Dynamics 365 or choose a new ERP altogether. MR is not supported by newer Microsoft products, and as such, none of your reports built inside MR will migrate with you to a new system. On the other hand, all work completed in Jet Reports carries over into any ERP you choose since it is an independent platform and can pull data from any source; all you would have to do is update the data connectors. 

In Conclusion

In conclusion, while both Management Reporter and Jet Reports serve essential roles in the realm of reporting tools, but in the comparison of Management Reporter vs. Jet Reports the latter stands out as a superior choice for businesses aiming to elevate their business management with efficient financial reporting and business intelligence capabilities. The decision ultimately hinges on the specific needs and priorities of each organization, but Jet Reports’ user-friendly features and comprehensive functionality position it as a strong contender in the reporting tools landscape. 

Get 30 days free license for Jet Reports

Share this blog on:

Search Blog

About Us

Global Data 365 is composed of highly skilled professionals who specialize in streamlining the data and automate the reporting process through the utilization of various business intelligence tools.

Follow us on:

Want to try Jet Analytics?

Get Free License for 30 Days

Jet Analytics Hero Section

Subscribe to Our Newsletter

Management Reporter vs Jet Reports Read More »

Overcome Your Fear of Advanced Analytics

Overcome Your Fear of Advanced Analytics

Overcome Your Fear of Advanced Analytics

We have all read that information is nothing unless it can be turned into meaningful data. It can be daunting in business to have access to so much data. How do you know where to begin when you’re bombarded with information It’s possible to get lost during it all, overwhelmed by the flood of data and uncertain where to start looking for ways to improve business processes. That is where you can utilize advanced analytics. 

Advanced analytics is the automated or semi-autonomous analysis of data using materials and tools that go beyond traditional business intelligence (BI). It’s a catch-all word for several analytics sub-fields that collaborate using predictive capabilities. High-level approaches and software forecast future patterns, activities, and events, allowing businesses to create “what-if” models and estimates to future-proof their operations. 

Advanced analytics involves data mining, big data, and predictive data analytics, which allows you to mine your data for deeper, more analytical, and eventually actionable insights. Whereas traditional analytical methods show you where you’ve been, advanced analytics focuses on where you’re going next, providing insight into what could happen based on a variety of potential opportunity scenarios. 

Advanced analytics includes newer technology such as machine learning and artificial intelligence, and visualizations. Advanced analytics encompasses so many areas and has such a wide range of applications that it has a variety of applications, including marketing, inventory and warehousing, and manufacturing. Keeping this in mind, it appears that any company should be interested in using advanced analytics to solve critical business problems. 

Listed below are the five main strategies for increasing profit in 2021 using your ERP system and comprehensive financial reporting tools. 

Assumptions Regarding Advanced Analytics

Many CFOs still have assumptions about advanced analytics: 


– They cost money. 
– They take time to deploy. 
– They are complex to understand. 

Advanced Analytics is Costly

You might be wasting money if you’re sitting on a heap of useful data and aren’t analyzing it because you’re afraid of investing in advanced analytic tools. Your data is your most valuable resource for uncovering answers to your potential questions by properly processing your history. 


Many Enterprises Resource Planning (ERP) systems quickly integrate with external services that are both dependable and cost-effective. When you are likely to afford less time doing the hard work and more time understanding the report findings, the rewards can quickly outweigh the costs. 

Deployment takes Time

Yes, some technology takes a long time to get up and running. Running out the first ERP or switching to a new one is a lengthy process that can take months to complete, and that’s assuming everything goes smoothly. 


This is not the case for advanced analytics. Many of these systems can be set up in a matter of hours, if not minutes, and begin crunching the data right away. 

Complex to Understand

Although advanced analytics was developed to use complex formulas and equations, they are used to provide the end-user with data that is simple to understand. In reality, several advanced analytics user interfaces are built to help people from all walks of life use data to search for information. 


Enterprise solutions can also assist users in learning techniques by assisting them in selecting and processing appropriate data from a variety of sources. The end-user’s experience will be simple to navigate, regardless of the technicality of what advanced analytics might be doing in the context. 


This allows sellers more versatility and, in certain cases, provides new business possibilities (via Amazon or eBay, for example), but that also makes it more difficult to get a clear picture of product revenue across platforms. When businesses use the automated reporting tools offered by each e-commerce platform provider, they get a much-distorted vision of their online business. Business executives will obtain consistent visibility into all their sales operations, through all sales channels, including e-commerce, by putting data together under one platform and then validating it so that it offers an apples-to-apples comparison. 

Still Having Doubts?

If you’re still having doubts about using advanced analytics even after clearing out the assumptions, we are here to clear them out. 


Begin by gathering the information you’ll need to examine. For your business, this may have been a time-consuming process in the past. Data is stored in an ERP (or two) as well as other diverse relational databases that don’t always get along. As a result, putting together the data could have required many data backups and several hours of manipulation to get it into the format you need. If the data changes during this phase, for example, if you receive a late invoice payment that still counts against the month you’re working on, you’ll have to restart the whole process. 


Using Global Data 365’s finest reporting systems, you can connect data from more than 140 ERPs and EPMs, as well as other relational databases, into one automatic report that lives inside the framework of Excel or displays in a readily available web-based dashboard. Dynamic links are used in our solutions to extract real-time data from your ERP, connect it to other sets of data, and deliver the accurate reports you require based on safe and simple-to-assemble parameters. 


With one click, you can check your reports. Return information for a single account, a collection, or a wildcard quest. It’s all designed to offer users quick and easy access to their data so they can spend less time figuring out what is going on and more time predicting the future. 

Get 30 days free license for Jet Reports

Share this blog on:

Search Blog

About Us

Global Data 365 is composed of highly skilled professionals who specialize in streamlining the data and automate the reporting process through the utilization of various business intelligence tools.

Follow us on:

Still using Jet Basics?

Get Free Upgrade to Jet Reports

jet services

Subscribe to Our Newsletter

Overcome Your Fear of Advanced Analytics Read More »

Power BI with Jet Analytics

Power BI with Jet Analytics

Power BI with Jet Analytics

Business intelligence is a much better and less expensive choice than data warehousing for 90% of small to mid-size businesses. Both systems used together; Power BI with Jet Analytics have the same overall goal: to improve data analysis. The immense effort and cost needed to define the data tables and relationships required to drive analytics put data warehousing out of reach for most businesses. Due to the extreme minimal effort and expense needed to get it up and running, business intelligence is becoming the choice of small to mid-size companies, irrespective of which of the two most popular options are used.


Jet Analytics from insightsoftware (previously Jet Global) and Power BI from Microsoft are the two most popular business intelligence options in the Microsoft Dynamics environment. Jet Analytics can use either Excel or Jet Reports as a reporting tool, allowing you to have the best experience. Jet Analytics uses pre-defined data cubes to describe the patterns in the data necessary for reporting. Because the table relationships required for accounting, which are focused on financial processes, are not always the same as those required for business analysis, which could be more operational, this method works. This method has many disadvantages, including a higher initial cost, more work to create new data relationships into the data cubes, and the fact that data is only as current as of the last update.


A major benefit is the simplicity with which new reports can be created if they match the data cubes, as well as the improved accuracy since the reports are run against a replica of the output database rather than the live database itself. Data can be processed into data cubes from various sources, not all accounting systems.

Benefits of Using Power BI with Jet

Power BI depends on one or more databases to provide real-time or near-real-time data. This means that data is updated in real-time, but output for more detailed reports will not be optimal. Almost any form of the report can be created and distributed through the web or mobile devices. Every consumer can create their own dashboards, each with its own unique insight. It is possible to set up alerts. The details behind the reports can be drilled down by users. To use Power BI, you will need an Office 365 subscription.


You cannot really go wrong anyway. Invest a little more upfront to identify data relationships using data cubes in Jet Analytics or subscribe to Office 365 and use Microsoft BI Power to provide your users real-time access to important analytical data. To explore more about these better, less expensive alternatives for your company, we offer 30 days free trial license for you to test it on your very own database or get a personalized training for yourself.

Get a Free Demo of Power BI with Jet Analytics!

Share this blog on:

Search Blog

About Us

Global Data 365 is composed of highly skilled professionals who specialize in streamlining the data and automate the reporting process through the utilization of various business intelligence tools.

Follow us on:

Want to try Jet Analytics?

Integrate Power BI with Jet Today!
Jet Analytics Hero Section

Subscribe to Our Newsletter

Power BI with Jet Analytics Read More »

Optimize Processes with Data Visualization

Optimize Processes with Data Visualization

Optimize Processes with Data Visualization

Every aspect of a company relies on making prompt, well-informed decisions. Data is at the center of the financial services sector. Traditional business intelligence (BI) methods aren’t up to the task with so much data to rummage through. These techniques were designed for tabular reporting and can only handle small volumes of homogeneous data; they also require advanced technical expertise. Today’s software can process and interpret massive amounts of data in real-time, with a level of elegance previously unseen. By leveraging modern tools to optimize processes with data visualization, companies can transform complex datasets into actionable insights, enhancing decision-making efficiency across all departments. According to a report conducted by Gartner on the top priorities of CFOs, here’s what they looked at: 

– Enhancing Financial Analytics: 
Even after a 50% rise in financial analytics expenditure in the last three years, only a few businesses have advanced analytics capabilities. As analytics becomes a central responsibility of the finance department, this must change. 


– Reorganizing Finance Teams: 
Traditional approaches for coordinating and using finance teams are becoming less effective as the popularity of finance teams grows. To stay relevant, the department needs a shakeup from the top down. 


– Finance Technology Optimization: 
Finance teams must maximize the value of their ERP systems while also adopting newer innovations and planning to become more tech-savvy. If this isn’t done, the finance department will become less intelligent and agile. 


Any of those projects could keep a CFO busy for a year without yielding much progress. However, if such executives consider these problems analytically, realizing how the challenges and goals intersect, a surprising approach emerges, data visualization. 

Data Visualizations

There has almost certainly been some kind of data visualization for as long as there has been data. Charts and graphs have recently become commonplace in business due to Excel spreadsheets. Users soon realized that visual interfaces help them understand complex information. Instead of manually examining a spreadsheet, they could quickly recognize the key takeaways by looking at a pie chart. Digital visualizations provided the finance team with a unique outlook on data and a game-changing method for decision-making, compared to what was previously available. 


Today, visualizations have taken yet another step forward, possibly the most important yet. Advanced visualization features are included in today’s top financial reporting tools, which run on top of ERP and beyond the constraints of Excel. Such visualization tools do more than improve on what has come before; they turn the relationship between the finance team and the data on which it relies more highly than it has ever been. 

Advances in Data Visualizations

So, what’s the difference? To begin with, visualizations have progressed well beyond basic graphs and maps. They can now visualize data in new systems that provide more context and information. Users can view the optimal visualization to encompass the data rather than trying to settle for a sufficient option with this enlarged toolkit at their disposal. 

After you have made that decision, creating the visualization is nearly seamless. It only takes some clicks to move data from one area to another in several cases, rather than a lengthy manual process. This not only saves time and eliminates mistakes, but it also helps everyone inside or outside the finance department to create their own visualization without any need for advanced training. 

Lastly, and perhaps most critically, visualizations have moved to the foreground of decision-making. The finance members can quickly integrate them into financial reports and structure them to optimize the insights they contain as well as the ease with which they can be extracted. The design features within such reports are also not static. They update themselves as new information becomes available, making them more like interactive indicators that monitor key metrics in real-time than visualizations.

In addition to finance, operational and supply chain management teams benefit from these dynamic features. Inventory dashboards, for example, provide real-time insights into stock levels, supplier performance, and demand forecasting. This allows organizations to streamline their operations, reduce costs, and make informed decisions across departments. Integrating financial reports with operational data ensures a comprehensive view of business health, enhancing decision-making at both the strategic and operational levels.. 

Everything in today’s visualizations is vastly superior to previous versions. Despite this, it’s always easy to underestimate their effect on the economy. The CFO, the finance team, and the company are all involved. 

Using Data Visualizations to Optimize Processes

Data visualizations not only help people view data in new ways, but they also help them see it more clearly, presenting insights, opportunities, and challenges that would otherwise go unnoticed. 


One form of data visualization does this is by compressing large volumes of data into a readily available layout. Financial reports influence decision-making, but in the past, they were either too simple to show anything of value or too difficult to stir up an action. Today’s visualizations bridge the gap, allowing reports to include what decision-makers need to know while still revealing those insights in real-time. 


Advanced data visualizations also allow F&a to investigate financial data on their own terms. Decision-makers know what knowledge they want better than everyone else, and once it’s simple to find it and visualize it as needed, understanding differences disappear. To look at it another way, visualizations open a vast array of nuanced financial data to the point that it can be explored. Anyone interested in delving deeper into the data now has a great starting point. 


Visualizations help practitioners outside finance grasp a topic that can be perplexing to the general reader, in addition to CFOs. Executives and heads of departments need to consider how their decisions impact the company’s finances on a micro and macro level, but many lack the knowledge to do so from a dense spreadsheet presenting a financial report. However, when presented with visualizations, the material emerges in a manner that everyone can comprehend. As a result, financial knowledge grows across the board, helping companies optimize processes with data visualization for better decision-making.

Data Visualizations: a Modern Solution

Finance teams will use innovative data visualizations to make significant progress on every one of 2021’s top priorities. Once implemented, analytics improve dramatically, accountants spend less time manually processing data, and the ERP ceases to be a barrier to understanding. 


Global Data 365 offers visualization tools to optimize finance processes. In terms of usability, precision, and variety, these resources far exceed what you’ve come to expect from Excel. Even better, they’re just one of many features available in purpose-built financial reporting tools that are designed to work with today’s most common ERPs. 


If you’re searching for a new perspective on data, we offer a comprehensive upgrade. To see how this all operates, request a free demo today. 

Talk to Our BI Experts!

Share this blog on:

Search Blog

About Us

Global Data 365 is composed of highly skilled professionals who specialize in streamlining the data and automate the reporting process through the utilization of various business intelligence tools.

Follow us on:

Unlock Power of Data Visualization with Power BI

Get started with a free consultation today!

power bi dashboard

Subscribe to Our Newsletter

Optimize Processes with Data Visualization Read More »

Cash Flow Analysis with Microsoft BI

Cash Flow Analysis with Microsoft BI

Cash Flow Analysis with Microsoft BI

With the advancement in technology, it is more important than ever to understand how cash flow analysis will affect your company and how technology, such as business intelligence (BI), can help you keep track of your cash. 

What is Cash Flow Analysis?

Financial reporting requires the use of cash flow analysis. You can tell where cash is produced and invested by looking at your company’s cash inflows and outflows over time so you can prepare accordingly. Controlling your cash will help your company not only stay afloat through difficult times but also open gates to new opportunities. 


Have you had a profit or a loss? Cash flow is important at any point of a company’s development cycle, whether you’re a new start-up or an existing company. Anything you do requires money, from managing assets to hiring a new employee. To achieve security and consistency, you must have the right tools and structures in place at the right time to help you manage and predict your cash flow. 

Different Approaches to Cash Flow Analysis

At the end of each quarter, most accounting teams are responsible for conducting a cash flow analysis to determine that all the company’s expenses are taken into account. 


Free Cash Flow (FCF) is among the most valuable financial performance indicators. Experts look at FCF or operating cash flow minus capital expenditures to determine how much money a business has left over to broaden or return to shareholders. You have an issue if your expenditure exceeds your income. 


A cash flow statement is a crucial tool for managing cash flow, and it contains data from operations, investing, and financing. A cash flow statement is traditionally created to use Excel-based manual data analysis. It can be difficult to combine data from your cash flow analysis, expected and real operating expenses, capital expenditures, accounts receivable/payable balances, and general ledger data. Excel costs time and money. Identifying the ramifications, many businesses have simplified manual accounting processes and adopted business management and intelligence technologies to better analyze and predict cash flow. 

Cash Flow Analysis with BI

Companies have embraced business intelligence technology to change the way they handle their cash flow now that the platform is more available and affordable. Companies use business intelligence and analytics software to automate cash flow analysis and provide the tools they need to analyze data optimize cash flow analysis, and more. 


Review the Jet Sample: Cash Flow Statement.


The best feature of business intelligence software is that it is designed to provide more precise financial statistics and, as a result, eliminate the guesswork from the cash flow analysis process. BI solutions provide managers with reports that are timely, reliable, and simple to use. 


Here are a few examples of how BI is assisting companies all over the world in better managing their cash inflows and outflows. 

- Intelligent Predictions

Financial predictions enable you to prepare for the allocation of resources and budgeting by providing a clear way to make strategic business decisions. Cash predictions can be generated automatically using BI software. Financial managers can remain updated with this ability, including advanced warnings of cash shortages or surpluses. This enables a business to respond rapidly to growth potential or to cut back when necessary. 

- Data Management

Assembling data from various sources is the most time-consuming aspect of cash flow analysis by spreadsheet. You will get the figures you require in real-time using BI software that combines with your ERP and CRM solution. The cash flow analysis will provide more useful insights and up-to-date reports, allowing you to make fast, data-driven decisions. 

- Manage Projects

Large projects may have a significant impact on cash flow. For cash flow development and proper development, financial managers need greater control of what goes in and what comes out, so the ability to analyse a project’s length, expenses, resources needed, and payment terms is critical. 

- Plan Inventory

There are some costs involved with the inventory. It not only binds up cash in goods but getting too much inventory can also be harmful to your cash flow. You will make a decent source of supply and be more careful with inventory spending with BI tools. In the long run, BI will save you a lot of time and money by sales forecasting and intelligent reporting. 

- Risk Management

Should you put money into a new venture? Should you temporarily reduce your spending? Risk management software such as BI software is a reliable tool. If you have a cash flow problem, if your prediction indicates that you may not have enough cash, a BI solution will enable you to perform a fast prediction and liquidity analysis to assist you in making the best decision possible. 

BI Solution

BI tools help data-driven analysis and decision-making, which is just what you need to keep a tight grip on your cash flow. Although there are many BI solutions available today, particularly for Microsoft Dynamics users, there is no such thing as a “one-size-fits-all” solution. 


We are here to assist you if you want to improve your financial statements and cash flow review. Contact us today! 

Talk to our BI Experts!

Share this blog on:

Search Blog

About Us

Global Data 365 is composed of highly skilled professionals who specialize in streamlining the data and automate the reporting process through the utilization of various business intelligence tools.

Follow us on:

Interact Live with Dashboards

Increase efficiency and deliver success now with Microsoft Power BI. Enjoy a 20% discount on all Power BI services.

dashboards

Subscribe to Our Newsletter

Cash Flow Analysis with Microsoft BI Read More »

Talk to Our BI Experts!
Get an Instant Demo!