Financial Reporting and Accounting: Turning Data into Business Insight
- Ayesha Binte Habib
In today’s data-driven economy, financial reporting and accounting are more than just compliance functions, they are the core of business intelligence. From small startups to multinational corporations, every organization relies on accurate financial data to make informed decisions, assess performance and plan for the future.
Yet, while accounting records the financial heartbeat of an organization, financial reporting gives that data meaning, transforming figures into insights that drive growth.
Understanding the Foundation: What Is Accounting?
Accounting is often referred to as the language of business and rightly so. It is the systematic process of recording, classifying and summarizing financial transactions to provide an accurate picture of a company’s financial position.
At its core, accounting involves:
Recording transactions such as sales, purchases, and expenses
Maintaining ledgers and journals
Managing accounts receivable (AR) and accounts payable (AP)
Ensuring compliance with financial standards (GAAP or IFRS)
Accurate accounting ensures that financial data is reliable, consistent, and ready to be analyzed, serving as the foundation upon which financial reports are built.
What Is Financial Reporting?
If accounting is about recording data, financial reporting is about communicating it.
It’s the process of organizing accounting data into structured statements and reports that reflect a company’s performance and financial health.
The most common reports include:
Balance Sheet: Shows assets, liabilities, and equity — a snapshot of what the company owns and owes.
Income Statement (Profit & Loss): Highlights revenue, expenses, and profit over a specific period.
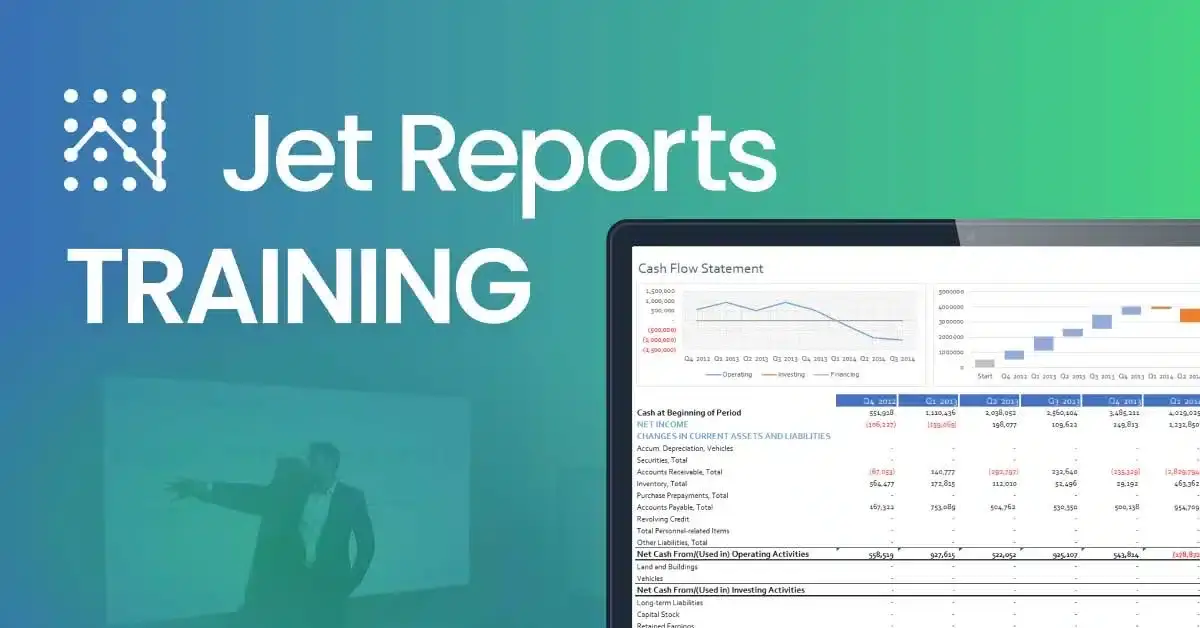
Cash Flow Statement: Tracks how cash moves in and out of the business.
Statement of Changes in Equity: Displays how owners’ equity changes over time.
These reports enable stakeholders — management, investors, creditors, and regulators — to evaluate profitability, liquidity and stability.
Accounting vs. Financial Reporting: Two Sides of the Same Coin
Though the terms are often used interchangeably, accounting and financial reporting serve different purposes.
| Aspect | Accounting | Financial Reporting |
|---|---|---|
| Purpose | Records financial transactions | Communicates financial performance |
| Focus | Day-to-day bookkeeping and accuracy | Periodic summaries and insights |
| Users | Internal teams (finance, operations) | Internal & external stakeholders |
| Timing | Continuous | Periodic (monthly, quarterly, annual) |
In short, accounting builds the foundation, while financial reporting tells the story. A well-structured reporting process ensures that data captured through accounting turns into actionable intelligence.
Why Financial Reporting Matters?
Modern financial reporting is far more than producing statements for compliance, it’s about enabling decision-making.
Some key benefits include:
Strategic Decision Support:
Reports reveal trends in profitability, costs, and growth areas.Transparency & Compliance:
Helps meet regulatory standards and build investor confidence.Performance Evaluation:
Managers can assess departmental efficiency and ROI.Forecasting & Planning:
Historical data helps predict future cash flows and budgets.
Without consistent reporting, organizations risk flying blind — unable to measure success or identify issues early.
From Ledgers to Dashboards: The Evolution of Financial Intelligence
Traditionally, finance teams relied on spreadsheets and manual reports to analyze data. Today, however, the landscape has transformed.
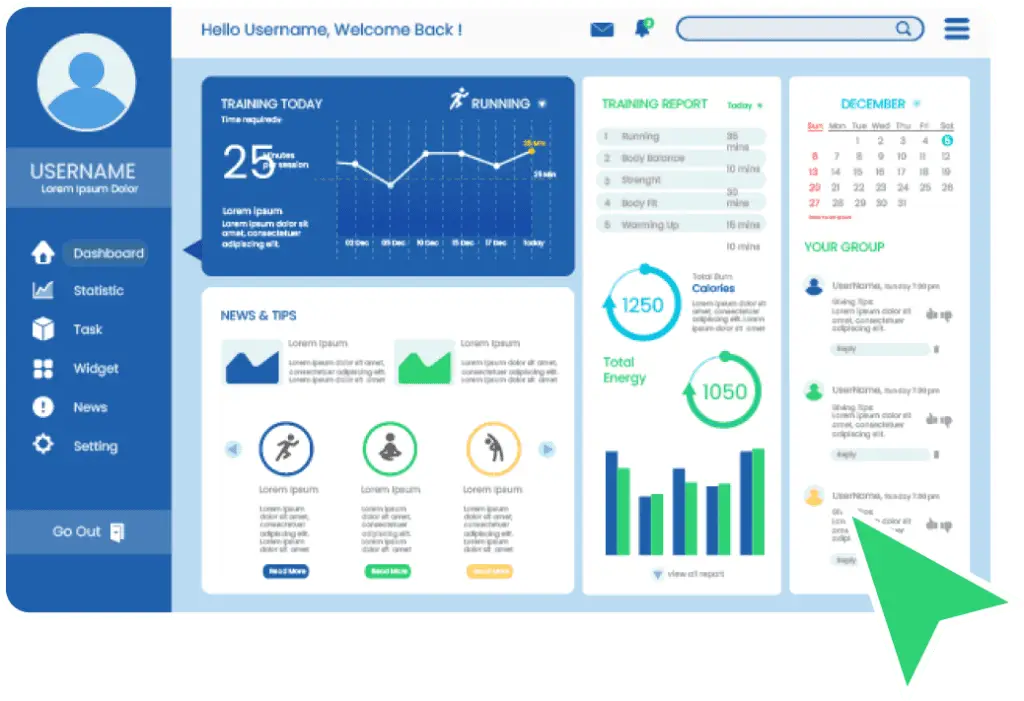
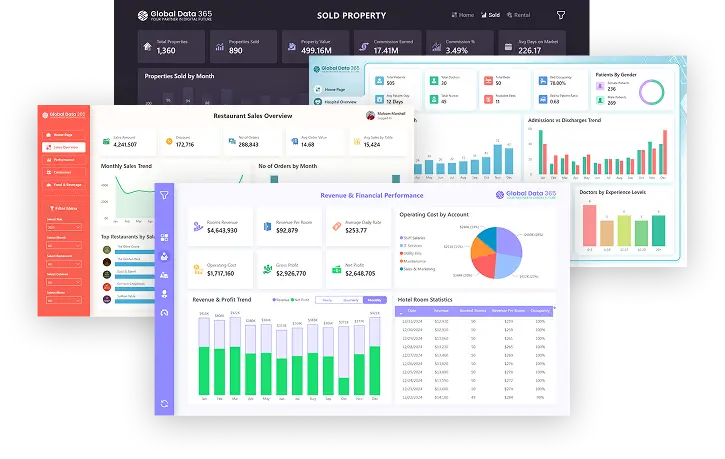
With advanced tools and platforms, companies are moving from static statements to real-time financial dashboards that integrate accounting data and visualize it for faster, smarter decision-making.
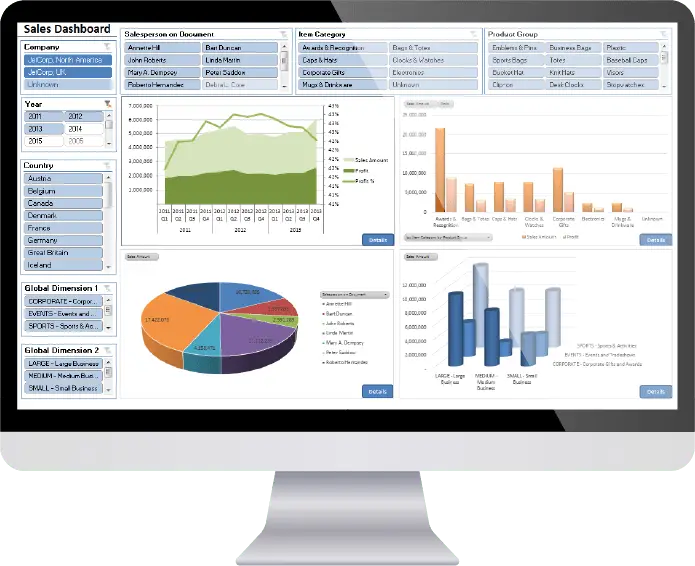
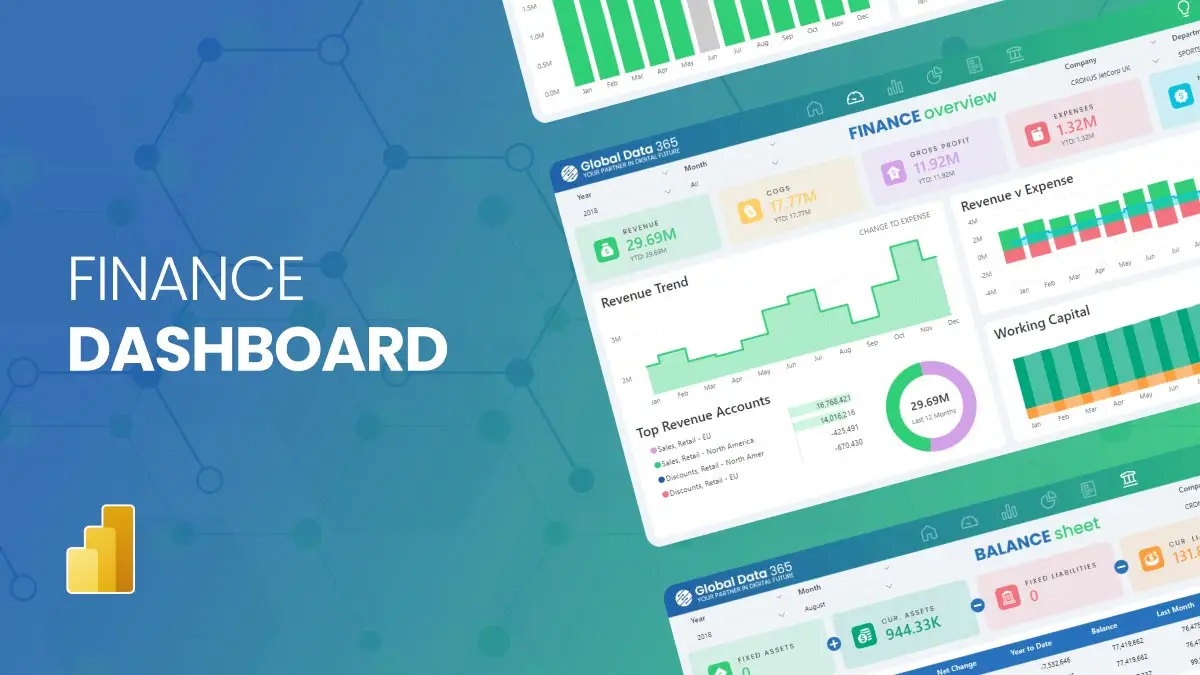
A Finance Dashboard allows businesses to:
Track revenue, expenses, profit and key KPIs in real time
Compare financial performance across months, quarters or departments
Visualize cash flow trends, cost distribution and profitability ratios
Identify financial risks before they escalate
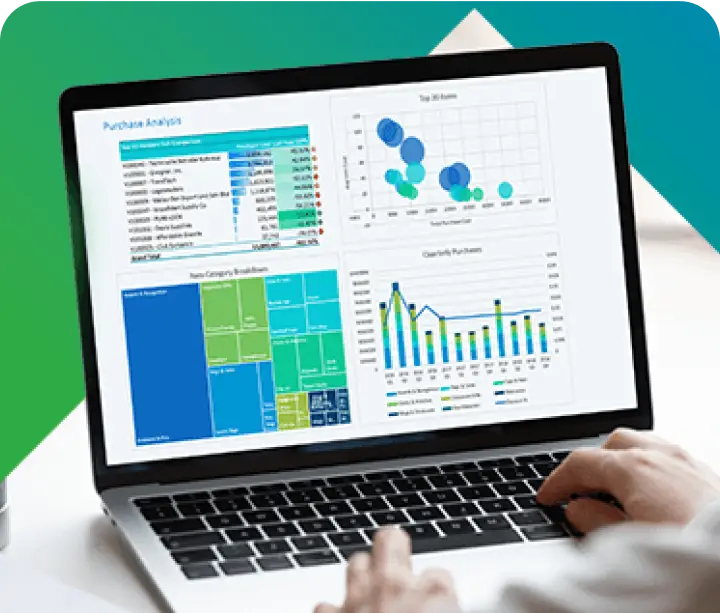
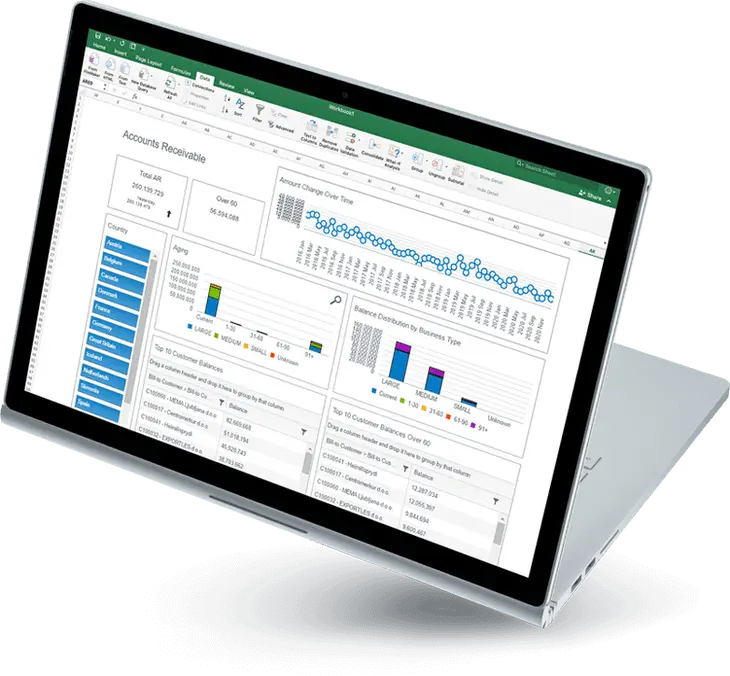
Meanwhile, Accounts Receivable and Payable Dashboards bring additional clarity to cash flow management; providing insights into collections, overdue invoices and upcoming liabilities.
Together, these dashboards transform financial data from static numbers into live insights that empower decision-makers.
The Role of Accounting in Modern Dashboards
For any financial dashboard to be effective, it needs accurate and timely accounting data. Every entry made in the books, from sales invoices to expense receipts, flows into the reporting system.
Here’s how this integration typically works:Accounting Data → Financial Statements → Dashboard Visualization → Business Insights
This process ensures that dashboards display up-to-date information, helping finance leaders make proactive decisions instead of reacting after the fact.
Best Practices for Effective Financial Reporting
To make financial reporting meaningful and accurate, businesses should focus on these best practices:
Maintain Data Integrity:
Ensure accounting entries are correct and consistent across systems.Automate Where Possible:
Reduce manual errors and save time through automation tools or BI integration.Standardize Reporting Formats:
Use consistent templates and metrics (e.g., gross margin %, operating income).Use Visual Reporting:
Replace long tables with dashboards for faster interpretation.Monitor Key Financial KPIs:
Gross Profit Margin
Return on Assets (ROA)
Current Ratio
Days Sales Outstanding (DSO)
Accounts Payable Turnover
Combine AR & AP Insights:
Understanding both receivables and payables provides a true picture of liquidity and cash flow health.
Common Challenges and How to Overcome Them
Despite its importance, financial reporting faces several challenges:
Data Fragmentation:
Information scattered across multiple systems or departments.Manual Processes:
Spreadsheets prone to error and version control issues.Delayed Reporting:
By the time reports are finalized, the data may already be outdated.Limited Visualization:
Numbers without context hinder understanding.
Solutions:
Use centralized reporting systems or BI dashboards.
Integrate accounting and ERP data sources for consistency.
Automate data refresh and reporting cycles.
Adopt visual storytelling, turning data into actionable narratives.
The Future of Financial Reporting
The next era of financial reporting is data-driven, real-time and predictive.
As artificial intelligence, machine learning, and automation continue to evolve, finance teams will move beyond reporting what happened to predicting what will happen next.
Dashboards will become more interactive, self-updating and intelligent, automatically flagging anomalies, forecasting trends and offering recommendations.
Organizations that embrace this transformation will enjoy:
Faster decisions through real-time data
Greater accuracy via automation
Improved collaboration across finance, sales, and operations
Final Thoughts
Accounting captures the details. Financial reporting gives them meaning. Dashboards bring them to life.
By blending these three dimensions, organizations can move from manual bookkeeping to strategic financial intelligence, where every number tells a story and every report drives action.
In a world where business speed defines success, the future of finance lies not just in reporting the past but in visualizing the future.
Ready for Smarter Industry Decisions? Let’s Talk
Search Blog
Related Resources

Accounts Receivable vs Accounts Payable

Why Power BI is a Better Choice than Excel for Analytics

Business Intelligence with Power BI: Unlock Data Insights
Subscribe to Our Newsletter
Financial Reporting and Accounting: Turning Data into Business Insight Read More »