Key Features of CRM (Customer Relationship Management)

- Global Data 365
In today’s competitive business world, building and maintaining strong customer relationships is the foundation of success. Organizations need a powerful and flexible Customer Relationship Management (CRM) system that not only helps manage customer interactions but also drives productivity and growth. Microsoft Dynamics 365 CRM, a part of the Microsoft Dynamics 365 suite, is designed to do just that offering intelligent tools to streamline sales, service, marketing, and beyond. Let’s explore in detail the key features of Dynamics 365 CRM that can help your organization strengthen relationships, improve efficiency, and achieve business excellence.
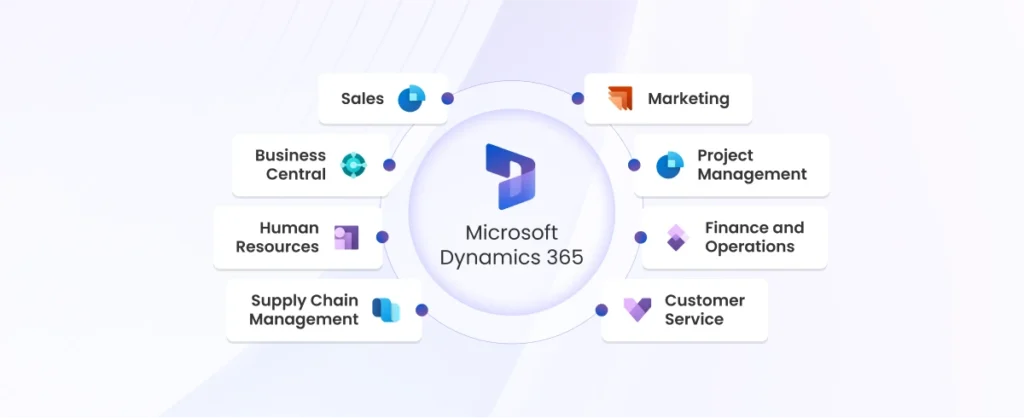
Introduction to Microsoft Dynamics 365 CRM
Microsoft Dynamics 365 CRM is a cloud-based solution that unifies customer data, automates key processes, and empowers teams to deliver exceptional customer experiences. From tracking leads to resolving customer issues and optimizing marketing efforts, Dynamics 365 CRM provides everything businesses need to nurture relationships and drive growth, all from a single, integrated platform.
By combining insights, automation and AI-driven intelligence, it helps organizations move beyond transactional interactions to build long-lasting customer trust and loyalty.
Key Features of Microsoft Dynamics 365 CRM
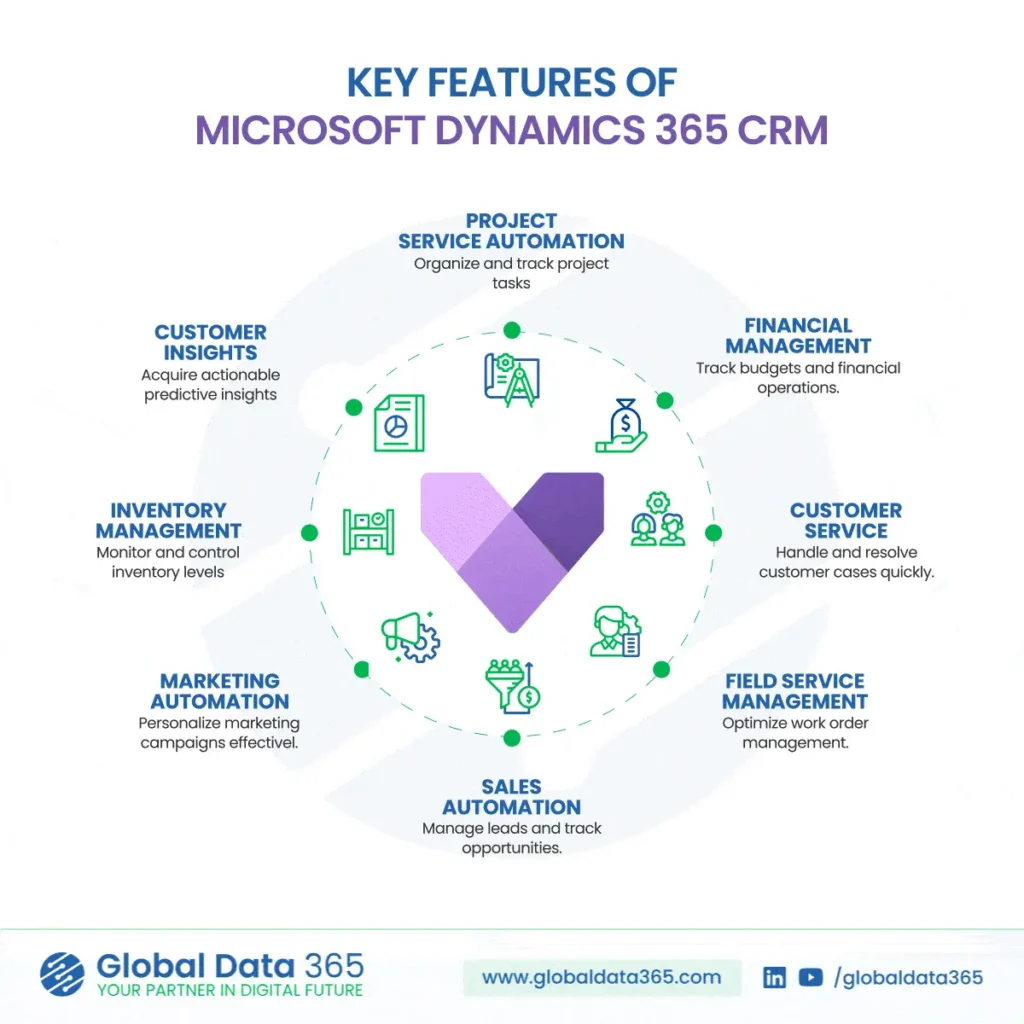
1. Project Service Automation
Efficient project management lies at the heart of business success. Dynamics 365 CRM simplifies how organizations organize, track and deliver projects on time and within budget.
Create and manage project tasks and milestones.
Track resource allocation, costs, and progress in real time.
Improve collaboration between teams and ensure project transparency.
With integrated automation and analytics, businesses can achieve higher accuracy, better forecasting, and greater customer satisfaction.
2. Financial Management
Dynamics 365 CRM allows organizations to maintain tight control over financial operations and ensure data-driven decision-making.
Track project budgets and monitor financial performance.
Automate billing, invoicing, and payment tracking.
Gain real-time visibility into revenue streams and expenses.
By integrating with other Dynamics 365 applications, such as Business Central, businesses can achieve a unified financial and operational ecosystem that enhances profitability and control.
3. Customer Service Management
Customer satisfaction is crucial for retention and growth. Dynamics 365 CRM empowers service teams to handle and resolve cases quickly and efficiently with tools designed for superior customer support.
Manage and assign customer cases automatically.
Access complete customer histories for personalized service.
Utilize AI-driven insights to predict issues and recommend solutions.
The result: faster resolutions, improved satisfaction, and stronger customer loyalty.
4. Field Service Management
For organizations that rely on field operations, Dynamics 365 CRM offers tools to optimize work order management and deliver seamless field service experiences.
Schedule and dispatch field technicians efficiently.
Track job progress and resource utilization in real time.
Enable mobile access for on-site teams to update information instantly.
This ensures consistent service quality, reduced downtime, and enhanced productivity across all service locations.
5. Sales Automation
Sales teams thrive on clarity, collaboration and actionable insights. Dynamics 365 CRM automates sales workflows to help you manage leads and track opportunities from prospect to close.
Capture, nurture, and score leads automatically.
Track pipeline performance and forecast revenue accurately.
Collaborate seamlessly with real-time customer data.
By providing a complete view of every customer interaction, sales teams can focus on what matters most — building relationships and driving conversions.
6. Marketing Automation
Personalized engagement is key to successful marketing. With Dynamics 365 CRM, marketers can plan, execute and measure campaigns with precision.
Segment audiences and deliver targeted campaigns.
Automate email journeys and nurture leads efficiently.
Analyze campaign performance with real-time dashboards.
Marketing Automation ensures that every campaign feels personal, relevant, and impactful — driving stronger brand connections and better ROI.
7. Inventory Management
Even within CRM, operational visibility matters. Dynamics 365 CRM allows businesses to monitor and control inventory levels to meet customer demand efficiently.
Track stock levels and item availability in real time.
Automate reorder processes to avoid shortages or overstocking.
Integrate with supply chain systems for end-to-end visibility.
This level of transparency helps maintain smooth order fulfillment and enhances customer trust.
8. Customer Insights
Every interaction tells a story and Dynamics 365 CRM helps you listen. With Customer Insights, businesses can leverage AI and analytics to uncover patterns, predict behavior and personalize engagement.
Analyze customer journeys and buying trends.
Build unified customer profiles from multiple data sources.
Deliver predictive recommendations to sales and service teams.
By turning raw data into actionable insights, organizations can anticipate customer needs and exceed expectations.
In Conclusion
Microsoft Dynamics 365 CRM offers more than just customer management it’s a complete solution that empowers organizations to build meaningful relationships, improve operational efficiency, and make smarter business decisions. From sales and service automation to marketing intelligence and project management, its powerful features of CRM transform how you connect with customers.
By leveraging its integrated capabilities, your teams can work more collaboratively, respond faster, and deliver personalized experiences that drive loyalty and growth. Microsoft Dynamics 365 CRM enables you to streamline your processes, enhance customer satisfaction, and accelerate business success making it the ultimate tool to strengthen your organization’s relationship with customers and achieve long-term growth.
Transform your customer relationships with Dynamics 365 CRM
Search Blog
Related Resources

What is CRM (Customer Relationship Management)?

How To Automate Reporting From Dynamics GP?
Subscribe to Our Newsletter
Key Features of Microsoft Dynamics 365 CRM: Transforming Customer Relationships Read More »