microsoft dynamics

Business Central vs Finance and operations

Business Central vs. Finance and operations

Business Central vs Finance and operations

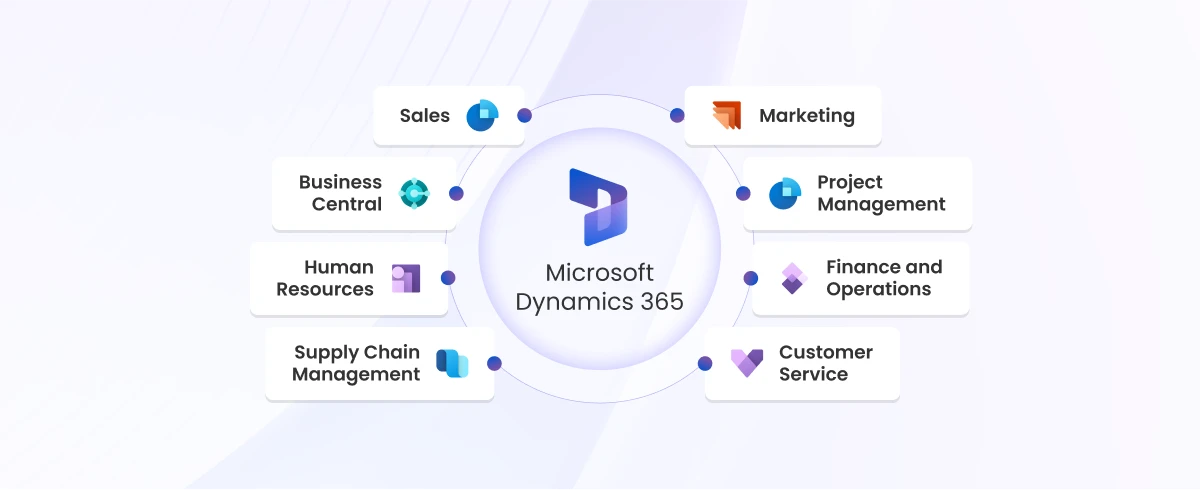
Microsoft Dynamics 365 offers a range of powerful business management solutions, each tailored to meet the specific needs of different types of businesses. Two of the most popular offerings in the Dynamics 365 suite are Business Central and Finance and Operations.

Key Differences: Business Central vs. Finance and Operations

While both solutions are designed to help businesses manage their operations more effectively, there are some key differences between the two. In this blog post, we will help you to explore detailed differences for Business Central vs. Finance and Operations to help you determine which solution is right for your business.

Functionality

D365 Business Central

 D365 Finance and Operations

Microsoft Positioning

Business management solution for small and medium-sized businesses, offering tools to manage finances, operations, sales, and customer service effectively.

Solution for medium to large enterprises with complex business processes, offering advanced financial and operational management capabilities

Type of Companies

Ideal for small and medium-sized businesses across various industries

Geared towards medium to large enterprises with complex business processes

Customization and flexibility

Flexible and customizable for different industries, enabling operational excellence and digital transformation.

Suitable for a wide range of industries including manufacturing, retail, distribution, and services, providing tailored solutions for complex business processes.

Depth of Manufacturing

Offers robust manufacturing functionality, including production planning, shop floor control, and quality management, suitable for managing manufacturing processes effectively.

Provides deep manufacturing functionality supporting various modes like make-to-stock, make-to-order, and assemble-to-order, along with advanced features

Capabilities and Integration

Provides comprehensive capabilities for financial management, sales, and customer service, integrating seamlessly with other Dynamics 365 components for a unified platform.

Offers advanced capabilities for managing financials, supply chain, manufacturing, and operations, seamlessly integrating with other Dynamics 365 components

Minimum Number of Users

1

20

License Cost

$70 to $100 per user / month

$115 to $210 per user / month

Availability

 Available as a cloud-based solution in 33 countries

Available as a cloud-based solution in 140 countries

Localization

 localized to comply with regulatory requirements of different countries and regions, making it suitable for global operations.

Localized to comply with the regulatory requirements of different countries and regions, ensuring compliance and ease of use in various markets.
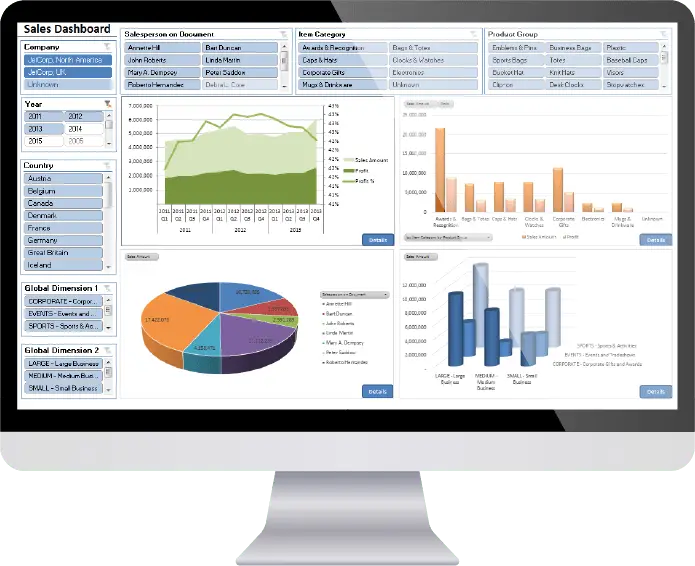
Business Analytics

Provides powerful analytics capabilities, offering insights into operations and supporting informed decision-making.

Offers advanced business analytics capabilities, providing valuable insights into operations and enabling informed decision-making across the Organization.

Scalability

Scalable to accommodate business growth, allowing for easy expansion of operations as the business expands.

Scalable to support business growth, enabling organizations to expand their operations easily as their business grows.

Deployment

Offers flexibility in deployment options, including cloud-based deployment for ease of access and management.

Provides flexibility in deployment options, including cloud-based deployment for improved accessibility and management

In Conclusion

In conclusion, Business Central vs. Finance and Operations are both powerful business management solutions, each offering unique functionalities tailored to meet the specific needs of different types of businesses.


While Dynamics 365 Business Central is ideal for small and medium-sized businesses looking for a comprehensive and cost-effective solution, Dynamics 365 Finance and Operations is more suited for medium to large enterprises with complex business processes and a need for advanced financial and operational management capabilities. Whether you’re a small retail business or a large manufacturing enterprise, Microsoft Dynamics 365 has the right solution to help you streamline your operations, improve efficiency, and drive growth.

Choose the Right Solution for Your Business Needs!

Share this blog on:

Search Blog

About Us

Global Data 365 is composed of highly skilled professionals who specialize in streamlining the data and automate the reporting process through the utilization of various business intelligence tools.

Follow us on:

Want to try Jet Analytics?

Get Free License for 30 Days

Jet Analytics Hero Section

Subscribe to Our Newsletter

Business Central vs. Finance and operations Read More »

Microsoft 365 Copilot

Microsoft 365 Copilot: Revolutionizing Your Productivity

Microsoft 365 Copilot

In the ever-evolving landscape of digital productivity tools, Microsoft 365 stands tall as a comprehensive suite that empowers businesses worldwide. Among its many offerings, Microsoft 365 Copilot emerges as a transformative solution, promising to revolutionize the way organizations manage their Microsoft 365 environment.

What is Microsoft 365 Copilot?

Microsoft 365 Copilot is a revolutionary management tool designed to simplify the administration of Microsoft 365 services including those crucial for customer relationship management (Microsoft Dynamics 365 CRM), finance and operations (Microsoft Dynamics 365 F&O), and business central management (Microsoft Dynamics 365 BC).

It comprises three main components: Microsoft 365 apps (like Word, Excel, Teams), Microsoft Graph (incorporating files and data across the M365 environments), and OpenAI models (including ChatGPT-3, ChatGPT-4, DALL-E, Codex, and Embedding), all hosted on Microsoft Azure. Unlike traditional management methods, Copilot offers a more efficient and streamlined approach, allowing organizations to focus on their core business activities.

Microsoft 365 Copilot Features:

The Copilot offers many features for vast business community such as;

  • Effortless Automation: Microsoft 365 Copilot improves productivity by automating repetitive tasks and workflows, allowing employees to focus on more strategic initiatives.
  • Reduced Cost and optimizing Resources: It helps organizations save costs and optimize resources by streamlining Microsoft 365 management processes.
  • AI-powered insights: It leverages AI to unlock valuable insights from your Dynamics 365 state. Gain real-time customer behavior trends in Dynamics 365 CRM or identity financial optimization opportunities in Dynamics 365 F&O.
  • Streamlined Collaboration: Microsoft 365 Copilot fosters seamless collaboration within Dynamics 365 applications. Imagine teams working together on sales proposals in Dynamics 365 CRM or project plans in Dynamics 365 Business Central with real-time edits and suggestions.
  • Enhanced Security: It empowers businesses to maintain robust security within Dynamics 365. Leverage advanced monitoring and threat detection to keep your data safe.

Microsoft 365 Copilot

How Much Does Microsoft 365 Copilot Cost?

Microsoft 365 Copilot is available as part of the Microsoft 365 Enterprise subscription, which offers a range of plans tailored to meet the needs of businesses of all sizes. The cost of Copilot varies depending on the specific plan chosen, with pricing starting at $30 per user per month for the basic plan. Find how Microsoft Dynamics transform your business with: Microsoft 365. Future plans include tailored Microsoft 365 Copilot for Dynamics 365, Power Platform, security suite, and Windows OS.

How many Modes of Interaction are in Copilot?

  • Microsoft 365 Copilot system offers two main interaction modes: Direct engagement within applications like Word and Teams, and accessibility through Microsoft 365 Chat in Teams
  • Within applications, users seamlessly integrate M365 Copilot for tasks like drafting documents and summarizing meetings in real-time.
  • The second method of interaction is through Microsoft 365 Chat, functioning as a chatbot within Teams. Microsoft 365 Chat serves as a versatile tool for natural language interactions, enabling users to search across diverse sources.
  • Microsoft 365 Copilot enhances productivity in Word by offering text suggestions, facilitates collaboration in Teams with real-time meeting summaries, and streamlines PowerPoint presentations.
  • In addition to automation, Microsoft 365 Copilot also provides advanced monitoring and reporting capabilities, allowing you to keep track of service health and performance metrics. This information can help you identify potential issues before they escalate, ensuring that your Microsoft 365 copilot environment remains stable and reliable.

In Conclusion

Copilot is a transformative tool that empowers businesses to unlock the full potential of Dynamics 365. With its innovative cutting-edge functionality and user-friendly interface, Copilot is empowering teams to collaborate more effectively and achieve their goals efficiently. To experience the benefits of Microsoft 365 Copilot for your business and drive growth, contact us at Global Data 365 today. Our team is ready to help you leverage this powerful tool to take your productivity to new heights.

Get 30 days free license for Jet Reports

Share this blog on:

Search Blog

About Us

Global Data 365 is composed of highly skilled professionals who specialize in streamlining the data and automate the reporting process through the utilization of various business intelligence tools.

Follow us on:

Want to try Jet Analytics?

Get Free License for 30 Days

Jet Analytics Hero Section

Subscribe to Our Newsletter

Microsoft 365 Copilot: Revolutionizing Your Productivity Read More »

Management Reporter Jet Reports

Management Reporter vs Jet Reports

Management Reporter Jet Reports

Importance of Reporting Tools in Business Management

In today’s dynamic business environment, the significance of robust reporting tools cannot be overstated. Efficient financial reporting software and business intelligence reporting play a pivotal role in business management; aiding organizations to make informed decisions, monitor performance, and strategize for the future. Two prominent players in the reporting tools arena are Management Reporter vs. Jet Reports. 

What Is Management Reporter?

Management reports are essential components of business intelligence, providing a comprehensive overview of an organization’s financial performance. Management Reporter, a powerful financial reporting tool, stands out with its versatile report designer, enabling the creation of dynamic reports tailored to specific needs. 

We are going to give you three scenarios where a user should consider switching to Jet Reports or Jet Analytics: 

What is Jet Reports?

Jet Reports, on the other hand, is a dynamic business intelligence tool that goes beyond conventional financial reporting. With its user-friendly interface and Jet Dashboard Designer, organizations can leverage its capabilities for comprehensive financial reporting and analysis. Jet Reports is known for its adaptability and ease of use, making it an asset for businesses aiming to enhance their reporting processes. 

We are going to give you three scenarios where a user should consider switching to Jet Reports or Jet Analytics: 

Management Reporter vs. Jet Reports: 7 Key differences

Management Reporter (MR) is a standalone application from Microsoft that pulls data from Dynamics GP, while Jet Reports is an Excel add-in that pulls data into Excel from Dynamics GP. Jet Reports works with Microsoft Dynamics GP 9 (November 2005 release) and later. Both tools were designed specifically for working with Microsoft Dynamics data and integrated seamlessly with Dynamics GP, but between Management Reports vs. Jet Reports there are several key differences. 

- Building reports

MR reports are built in components one-by-one, starting with defining rows, then defining columns and trees, while Jet Reports are built in whole, not in components, cutting in half or more the time it takes to create a report. 

- Adding new accounts

When a new account is added in Dynamics GP, it must be manually added to Management Reporter. Due to the way MR is structured, not all data changes in Dynamics GP will be tracked on the change tracker and do not update the data mart, which is the tool that syncs MR with Dynamics GP. At times there might be hard coding involved to change how the data mart pulls data from Dynamics GP. However, Jet Reports can refresh data from Dynamics GP at any time, and new accounts will show up, without any hard coding or manually checking for new accounts. 

- Previewing reports

You cannot preview reports in MR, unless you assign a row to an actual report. In Jet Reports, you can easily toggle between design mode and report mode to check and see if the formatting and formulas you used are working as desired. 

- Data extractions

MR connects directly to your instance of Dynamics GP, however you can only create reports in MR using that data – you cannot pull from any other source. In contrast, Jet Reports allows you to pull data from numerous sources and consolidate it together, rather than just pulling data from Dynamics GP for building reports. Jet Reports can extract any data from Dynamics GP into Excel, and when the data refreshes, so does your pivot table. 

- Working in Excel

When building reports in MR, you can link to an Excel spreadsheet as a reference and pull in data from a spreadsheet. MR users often find themselves switching between MR and Excel when building reports to pull in data from different sources that might have been exported into Excel. With Jet Reports, you’re working directly inside Excel and can pull data from a variety of locations in addition to from Dynamics GP. This creates a smoother workflow and reduces the need to switch between applications to find the necessary data for a report or dashboard. Additionally, with designing Jet Reports inside Excel, you can take advantage of formatting options, copying and pasting, and other functionalities you are used to in Excel.

- Compatibility

The most recent version of MR reporter is Management Reporter 2012, last updated in 2014, and is compatible with Dynamics AX 2009 and 2012, Dynamics GP 2013 to 2018, and Dynamics SL 2011 and 2015. Jet Reports is regularly updated by insightsoftware, and is compatible with all Microsoft ERPs including Dynamics 365 products, Dynamics NAV, Dynamics GP, Dynamics AX, Dynamics CRM, and Dynamics SL. 

- Migrating to a newer ERP system

Dynamics GP is no longer supported by Microsoft and many companies realize they will eventually need to migrate to a newer ERP such as Dynamics 365 or choose a new ERP altogether. MR is not supported by newer Microsoft products, and as such, none of your reports built inside MR will migrate with you to a new system. On the other hand, all work completed in Jet Reports carries over into any ERP you choose since it is an independent platform and can pull data from any source; all you would have to do is update the data connectors. 

In Conclusion

In conclusion, while both Management Reporter and Jet Reports serve essential roles in the realm of reporting tools, but in the comparison of Management Reporter vs. Jet Reports the latter stands out as a superior choice for businesses aiming to elevate their business management with efficient financial reporting and business intelligence capabilities. The decision ultimately hinges on the specific needs and priorities of each organization, but Jet Reports’ user-friendly features and comprehensive functionality position it as a strong contender in the reporting tools landscape. 

Get 30 days free license for Jet Reports

Share this blog on:

Search Blog

About Us

Global Data 365 is composed of highly skilled professionals who specialize in streamlining the data and automate the reporting process through the utilization of various business intelligence tools.

Follow us on:

Want to try Jet Analytics?

Get Free License for 30 Days

Jet Analytics Hero Section

Subscribe to Our Newsletter

Management Reporter vs Jet Reports Read More »

data lake vs data warehouse

Data Lake vs Data Warehouse: What's The Key Difference?

data lake vs data warehouse

With the rise of big data and the explosion of new data sources, traditional data warehousing approaches may not be sufficient to meet the needs of modern data management and analytics, creating confusions between Data Lake vs Data warehouse. This has led to the development of new approaches, including Data Lake and Data Warehouse. Each approach offers unique benefits and drawbacks, and understanding the differences between them is critical to making informed decisions about data management and analytics.

Data Lake

A Data Lake is a centralized repository that allows businesses to store vast amounts of raw, unstructured, or structured data at scale. It provides a flexible storage environment, enabling organizations to ingest diverse data types without the need for upfront structuring. This unrefined data can then be processed and analyzed for valuable insights, making Data Lakes ideal for handling large volumes of real-time and varied data.

Benefits and Use Cases of Data Lake

Data lakes provide scalable and cost-effective storage, accommodating diverse data types such as raw and unstructured data for flexible analysis. With a focus on real-time analytics and advanced capabilities like machine learning, they support innovation in algorithm development. Cost-efficient storage solutions, often leveraging scalable cloud storage, make data lakes economical for managing large datasets.


Use cases range from big data analytics, IoT data management, and ad hoc analysis to long-term data archiving and achieving a 360-degree customer view. In essence, data lakes offer dynamic repositories that empower organizations with flexibility, real-time insights, and comprehensive data management solutions.

Data Warehouse

On the other hand, a Data Warehouse is a structured, organized database optimized for analysis and reporting. It is designed to store structured data from various sources in a format that is easily query able and supports business intelligence reporting. Data Warehouses are characterized by their schema-on-write approach, requiring data to be structured before entering the system, ensuring a high level of consistency for analytical purposes.

Benefits and Use Cases of Data Warehouse

Data warehouses offer a multitude of benefits, including optimized structured data analysis for improved query performance and efficient reporting. They preserve historical data for time-series analysis and audit trails, enhance business intelligence through data consolidation and dashboard creation, ensure data quality and consistency through cleansing processes, and provide scalability to handle growing data volumes.


Common use cases encompass business performance analysis, customer relationship management, supply chain optimization, financial reporting and compliance, and human resources analytics.

Find the visual representation and difference between: Data Lake vs Data Warehouse.

Data Lake vs Datawarehouse: Key Differences

Features 

Data Lake

Data Warehouse 

Purpose 


Used for storing vast amounts of diverse data types for future analysis. 

Optimized for large-scale analytical queries, storing historical data for reporting and analysis. 

Data Type 


Stores raw, unprocessed data in its native format. 

Stores summarized, aggregated, and historical data. 

Data Structure 

Schema-on-read, allowing for flexibility in data storage. 

Optimized for read-heavy operations (OLAP – Online Analytical Processing). 

Users 


Primarily used by data engineers, data scientists, and machine learning teams. 

Mainly used by business analysts, data scientists, and decision-makers for insights and reporting. 

Data Volume 

Holds vast amounts of unstructured and structured data. 

Handles large volumes of historical data from various sources. 

Performance 


Performance can vary; optimized for large data ingestion rather than query speed. 

High performance for complex queries and large-scale data retrieval for analysis. 

Schema Design 

Uses a flexible schema design; data is often stored without a predefined schema. 

Denormalized schema (e.g., star or snowflake schema) for faster query performance. 

Data Processing 


Processes a wide variety of data types, including structured, semi-structured, and unstructured data. 

Processes complex  queries requiring significant data aggregation. 

Concurrency 

Supports high concurrency for data ingestion and retrieval.


Supports a lower number of users. 

Storage Cost 


Typically cheaper to store vast amounts of data due to lower storage costs. 


Higher storage costs due to large datasets and complex processing requirements. 


Example Use Cases 


Data exploration, machine learning, real-time analytics. 

Business intelligence reporting, trend analysis, forecasting, decision support. 

Data Source 

Captures data from various sources, including social media, IoT devices, and unstructured data. 

Aggregates data from multiple sources, including databases, external systems, and log files. 

  1. Data Type:
    Data Lake: Stores raw, unprocessed data in its native format.
    Data Warehouse: Stores summarized, aggregated, and historical data.
     
  2. Purpose:
    Data Lake: Used for storing vast amounts of diverse data types for future analysis.
    Data Warehouse: Optimized for large-scale analytical queries and historical data analysis.

  3. Data Structure: 
    Data Lake: Schema-on-read, allowing for flexibility in data storage.
    Data Warehouse: Optimized for read-heavy operations (OLAP – Online Analytical Processing).

  4. Users:
    Data Lake: Primarily used by data engineers, data scientists, and machine learning teams.
    Data Warehouse: Mainly used by business analysts, data scientists, and decision-makers for insights and reporting.

  5. Data Volume:
    Data Lake: Holds vast amounts of unstructured and structured data. 
    Data Warehouse: Handles large volumes of historical data from multiple sources.

  6. Performance: 
    Data Lake
    : Performance can vary; optimized for large data ingestion rather than query speed. 
    Data Warehouse: High performance for complex queries and large-scale data retrieval.

  7. Schema Design:
    Data Lake: Uses a flexible schema design; data is often stored without a predefined schema. 
    Data Warehouse: Denormalized schema (e.g., star or snowflake schema) for faster query performance.

  8. Data Processing:
    Data Lake: Processes a wide variety of data types, including structured, semi-structured, and unstructured data. 
    Data Warehouse: Processes complex queries requiring significant data aggregation.

  9. Concurrency:
    Data Lake: Supports high concurrency for data ingestion and retrieval. 
    Data Warehouse: Supports a lower number of users.

  10. Storage Cost:
    Data Lake: Typically cheaper to store vast amounts of data due to lower storage costs.
    Data Warehouse: Higher storage costs due to large datasets and complex processing.

  11. Data Source:
    Data Lake: Captures data from various sources, including social media, IoT devices, and unstructured data. 
    Data Warehouse: Aggregates data from multiple sources, including databases, external systems, and log files.

  12. Example Use Cases: 
    Data Lake: Data exploration, machine learning, real-time analytics. 
    Data Warehouse: Business intelligence reporting, trend analysis, forecasting. 

Finding the Right Fit: data lake vs data warehouse

Is there room for both Data Lake and Data Warehouse in your data strategy? Explore the benefits of adopting a hybrid approach, seamlessly integrating the strengths of both solutions for comprehensive data management. Discover the factors to consider when choosing between Data Lake and Data Warehouse solutions. From cost considerations to scalability needs and varying data types and formats, find the perfect fit with Global Data 365 for your business’s unique requirements by contacting us now.

Simplify Your Data – Get a Free Consultation!

Share this blog on:

Search Blog

About Us

Global Data 365 is composed of highly skilled professionals who specialize in streamlining the data and automate the reporting process through the utilization of various business intelligence tools.

Follow us on:

Want to try Jet Analytics?

Get Free License for 30 Days

Jet Analytics Hero Section

Subscribe to Our Newsletter

Data Lake vs Data Warehouse Read More »

Directions EMEA

Directions EMEA 2023: Guiding the Future of Microsoft Dynamics in Europe, the Middle East, and Africa

Directions EMEA

Location:

Quai Charles de Gaulle, Lyon, France

Every year, the Microsoft Dynamics community eagerly anticipates the Directions EMEA conference. This annual gathering of partners, developers, and industry experts is a cornerstone event. It provides a platform to showcase the latest innovations, share insights, and discuss the future of Microsoft Dynamics.

Key Themes of Direction EMEA 2023:

In Directions EMEA 2023 there are several key themes and focus areas such as discussions, sessions, and workshops throughout the conference.

1. How Directions EMEA 2023 is Shaping the Future of Business Processes

In today’s rapidly evolving business landscape, digital transformation is no longer a luxury but a necessity. The conference will delve into strategies for leveraging ERP solutions, automation tools, and cloud-based technologies to drive business growth. Attendees can expect to gain insights into the latest trends in digital transformation and how to implement them effectively.

2. Insights from Experts

Every industry faces its unique set of challenges and Directions EMEA 2023. It will feature discussions on industry-specific issues and best practices shared by successful businesses. These insights will equip attendees with valuable knowledge to address the hurdles specific to their sectors.

3. Networking Opportunities

The conference offers an array of B2B networking events, providing attendees with a chance to connect with industry leaders and peers from across the EMEA region. The power of collaboration cannot be over-ruled, and these connections may lead to partnerships, innovative ideas, and collaborative projects that propel businesses forward.

4. Product Launches and Innovations

Microsoft Dynamics is known for its innovative solutions, and the conference will see the unveiling of new product announcements related to ERP software and technological advancements. These revelations will give attendees a glimpse of the future tools and capabilities that can enhance their operations

The Benefits of Attending Directions EMEA 2023 for Businesses in Europe, the Middle East, and Africa

For businesses in the EMEA region, this conference offers a unique opportunity. You can stay at the forefront of technological and industry trends. The benefits include:


  • Educational Opportunities: The conference will feature expert-led sessions, workshops, and discussions, providing attendees with invaluable knowledge and insights into future industry trends. These educational opportunities can help businesses stay competitive and relevant.
  • Networking Advantages: The power of networking at Directions EMEA 2023 cannot be overstated. Connecting with industry leaders and peers from diverse backgrounds can lead to collaborations, partnerships, and the sharing of innovative ideas that drive growth.
  • Product Knowledge: With Microsoft unveiling new technologies and product launches, attendees will understand the latest tools and solutions that can enhance their business operations. This knowledge can translate into a competitive advantage in the marketplace.

Why Businesses Should Mark their Calendars for Directions EMEA 2023?

As the platform continues to evolve and adapts to the needs of modern businesses. This conference serves as a compass, guiding partners and developers toward a future of endless possibilities. By attending Directions EMEA, participants will not only be part of this transformative experience but also contribute to shaping the future of the Microsoft Dynamics ecosystem.


Directions EMEA 2023 is set to be a game-changing event for the Microsoft Dynamics community. With its focus on innovation, collaboration, and knowledge sharing. This conference will equip attendees with the tools and insights they need to thrive in an ever-evolving business landscape. As we eagerly await the arrival of Directions EMEA 2023, one thing is certain:thefuture of Microsoft Dynamics looks brighter than ever before. Mark your calendars and be ready to embrace the future of business in the EMEA region.

We’re excited to announce that Global Data 365 will be a part of Directions EMEA 2023, as a face of Middle East Business showcasing our Microsoft Dynamics ERP solutions.


Jet Reports: Explore Jet Reports, a pivotal element of GlobalData365’s suite of solutions. As the exclusive distributor of Jet Reports in the UAE, we’re eager to introduce this dynamic reporting tool that seamlessly integrates with Microsoft Dynamics ERP solutions. With Jet Reports, businesses can easily generate precise, real-time financial and operational reports directly from their ERP systems.


Jet Analytics: Dive into the innovative capabilities of Jet Analytics, another remarkable product within GlobalData365’s suit of solutions. Serving as the official distributor of Jet Analytics in the UAE, we’re excited to highlight this robust business intelligence and data analytics platform. Jet Analytics enhances the Microsoft Dynamics ERP experience by offering advanced analytics, data warehousing, and self-service reporting functionalities.


Power BI: As one of our core offerings, Power BI stands as a premier business intelligence tool known for its ability to visually analyze and share insights from data. This dynamic platform empowers organizations with robust analytics capabilities, supporting strategic initiatives.

Get 30 days free upgrade to Jet Reports.

Share this blog on:

Search Blog

About Us

Global Data 365 is composed of highly skilled professionals who specialize in streamlining the data and automate the reporting process through the utilization of various business intelligence tools.

Follow us on:

Want to try Jet Analytics?

Get Free License for 30 Days

Jet Analytics Hero Section

Subscribe to Our Newsletter

Directions EMEA 2023: Guiding the Future of Microsoft Dynamics in Europe, the Middle East, and Africa Read More »

Power BI with Jet Analytics

Power BI with Jet Analytics

Power BI with Jet Analytics

Business intelligence is a much better and less expensive choice than data warehousing for 90% of small to mid-size businesses. Both systems used together; Power BI with Jet Analytics have the same overall goal: to improve data analysis. The immense effort and cost needed to define the data tables and relationships required to drive analytics put data warehousing out of reach for most businesses. Due to the extreme minimal effort and expense needed to get it up and running, business intelligence is becoming the choice of small to mid-size companies, irrespective of which of the two most popular options are used.


Jet Analytics from insightsoftware (previously Jet Global) and Power BI from Microsoft are the two most popular business intelligence options in the Microsoft Dynamics environment. Jet Analytics can use either Excel or Jet Reports as a reporting tool, allowing you to have the best experience. Jet Analytics uses pre-defined data cubes to describe the patterns in the data necessary for reporting. Because the table relationships required for accounting, which are focused on financial processes, are not always the same as those required for business analysis, which could be more operational, this method works. This method has many disadvantages, including a higher initial cost, more work to create new data relationships into the data cubes, and the fact that data is only as current as of the last update.


A major benefit is the simplicity with which new reports can be created if they match the data cubes, as well as the improved accuracy since the reports are run against a replica of the output database rather than the live database itself. Data can be processed into data cubes from various sources, not all accounting systems.

Benefits of Using Power BI with Jet

Power BI depends on one or more databases to provide real-time or near-real-time data. This means that data is updated in real-time, but output for more detailed reports will not be optimal. Almost any form of the report can be created and distributed through the web or mobile devices. Every consumer can create their own dashboards, each with its own unique insight. It is possible to set up alerts. The details behind the reports can be drilled down by users. To use Power BI, you will need an Office 365 subscription.


You cannot really go wrong anyway. Invest a little more upfront to identify data relationships using data cubes in Jet Analytics or subscribe to Office 365 and use Microsoft BI Power to provide your users real-time access to important analytical data. To explore more about these better, less expensive alternatives for your company, we offer 30 days free trial license for you to test it on your very own database or get a personalized training for yourself.

Get a Free Demo of Power BI with Jet Analytics!

Share this blog on:

Search Blog

About Us

Global Data 365 is composed of highly skilled professionals who specialize in streamlining the data and automate the reporting process through the utilization of various business intelligence tools.

Follow us on:

Want to try Jet Analytics?

Integrate Power BI with Jet Today!
Jet Analytics Hero Section

Subscribe to Our Newsletter

Power BI with Jet Analytics Read More »

What are Data Lakes?

What are Data Lakes?

What are Data Lakes?

The huge volume of data collected by today’s company has entailed a drastic change in how that data is stored. Data stores have expanded in size and complexity to keep up with the companies they represent, and data processing now needs to stay competitive, from simple databases to data warehouses to data lakes. As enterprise businesses collect vast amounts of data from every imaginable input through every conceivable business feature, what started as a data stream has developed into a data flow.


A new storage solution has emerged to resolve the influx of data and the demands of enterprise businesses to store, sort, and analyze the data with the data lake.

What are Data Lakes?

Data Lakes are type of centralized repository that stores all types of data—structured, semi-structured, and unstructured—in its raw format. Unlike data warehouses, which standardize data before processing, a data lake holds data without any transformation, allowing for future analysis and exploration. This raw data can later be structured for specific purposes, making it a powerful resource for businesses that deal with diverse data sources like IoT devices or event tracking.

What Does It Contain?

The foundation of enterprise businesses is a collection of tools and functions that provide useful data but seldom in a structured format. The company’s accounting department may use their chosen billing and invoicing software, but your warehouse uses a different inventory management system. Meanwhile, the marketing team is dependent on the most efficient marketing automation or CRM tools. These systems rarely interact directly with one another, and while they can be pieced together to respond to business processes or interfaces through integrations, the data generated has no standard performance.


Data warehouses are good at standardizing data from different sources so that it can be processed. In reality, by the time data is loaded into a data centre, a decision has already been taken about how the data will be used and how it will be processed. Data lakes, on the other hand, are a larger, more unmanageable system, holding all of the structured, semi-structured, and unstructured data that an enterprise company has access to in its raw format for further discovery and querying. All data sources in your company are pathways to your data lake, which will capture all of your data regardless of shape, purpose, scale, or speed. This is especially useful when capturing event tracking or IoT data, while data lakes can be used in a variety of scenarios.

Benefits of Data Lakes

  • Versatility: Data lakes store data in any form—whether it’s CRM data from marketing or raw transaction logs from inventory systems.
  • Flexibility: Since data is stored in its original format, it can be processed, transformed, and analyzed whenever needed.
  • Scalability: Data lakes, like Azure Data Lake, handle data of any volume, shape, or speed, making them ideal for large-scale enterprises.

Application of Data Lakes

Data lakes find applications across multiple industries, enabling:

  • Healthcare: Early disease detection and personalized treatments.
  • Finance: Fraud detection and market trend prediction.
  • Retail: Customer behavior analysis and inventory optimization.
  • Manufacturing: Predictive maintenance and production workflow enhancements.

Data Collection in Data Lakes

Companies can search and analyse information gathered in the lake, and also use it as a data source for their data warehouse, after the data has been collected.


Azure Data Lake, for instance, provides all of the features needed to allow developers, data scientists, and analysts to store data of any scale, shape, or speed, as well as perform all kinds of processes and analytics across platforms and languages. Azure Data Lake simplifies data management and governance by eliminating the complications of consuming and storing all of your data and making it easier to get up to speed with the queue, streaming, and interactive analytics. It also integrates with existing IT investments for identity, management, and security.


That being said, storage is just one aspect of a data lake; the ability to analyse structured, unstructured, relational, and non-relational data to find areas of potential or interest is another. The HDInsight analytics service or Azure’s analytics job service can be used to analyse data lake contents.

Data Collection and Analysis

Data lakes are especially useful in analytical environments when you don’t understand what you don’t know with unfiltered access to raw, pre-transformed data, machine learning algorithms, data scientists, and analysts can process petabytes of data for a variety of workloads like querying, ETL, analytics, machine learning, machine translation, image processing, and sentiment analysis. Additionally, businesses can use Azure’s built-in U-SQL library to write the code once and have it automatically executed in parallel for the scale they require, whether in.NET languages, R or Python.

Microsoft HDInsight

The open-source Hadoop platform continues to be one of the most common options for Big Data analysis. Open-source frameworks such as Hadoop, Spark, Hive, LLAP, Kafka, Storm, HBase, Microsoft ML Server, and more can be applied to your data lakes through pre-configured clusters tailored for various big data scenarios with the Microsoft HDInsight platform.

Learn More About Microsoft HDInsight

Future-Proof Data

For companies, data lakes reflect a new frontier. Incredible possibilities, perspectives, and optimizations can be uncovered by evaluating the entire amount of information available to an organization in its raw, unfiltered state without expectation. Businesses may be susceptible to data reliability (and organizational confidence in that data) and also protection, regulatory, and compliance risks if their data is ungoverned or uncatalogued. In the worst-case scenario, data lakes will have a large amount of data that is difficult to analyse meaningfully due to inaccurate metadata or cataloguing.


For companies to really profit from data lakes, they will need a clear internal governance framework in place, as well as a data catalogue (like Azure Data Catalogue). The labelling framework in a data catalogue aids in the unification of data by creating and implementing a shared language that includes data and data sets, glossaries, descriptions, reports, metrics, dashboards, algorithms, and models.

Built your BI Infrastructure

The data lake will remain a crystal-clear source of information for your company for several years if you set it up with additional tools that allow for better organization and analysis, such as Jet Analytics.


At  Global Data 365, you can contact our team to find out more information on how to effectively organize your data or executing big data systems seamlessly.

Get 30 Days Free Jet Analytics License!

Share this blog on:

Search Blog

About Us

Global Data 365 is composed of highly skilled professionals who specialize in streamlining the data and automate the reporting process through the utilization of various business intelligence tools.

Follow us on:

Want to try Jet Analytics?

Get Free License for 30 Days
Jet Analytics Hero Section

Subscribe to Our Newsletter

What are Data Lakes? Read More »

How to Increase Transparency in your Finance Processes

How to Increase Transparency in your Finance Processes

How to Increase Transparency in your Finance Processes

When upper management has complete insight into the operations of the company, it runs more smoothly with it’s finance process. Gartner’s market oracles recently published a list of nine characteristics that CFOs must possess to maintain success during times of crisis and uncertainty. Based on 20 years of research and strongly influenced by lessons learned from the financial crisis of 2008, the list needs a review.  Placing more money on the line. 


  • Defending against scope creep.
  • Critical Initiative Funding.
  • Making it easier to take risks.
  • Getting to know your customers.
  • Cutting your losses.
  • Careful cost-cutting.
  • Identifying cost-cutting opportunities around the organization.
  • Integrating Budget Models. 

Even though each entry is based on a different goal, they all have one thing in common: the need for financial transparency. CFOs must provide the most up-to-date details on all facets of financial results. When making new acquisitions, searching for cost-cutting opportunities, or modifying the years’ plans. 

Impact of COVID-19 on Businesses

Even before the pandemic, CFOs struggled to obtain refined, regularly updated information. Data accessibility has become a pressing problem as more teams work from home and struggle to access the same data, software, and teamwork that they depend on in the office. Financial invisibility occurs when businesses have the requisite data (often distributed across the ERP) but are unable to access it easily, comprehensively, or consistently. 


CFOs require access to reports and metrics that represent the most recent data available as they try to control cash flow, perfect accounts receivable, or safe loans and stimulus funding. The volume of information and the speed at which it is processed is well beyond standard. As a result, CFOs are much less informed about financial performance data. One of the major threats that businesses face today is financial invisibility. In this crucial time, a single bad decision based on incomplete or unreliable data may sink a corporation. That outcome can be avoided with a few tweaks. 

Finance Processes and Financial Visibility

Financial reporting is one way to convey visibility. Many business leaders are motivated by the need for a reliable, automated, and open reporting system. Provide them with the data they need, when they need it, for full transparency with finance processes. 


Specialized tools, such as those created by Global Data 365, can help. Incorporating these strategies can significantly enhance transparency in your finance processes, ultimately leading to better decision-making and increased trust among stakeholders. Each of our solutions integrates with common ERP software and automates the most time-consuming aspects of reporting. The solutions then produce and distribute reports in the format that the CFO prefers. That may mean regular updates in the standard Excel format or CFOs can go a step further and get real-time updates through specialized dashboards. Our tools keep financial visibility crystal transparent by making financial reporting simpler than ever while also enhancing the pace, scope, and accuracy of the resulting insights. 


Get 30 days free trial on your database. Contact us now. 

Get 30 days free license for Jet Reports.

Share this blog on:

Search Blog

About Us

Global Data 365 is composed of highly skilled professionals who specialize in streamlining the data and automate the reporting process through the utilization of various business intelligence tools.

Follow us on:

Still using Jet Basics?

Get Free Upgrade to Jet Reports
jet services

Subscribe to Our Newsletter

How to Increase Transparency in your Finance Processes Read More »

BI Dashboard

Everything You Need to Know About BI Dashboard

BI Dashboard

Business leaders know that having a few clearly identified, measurable objectives and constantly monitoring success against those objectives allows a company to remain on track to meet its primary objectives. Business Intelligence is a system of processes, infrastructure, and technologies that transform raw data into actionable information. It’s a collection of tools and services for turning data into useful information and knowledge. Likewise, over the last few years, business intelligence (BI) dashboards have become very common as a way of communicating key organizational goals and monitoring success against them.


BI dashboard display data in a vivid visual format that can be easily grasped by almost everyone in the company. BI dashboards are an important way for strategically based companies to communicate results against key performance indicators (KPIs) and keep everybody on the same page. Dashboards, in particular, offer a highly efficient way for leaders to interact with non-financial audiences.

What does a BI Dashboard?

Tracking sales revenue and pipeline prospects against the forecast is one of the most popular use cases for BI dashboards. This is often shown alongside other important customer metrics, including returns, on-time delivery, and so on. It’s an explanation that almost anyone in the company can understand, and it’s especially important to C-suite executives and those in every company.


That being said, for finance and accounting practitioners, some use cases for making people aware of other key financial indicators across the entire enterprise are important to consider. For non-technical users, dashboard visualization can be highly effective.


Working capital is one of the most important determinants of business performance. Organizations that successfully control working capital significantly outperformed those that do not. Internalizing main working capital metrics by the rest of the company, on the other hand, can be difficult. High-level indicators of how well the company is doing include the “cash conversion cycle” (CCC) and “days working capital” (DWC).


Not everyone is equipped to understand the numeric data. This is where BI dashboard can be extremely useful. Business leaders can achieve higher performance by clearly defining the most important numbers, communicating them within the company, and publishing performance metrics in a way that everyone can understand regularly.

BI Dashboard is the Future

As software technology has advanced, BI dashboard have become more common as tools for outlining and presenting business data have become faster and more efficient. A comprehensive toolset is needed to work with massive data sets, work more effectively, and produce dashboards efficiently and precisely. Some of the features of using BI dashboards are:

Data Visualization

Dashboards that are well-designed present data in a way that is useful to the target audience. They give just the effective data, not too much or too little. Furthermore, good dashboards are adaptable to each user’s specific requirements.

Real-Time Alerts

An effective BI dashboard can alert users to circumstances that need urgent attention, similar to warning lights on a car dashboard. A successful dashboard will help business leaders solve issues as soon as they arise by monitoring data in real-time and alerting them to exceptions.

Collaboration

The first step is to get the correct information from people in the company. With easily accessible, sharable content, collaboration features allow discussion and task management. Relevant discussions will send constructive alerts to the appropriate people in the organization, making it easier to collaborate effectively.

Future Predictions about BI dashboard

While the word “dashboard” suggests an emphasis on the past and present, the most powerful dashboard solutions often include rolling forecasts and predictive analytics, allowing for a clearer view of the path ahead.


Global Data 365 includes dashboards and communication tools, as well as effective business intelligence tools. With integration from over 140 different ERP systems and other enterprise software, we allow quicker, simpler, and more affordable business insights. You can request a free demo today to learn more about how your company will profit from the power of BI dashboards.

Talk to Our BI Experts and Set Your Strategy NOW!

Share this blog on:

Search Blog

About Us

Global Data 365 is composed of highly skilled professionals who specialize in streamlining the data and automate the reporting process through the utilization of various business intelligence tools.

Follow us on:

Interact Live with BI Dashboards

Increase efficiency and deliver success now with Microsoft Power BI. Enjoy a 20% discount on all Power BI services.

dashboards

Subscribe to Our Newsletter

Everything You Need to Know About BI Dashboard Read More »

Automate Reporting from Dynamics GP

How To Automate Reporting From Dynamics GP?

Automate Reporting from Dynamics GP

If you do not fully understand the complex underlying data structure of over 1300+ tables and 22500+ fields, then automate reporting from Dynamics GP can prove to be a problem. Recently, Microsoft Dynamics ERP software has evolved to Dynamics 365 Business Central cloud, and it brings versatility and easy access for small businesses throughout the world. Reporting challenges are bound to arise due to the complex nature of the data structure field. All ERP solutions are made of back-ends that are hard to operate for anyone who is not a specialized expert or administrator.


ERP solutions, like Dynamics GP, are designed to optimize business processes and data storage. Its main focus is on storing data, not extracting it. Microsoft Dynamics GP has advanced and evolved in the ways users receive their reports. Management Reporter has advanced to the new setting providing an Excel-integrated tool known as Jet Basics; Smart List has for a long time provided the export-to-spreadsheet option, and Power BI is coming out as a great tool for data visualization. Similar to other Microsoft Dynamics solutions, Dynamics GP is evolving when it comes to providing built-in and extra tools for users to get data visualization.


According to the feedback received from thousands of users from across the globe, users complain about the reporting and analytics in Dynamics GP, as it fails to meet functional reporting requirements outside of financial reporting. The reason behind this could be the complex GP data structure or the unavailability of specialized experts. In any way, depending on these tools is costing users their time and money. Companies are forced to recruit Dynamics GP experts because of the lack of access to one organized, instant visualization of the data.


If you face limitations in your financial systems while regularly using Dynamics GP to optimize processes, then the main challenges that you may be facing in operational reporting are:

Challenges in reporting from Dynamics GP

The four main challenges faced by businesses in reporting from Dynamics GP are:

– SSRS Programming:
Programming in SSRS is costly and slow due to a large amount of data, intricate linking tools, and the programming skill needed to form a report.

– Managing Unorganized Data in Excel:
In a company, every person has their own spreadsheets, which can result in unreliable data and security risks. As every department has different approach in completing its operations.

– Power BI Views:
Power BI can be difficult to navigate for someone who is not a technical expert due to the compilation of data that results in a single view and the rewriting needed to change the views.

– Constructing OLAP Data Cubes:
Constructing OLAP data cubes can be hard and time-consuming as it requires a specialized expert who is familiar with both SSAS data cubes and Dynamics GP.

Keeping these challenges in mind, Global Data 365 has a solution to overcome your Dynamics GP users’ time, money, and effort, all the while creating better reports. It begins with Jet Analytics, the fundamental Dynamics GP data solution.

How Global Data 365 helps with Reporting in Dynamics GP?

Global Data 365 provides better services and implementation to address the obstacles using dynamics that lead your business to success. Without the need for developers and costly experts, Jet Analytics is a complete business intelligence solution designed to obtain quick, customizable reports and dashboards in Excel. And it is possible to do it yourself. Jet Analytics puts all the Dynamics GP data into one and organized it in one location using a pre-built data warehouse, OLAP data cubes, and dashboards to automate reporting in Dynamics GP.

If it is paired with a user-based front-end reporting tool, it makes it possible for users to view, assemble, and prepare the data, so you can benefit from the robust data visualization tools of Power BI and be more effective with operational reporting and analysis. The Jet Data Manager is used as a back-end tool by Jet Analytics to configure turnkey data warehouses and OLAP cubes to assist you monitor and organize your Dynamics GP data.


Jet Analytics provides users to use Excel for all your reporting requirements with one operating location for your reporting, but it offers one source and data management system to handle the delivery, security, business measures, calculations, and run-time of such reports. So, do not let your existing obstacles in operational reporting keep you from receiving immediate insight into your data. Companies can now improve the visibility of real-time data to help automate reporting from Dynamics GP users turn efficient and enjoy Jet Analytics full capabilities.


We, at Global Data 365, offers free one month license of Jet Analytics for you to test it with your Dynamics GP database and see the value it brings into your reporting process. Contact Us to order your trial license now.

Get 30 days free upgrade to Jet Reports.

Share this blog on:

Search Blog

About Us

Global Data 365 is composed of highly skilled professionals who specialize in streamlining the data and automate the reporting process through the utilization of various business intelligence tools.

Follow us on:

Still using Jet Basics?

Get Free Upgrade
to Jet Reports

jet services

Subscribe to Our Newsletter

How To Automate Reporting From Dynamics GP? Read More »

Get an Instant Demo!
Talk to Our BI Experts!