Reporting Tools

Power BI with Jet Analytics

Power BI with Jet Analytics

Power BI with Jet Analytics

Business intelligence is a much better and less expensive choice than data warehousing for 90% of small to mid-size businesses. Both systems used together; Power BI with Jet Analytics have the same overall goal: to improve data analysis. The immense effort and cost needed to define the data tables and relationships required to drive analytics put data warehousing out of reach for most businesses. Due to the extreme minimal effort and expense needed to get it up and running, business intelligence is becoming the choice of small to mid-size companies, irrespective of which of the two most popular options are used.


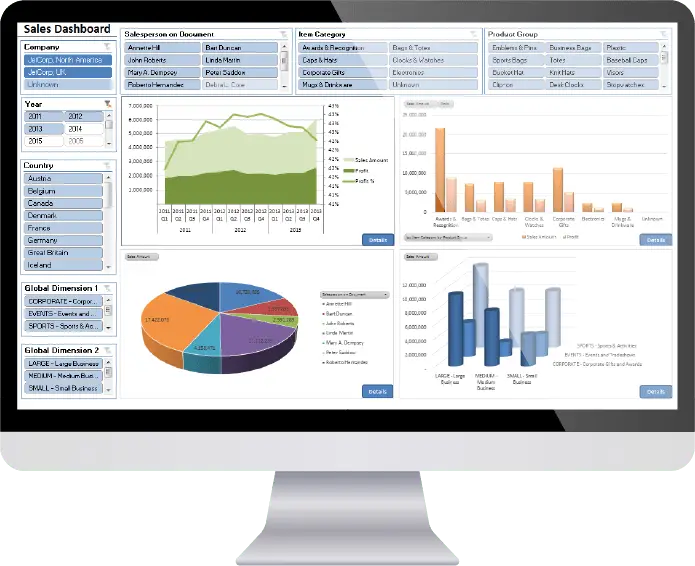
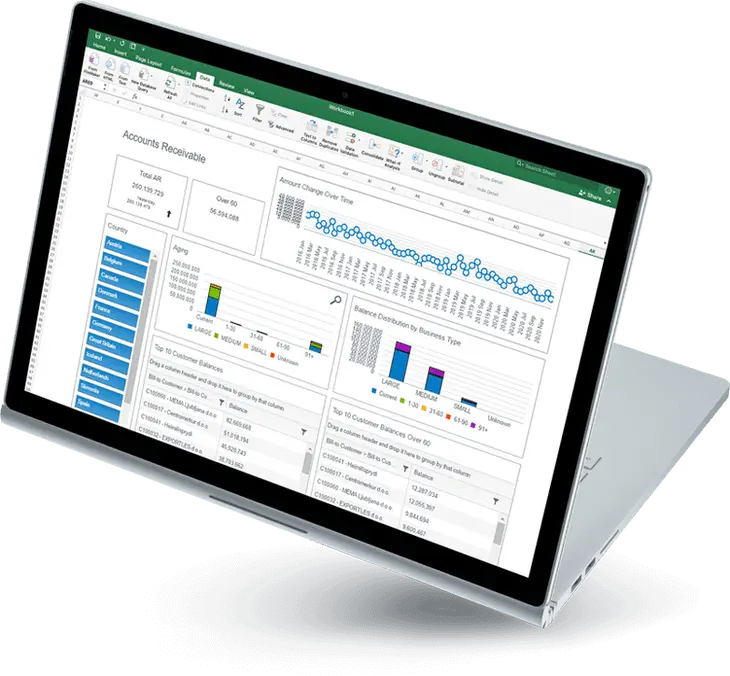
Jet Analytics from insightsoftware (previously Jet Global) and Power BI from Microsoft are the two most popular business intelligence options in the Microsoft Dynamics environment. Jet Analytics can use either Excel or Jet Reports as a reporting tool, allowing you to have the best experience. Jet Analytics uses pre-defined data cubes to describe the patterns in the data necessary for reporting. Because the table relationships required for accounting, which are focused on financial processes, are not always the same as those required for business analysis, which could be more operational, this method works. This method has many disadvantages, including a higher initial cost, more work to create new data relationships into the data cubes, and the fact that data is only as current as of the last update.


A major benefit is the simplicity with which new reports can be created if they match the data cubes, as well as the improved accuracy since the reports are run against a replica of the output database rather than the live database itself. Data can be processed into data cubes from various sources, not all accounting systems.

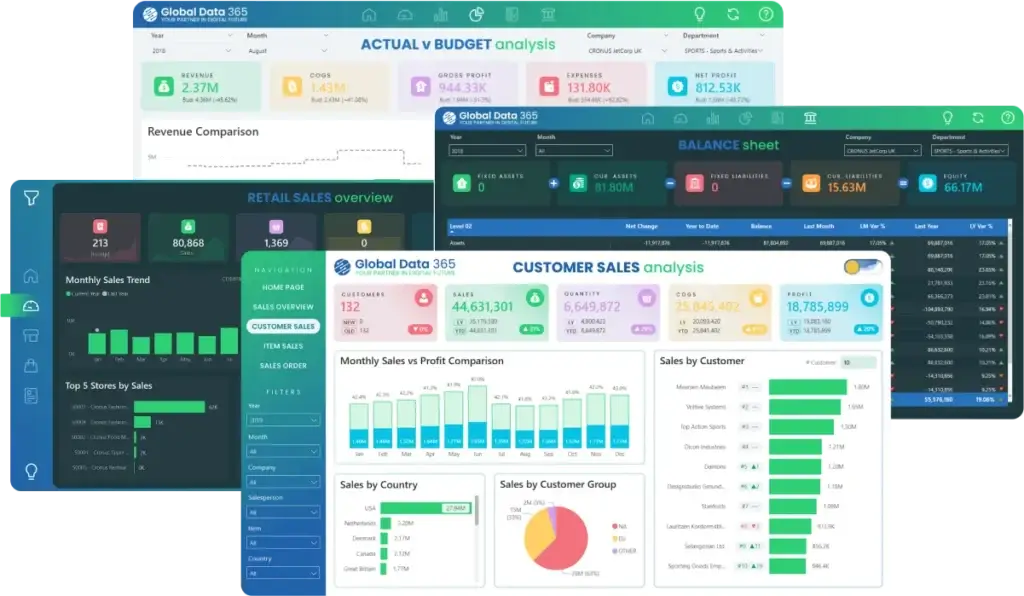
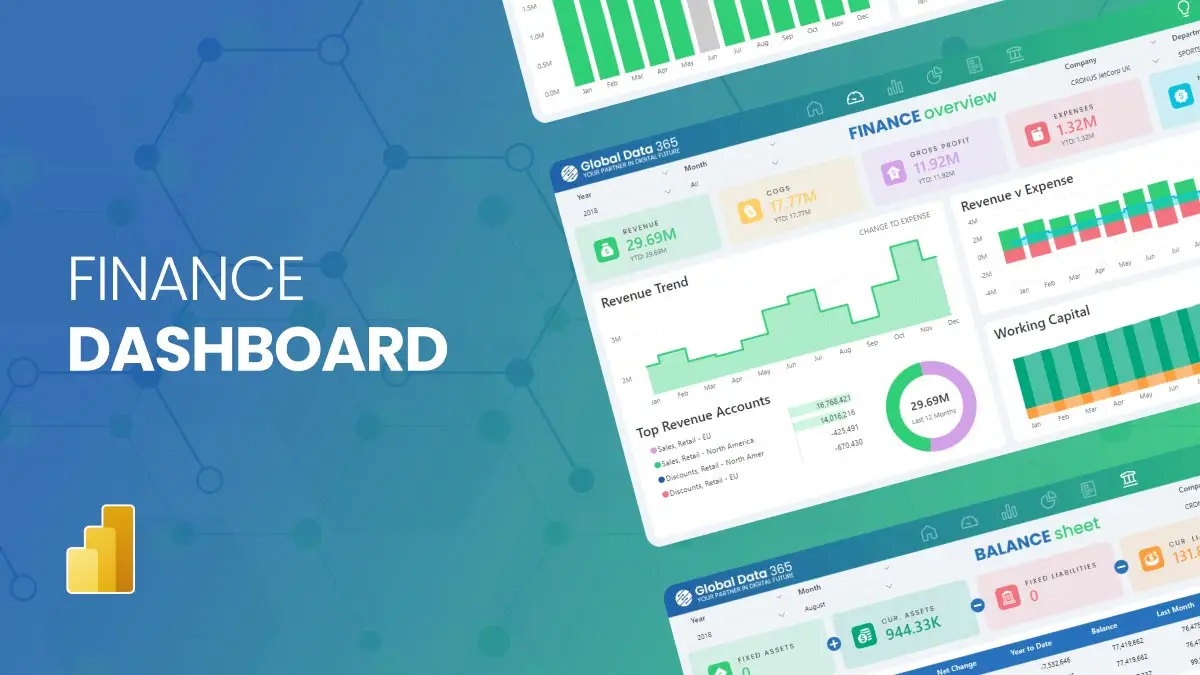
Benefits of Using Power BI with Jet

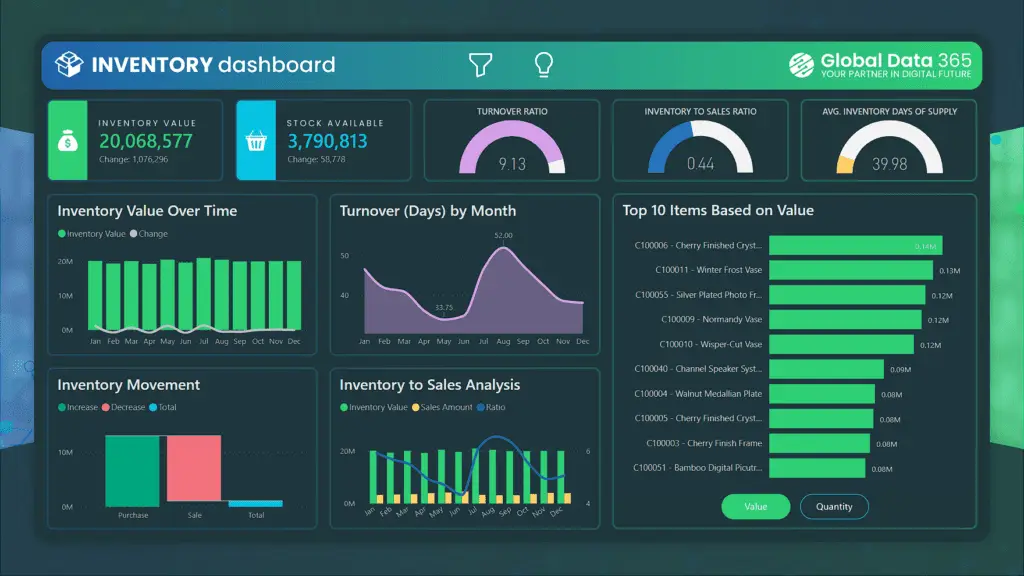
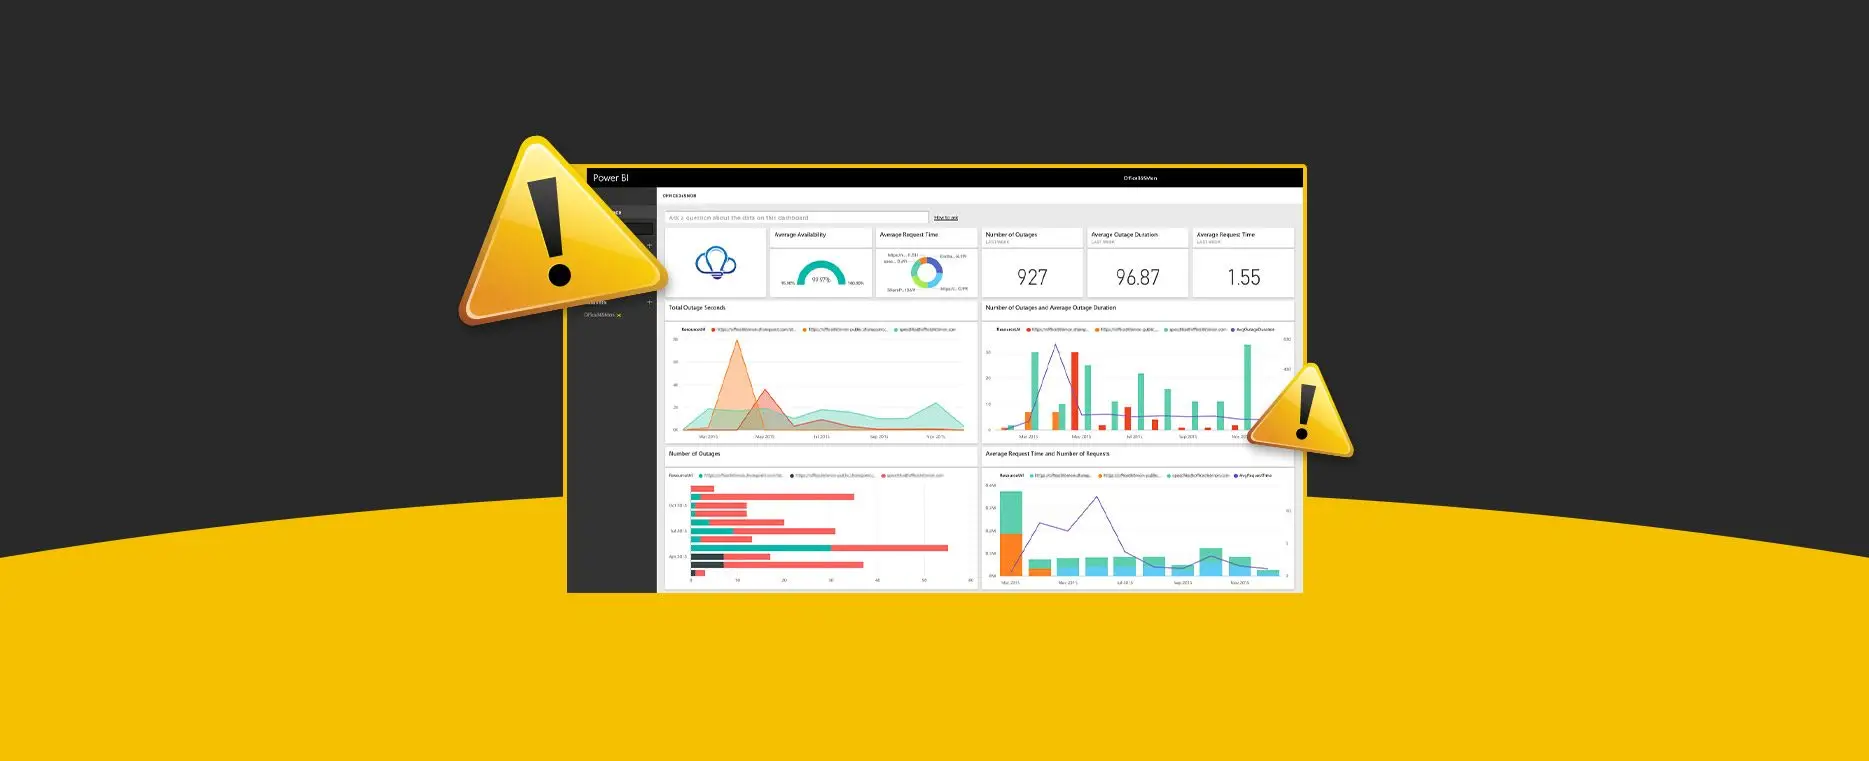
Power BI depends on one or more databases to provide real-time or near-real-time data. This means that data is updated in real-time, but output for more detailed reports will not be optimal. Almost any form of the report can be created and distributed through the web or mobile devices. Every consumer can create their own dashboards, each with its own unique insight. It is possible to set up alerts. The details behind the reports can be drilled down by users. To use Power BI, you will need an Office 365 subscription.


You cannot really go wrong anyway. Invest a little more upfront to identify data relationships using data cubes in Jet Analytics or subscribe to Office 365 and use Microsoft BI Power to provide your users real-time access to important analytical data. To explore more about these better, less expensive alternatives for your company, we offer 30 days free trial license for you to test it on your very own database or get a personalized training for yourself.

Get a Free Demo of Power BI with Jet Analytics!

Share this blog on:

Search Blog

About Us

Global Data 365 is composed of highly skilled professionals who specialize in streamlining the data and automate the reporting process through the utilization of various business intelligence tools.

Follow us on:

Want to try Jet Analytics?

Integrate Power BI with Jet Today!
Jet Analytics Hero Section

Subscribe to Our Newsletter

Power BI with Jet Analytics Read More »

Optimize Processes with Data Visualization

Optimize Processes with Data Visualization

Optimize Processes with Data Visualization

Every aspect of a company relies on making prompt, well-informed decisions. Data is at the center of the financial services sector. Traditional business intelligence (BI) methods aren’t up to the task with so much data to rummage through. These techniques were designed for tabular reporting and can only handle small volumes of homogeneous data; they also require advanced technical expertise. Today’s software can process and interpret massive amounts of data in real-time, with a level of elegance previously unseen. By leveraging modern tools to optimize processes with data visualization, companies can transform complex datasets into actionable insights, enhancing decision-making efficiency across all departments. According to a report conducted by Gartner on the top priorities of CFOs, here’s what they looked at: 

– Enhancing Financial Analytics: 
Even after a 50% rise in financial analytics expenditure in the last three years, only a few businesses have advanced analytics capabilities. As analytics becomes a central responsibility of the finance department, this must change. 


– Reorganizing Finance Teams: 
Traditional approaches for coordinating and using finance teams are becoming less effective as the popularity of finance teams grows. To stay relevant, the department needs a shakeup from the top down. 


– Finance Technology Optimization: 
Finance teams must maximize the value of their ERP systems while also adopting newer innovations and planning to become more tech-savvy. If this isn’t done, the finance department will become less intelligent and agile. 


Any of those projects could keep a CFO busy for a year without yielding much progress. However, if such executives consider these problems analytically, realizing how the challenges and goals intersect, a surprising approach emerges, data visualization. 

Data Visualizations

There has almost certainly been some kind of data visualization for as long as there has been data. Charts and graphs have recently become commonplace in business due to Excel spreadsheets. Users soon realized that visual interfaces help them understand complex information. Instead of manually examining a spreadsheet, they could quickly recognize the key takeaways by looking at a pie chart. Digital visualizations provided the finance team with a unique outlook on data and a game-changing method for decision-making, compared to what was previously available. 


Today, visualizations have taken yet another step forward, possibly the most important yet. Advanced visualization features are included in today’s top financial reporting tools, which run on top of ERP and beyond the constraints of Excel. Such visualization tools do more than improve on what has come before; they turn the relationship between the finance team and the data on which it relies more highly than it has ever been. 

Advances in Data Visualizations

So, what’s the difference? To begin with, visualizations have progressed well beyond basic graphs and maps. They can now visualize data in new systems that provide more context and information. Users can view the optimal visualization to encompass the data rather than trying to settle for a sufficient option with this enlarged toolkit at their disposal. 

After you have made that decision, creating the visualization is nearly seamless. It only takes some clicks to move data from one area to another in several cases, rather than a lengthy manual process. This not only saves time and eliminates mistakes, but it also helps everyone inside or outside the finance department to create their own visualization without any need for advanced training. 

Lastly, and perhaps most critically, visualizations have moved to the foreground of decision-making. The finance members can quickly integrate them into financial reports and structure them to optimize the insights they contain as well as the ease with which they can be extracted. The design features within such reports are also not static. They update themselves as new information becomes available, making them more like interactive indicators that monitor key metrics in real-time than visualizations.

In addition to finance, operational and supply chain management teams benefit from these dynamic features. Inventory dashboards, for example, provide real-time insights into stock levels, supplier performance, and demand forecasting. This allows organizations to streamline their operations, reduce costs, and make informed decisions across departments. Integrating financial reports with operational data ensures a comprehensive view of business health, enhancing decision-making at both the strategic and operational levels.. 

Everything in today’s visualizations is vastly superior to previous versions. Despite this, it’s always easy to underestimate their effect on the economy. The CFO, the finance team, and the company are all involved. 

Using Data Visualizations to Optimize Processes

Data visualizations not only help people view data in new ways, but they also help them see it more clearly, presenting insights, opportunities, and challenges that would otherwise go unnoticed. 


One form of data visualization does this is by compressing large volumes of data into a readily available layout. Financial reports influence decision-making, but in the past, they were either too simple to show anything of value or too difficult to stir up an action. Today’s visualizations bridge the gap, allowing reports to include what decision-makers need to know while still revealing those insights in real-time. 


Advanced data visualizations also allow F&a to investigate financial data on their own terms. Decision-makers know what knowledge they want better than everyone else, and once it’s simple to find it and visualize it as needed, understanding differences disappear. To look at it another way, visualizations open a vast array of nuanced financial data to the point that it can be explored. Anyone interested in delving deeper into the data now has a great starting point. 


Visualizations help practitioners outside finance grasp a topic that can be perplexing to the general reader, in addition to CFOs. Executives and heads of departments need to consider how their decisions impact the company’s finances on a micro and macro level, but many lack the knowledge to do so from a dense spreadsheet presenting a financial report. However, when presented with visualizations, the material emerges in a manner that everyone can comprehend. As a result, financial knowledge grows across the board, helping companies optimize processes with data visualization for better decision-making.

Data Visualizations: a Modern Solution

Finance teams will use innovative data visualizations to make significant progress on every one of 2021’s top priorities. Once implemented, analytics improve dramatically, accountants spend less time manually processing data, and the ERP ceases to be a barrier to understanding. 


Global Data 365 offers visualization tools to optimize finance processes. In terms of usability, precision, and variety, these resources far exceed what you’ve come to expect from Excel. Even better, they’re just one of many features available in purpose-built financial reporting tools that are designed to work with today’s most common ERPs. 


If you’re searching for a new perspective on data, we offer a comprehensive upgrade. To see how this all operates, request a free demo today. 

Talk to Our BI Experts!

Share this blog on:

Search Blog

About Us

Global Data 365 is composed of highly skilled professionals who specialize in streamlining the data and automate the reporting process through the utilization of various business intelligence tools.

Follow us on:

Unlock Power of Data Visualization with Power BI

Get started with a free consultation today!

power bi dashboard

Subscribe to Our Newsletter

Optimize Processes with Data Visualization Read More »

ways to optimize your ERP reporting

How to Optimize Your ERP Reporting?

ways to optimize your ERP reporting

According to a recent study, nearly 81% of companies surveyed reported that they had either introduced the use of ERP software or were in the process of implementing it. So, what makes ERP reporting important? By leveraging ERP data analysis, businesses can create strategic plans, forecast future trends, and develop advanced strategies. To truly maximize these benefits, it’s essential to optimize your ERP reporting for more accurate insights and decision-making.


A depth of data indicates that financial reporting generates as much clarification as it creates confusion:


97% of CFO’s have uncertainty regarding the quality of reporting.


  • 40% of CFO’s are concerned that information is reliable and precise.
  • 87% of accountants function overtime to complete the financial closing.
  • 86% of finance teams say that their analytics are not informative.

The only downside is that companies cannot be successful if they don’t have reliable, accurate, and detailed ERP reporting, which can lead to them making risky choices without even acknowledging it. The plus side is that optimizing ERP reporting is not a difficult task in comparison to the usual reporting process.


Listed below are the 5 ways businesses can optimize their ERP Reporting to make it quick and easy:

Self-Service Reporting

Users often need to submit a request to IT before getting access to a report and wait in a queue until they can access it. Users must depend on technical experts because working with the underlying data is hard. For users who are not IT experts, self-service ERP reporting is intended to be user-friendly. This kind of reporting is less about the careful organization of data and more about being cost-effective and a time saver.


For instance, IKEA, one of the biggest retail company has enabled self-service ERP reporting after the implementation of Jet Reports and witnessed instant results. A report that may have taken hours for a warehouse manager can now be done within seconds. Time is saved by enabling self-sufficient ERP reporting.

Automated Processes

A large-scale data organization effort is required to report on finance and operations throughout different departments. The workload includes tracking information from different sources, transferring it from one document to another, and putting time and effort to arrange it all in one clear performance portrait. Advanced automated processes speed up this effort by automatically placing data from ERP systems and other networks, then placing it for immediate analysis into pre-built ERP report templates.


Amref Health Africa, a major NGO in Africa, was having difficulty handling data manually before adding Jet Reports to its reporting toolbox. Now the organization spends less time on handling information and reporting.

Flexibility

Reporting is a regular duty that changes with time. Depending on the same reports adds up to poor performance management, but it takes extra time and feedback from IT experts to produce customized reports. ERP reporting stops being a hassle when it is simple to track various metrics, rewrite reporting data, receive deep insight from reports into transferable data, and access real-time updates on request.


Using an ERP reporting tool, companies can keep track of their data in real-time. Fawaz Holding seized the benefit of customized reports when it introduced Jet Reports to operate side by side with its Microsoft Dynamics 365 Business Central ERP. By building flexibility into the processes, ERP reporting becomes easier.

Business Continuation

Accurate ERP reporting is vital after the global pandemic. Decision-makers instantly require quality, updated data, but it can also be made inaccessible by the same situation that makes it essential. ERP reporting should function at any time, providing the same robust functionality even though users are operating from elsewhere.


Similarly, Enova Facilities Management started to save time on ERP reporting using Jet Reports. When COVID-19 struck, the business utilized those time saved. The challenge didn’t sway the method of reporting, instead, it provided leaders greater insight into the situation.

Higher Standards

ERP reporting can be difficult when the processes are not automated. It leads to a lot of time and effort spent on manually documenting reports and generating analysis. Many ERP reporting systems allow the users data security. It is important to set high standards for data reporting, so businesses need to implement robust ERP systems to automate processes and receive greater insight into the workings of all departments.


Air Trade Centre, a Turkish electronics firm felt it needed quicker ERP reporting and relied on Jet Analytics as the solution. After that, reporting then demanded 60% less feedback overall, which reduced the time it took IT on reporting.

In Conclusion

Learn How to Optimize Your ERP Reporting as accurate reporting is a result of quality data, which is precisely the reason the process takes time. Data is an unruly commodity that takes an extra effort to control, protect, and manipulate. As the data volume grows, ERP reporting will fall behind and cause companies to delay acting. That is why it is important to search for strategies that make data as quickly available as possible by automation.


So, if you face any challenges in reporting, our experienced consultants can provide you with solutions to help you optimize your ERP reporting and make your business grow. Schedule a call to discuss your requirements. Contact us now.

Get a Free JET Demo Now!

Share this blog on:

Search Blog

About Us

Global Data 365 is composed of highly skilled professionals who specialize in streamlining the data and automate the reporting process through the utilization of various business intelligence tools.

Follow us on:

Want to try Jet Analytics?

Get Free License for 30 Days
Jet Analytics Hero Section

Subscribe to Our Newsletter

How to Optimize Your ERP Reporting? Read More »

Why-Power-BI-Is-a-Better-Choice-than-Excel-for-Analytics

Why Power BI is a Better Choice than Excel for Analytics

Why-Power-BI-Is-a-Better-Choice-than-Excel-for-Analytics

Modern businesses depend on data, and we’re producing more of it than ever before. However, accumulating vast volumes of digital data is useless unless companies can leverage it effectively. Business intelligence tools, such as Power BI and Excel, can play a crucial role in this process.


Are you planning to introduce a platform to assist you in extracting valuable, actionable insights from your data? You have arrived at the right place. By harnessing the capabilities of Power BI and Excel, you can transform raw data into meaningful visualizations and reports, empowering your organization to make informed decisions based on real-time analytics.


Explore how Power BI and Excel can work together to unlock the full potential of your data, streamline your reporting processes, and enhance your business strategies. Let’s embark on this journey to data-driven success! We will go over the fundamentals of Microsoft’s flagship BI app, Power BI, in this article, like what it can do, what it costs, and what changes it can provide to your company.

Characteristics of Power BI Desktop

– Can link to several different data sources. With the Auto-Refresh option, you can keep this data up to date.

– It aids in the rapid modelling of data.

– Using the drag and drop map, it is possible to generate interactive reports.

Characteristics of Power BI Service

– It is a web portal that allows users to monitor and view reports generated with Power BI Desktop.

– Reduce the amount of time spent moving and sharing information.

– Data can be imported from a variety of on-premise sources (Excel, DB, CSV, etc.) or directly documented from a variety of cloud web services, including Azure, MailChimp, Zendesk, and Salesforce.

Why should you Choose Power BI over Excel?

Power BI has many benefits to offer compared to Excel. Listed below are some of the benefits.

- Convenience and Data Size

Power BI can handle massive amounts of raw data as well as several data tables. The analytical tool is capable of loading and processing large amounts of data into a single PBIX file. Multiple tables can be configured and, if necessary, combined based on common fields. In terms of user interface and ease of use, the Power Query Editor and Data Modeling parts are easier to use.

- Data Connectivity and Auto Refresh

One of the key reasons to use Power BI is that it can link to a broad range of data sources, including databases, online sites like Facebook, and Salesforce reports, among others. When compared to the previous data, the data is automatically inserted into the Power BI Workbook. Excel’s ODBC Driver takes up a lot of time.


Power BI has a great choice for keeping data in alignment with the source called Auto Refresh. To have all the reports updated, Power BI Desktop has a Refresh option, and Power BI Service has a Refresh Now, as well as a Scheduled Refresh option. When you choose Refresh, the data in the file’s model is replaced with the most recent information from the original data source. This form of a refresh, which takes place entirely inside the Power BI Desktop program, varies from Power BI’s Refresh Now and Scheduled Refresh solutions.


Power BI uses the information in the database to link to the data sources identified for it, search for updated data, and then upload the updated data into the dataset when you refresh data in a dataset, whether using Refresh Now or setting up a refresh schedule. In Power BI, unlike Excel, the dashboard can be refreshed.

- Reporting and Cross-Filtering

Power BI reporting is much more advanced and engaging than Excel reports, and a single graph can provide numerous perspectives. In Excel, cross-filtering is not possible, but it is possible in Power BI. This has an impact on how users want the filtering for data with table relationships to move.

- Alerts and Emails

To submit a mail and a reminder in Excel, a user has to use the VBA Editor to generate a macro. In Power BI, creating a warning and sending an email when a condition (such as a threshold value) is met has never been easier. This will keep users updated when on the move, and they will be able to view the report at any time and from any place.


Some other features include:


  • Natural Language Query (NLQ): By asking a common person question in Power BI Service, everyone can get a fast response from the current insights. It’s helpful when someone isn’t familiar with the data model but needs fast answers to questions about the insights. Furthermore, this saves a lot of time.
  • Deeper Insights: The backend program, which is driven by intelligence and algorithms, can generate interactive insights at the touch of a button. It will help you save time and interpret data more quickly.
  • Dashboards and Customized Reports: The reports produced can be modified to achieve the desired outcomes. On the dashboard, the report tiles can be rearranged and relocated as desired.

  • Sharing Reports and Access: The reports and dashboards may be shared with the public or only a small group of associates.
  • Downloading and Exporting Dashboards: The Power BI Service lets you download and transfer dashboards in various formats. The dashboards can be submitted as a .PBIX file or exported as a PowerPoint presentation, PDF, or event print.

In Conclusion

In today’s data-driven environment, a fast and efficient data analytics tool is needed. Power BI makes use of business intelligence to ensure that all reports are produced efficiently and provide a wealth of information. Changes in time and technology necessitate the use of a versatile tool like Power BI, which makes work easier and saves time while delivering the best performance. Get a suitable power bi training for your needs or for more information, contact us today!

Register Now and Get 25% Off on Power BI Training.

Share this blog on:

Search Blog

About Us

Global Data 365 is composed of highly skilled professionals who specialize in streamlining the data and automate the reporting process through the utilization of various business intelligence tools.

Follow us on:

Transform Business with Power BI

Get Free Consultation Today!

power bi inventory dashboard

Subscribe to Our Newsletter

Why Power BI is a Better Choice than Excel for Analytics Read More »

Financial Reporting vs. Management Reporting. What is the Difference

Financial Reporting vs Management Reporting

Financial Reporting vs. Management Reporting. What is the Difference

Reporting is essential to the growth of any business. The reports provide information and insight for the business leader when making strategic choices that impact not only all the departments but also the company, particularly when it comes to financial and management reporting and analysis. An organization benefits from reporting, as it helps them to evaluate progress regarding their business objectives in an enterprise, and to make strategic decisions to lead the business towards future success. 


Many company owners are familiar with the standard financial reports they can expect monthly, but many are not familiar with the types of management reports available that could help boost efficiency and profitability for their companies. There are different kinds of management reports available. 


While there are different kinds of strategies in both financial and management reporting, organizations often search for someone who can work in both. That is why it is crucial to know the differences between financial reporting vs. management reporting. 

What is Financial Reporting?

Financial Reporting is directed towards compliance and is used for external purposes. Financial reporting is the method of shaping business strategies by supplying company stakeholders with financial reports. Financial Reporting can also be created to inform internal decisions. However, documents normally appear somewhat different from the data and contain different details. After that, the financial reports are sent to third parties. Financial Reports includes the usual weekly, monthly and annual reports that businesses get each month, including: 


Profit and Loss Statement 
– Balance Sheet 
– Accounts Payable 
Accounts Receivable 
Cash Flows Statement 


Depending on the time span, these reports will cover multiple time periods. The intent of the report, as well as the third parties requests. For instance, annual financial reports to shareholders will include a three-month time. These reports are crucial for any organization. These reports are used by banks, investors, and regulators to accept loans, lines of credit, and other decisions. In many situations, financial reports are needed to ensure adherence to certain laws or regulations. 


At a given point, these reports represent your company’s financial position. They explain the general impression of the success of your company but fail to provide deeper insight into the details of your business operations. They look backwards and don’t even inform you about the performance of the business in the next month or next year. Modern systems for financial restructuring may be altering this dynamic is due to the accumulation of data in real-time, as well as automated processes of reporting now allow the creation of financial reports that contains details of the current financial reports for your organization. 

What is Management Reporting?

With management reporting, companies can have a deeper insight into the financial health of their organization. Management reports provide more insight than financial reporting into the company’s financial situation, performance, and overview of all departments. Management reporting and analysis provide greater insights, which include the ability to segment and analyse information in a broad range of ways. Some of the ways include: 


  • Profit and Loss by Divisions 
  • Realization Rate 
  • Utilization Rate 

Management Reporting is focused on parts of the business instead of an overall view of the organization. By segmentation, you can get into the specifics and examine the drivers of the business. For instance, an example would be the evaluation of how the Marketing Department operates over a given amount of time, or how much benefit a sales employee has had over a certain month. Though, you might want to make sure that you are receiving the correct reports that your organization requires to drive strategic decision-making. 

Key Comparison: Financial Reporting vs Management Reporting

To enhance the performance and profitability of your business, different types of reporting techniques are available. Even though both contain different techniques, companies require someone who can handle both. 


Compared to financial reporting, management accounting is not compulsory and is used for internal purposes mainly. Rather than relying on general accounting data used to reflect a company’s financial situation, management reporting uses main performance indicators, including metrics to evaluate a business’ return on investment (ROI). 


Depending on what kind of financial reporting you use to inform your business plan, management reports are always a key commodity and are almost inevitably going to surpass financial reports when it comes to receiving greater insights. Whereas financial reports are simpler, management reports are more open-ended. The financial reports are critical for avoiding cash flow challenges and making more figures. To make informed strategic decisions, you will need management reports side by side. It is necessary to ensure the right processes and systems for the execution of apt financial and management reports. 

Importance of Financial and Management Reporting

Some businesses only require financial reports every month for various reasons. Because management reports cost them extra money, they tend not to use them. If your business fails to implement management reporting, you could be losing out on details that will help your business expand or keep you from introducing expensive services that do not offer an ROI. Any business requires financial reporting for compliance, to ensure that the figures add up, and to minimize cash flow. To make informed strategic decisions backed by reliable results, your company will also require management reporting. 


The insights gathered from management reporting and analysis are essential to make informed decisions that might be beneficial and profitable for your business. Management reporting also focuses on future data points that help plan for long-term future projects. Any organization will be interested in getting more insight into the whole company’s activities, which tends to improve success, profit, and productivity. 

Best Practices of Doing Financial and Management Reporting

There is a dire need for creating great reports that provide data to the primary stakeholders. Reports are meant to be easily readable and comprehendible by others, so it does not harm in putting more time into ensuring all these reports make a lasting impression on the target audience. 

Listed below are some of the best practices of creating impactful financial reporting vs management reporting: 


– Eye Appealing Reports: Important stakeholders are always busy. Dry, lengthy reports could end up losing their attention or confusing them when they need to search for the data they require. A well-constructed report will make it easier for the leaders to skim through the required information. 


– Automated Processes: It is essential to use automation to create reports, as it can save time. The less time is taken to produce a report, the quicker it can reach the business leaders. With the real-time aggregation of data pulled from the entire organization, you will have a report that will contain the latest data. 


– Implement Graphics and other Visuals: For a report to catch the reader’s attention, it should include graphics and other visual elements that make it easier to read the report. 


– Point-and-Click Design: You can either recruit a graphic designer to create the visuals on the report or use a point-and-click design to navigate easily through the report and deliver it at the right time. 


– Multiple Reports: By automating processes, you can make multiple reports that address the operations of the entire department separately. This gives the business leaders an overview of all operations. 

In Conclusion

A company’s performance and financial stability rely on both financial reporting vs management reporting. Yet, there are a wide variety of possible results when it comes to producing reports that fulfil their goals and deliver the required data on time to the main stakeholders. 


So, whether you are generating reports for external or internal use, the reports must be created in an easy-to-read format that holds the reader’s attention. Here at Global Data 365, we go beyond basic accounting data and offer BI solutions to companies. We help businesses improve performance and profitability by providing insight into the data gathered in real-time through our reporting and analytics solutions. 


Contact us now and speak to our BI experts. 

Get 30 days free license for Jet Reports.

Share this blog on:

Search Blog

About Us

Global Data 365 is composed of highly skilled professionals who specialize in streamlining the data and automate the reporting process through the utilization of various business intelligence tools.

Follow us on:

Still using Jet Basics?

Get Free Upgrade to Jet Reports

jet services

Subscribe to Our Newsletter

Financial Reporting vs Management Reporting Read More »

Business Intelligence with Power BI

Business Intelligence with Power BI: Unlock Data Insights

Business Intelligence with Power BI

Business Intelligence is a crucial aspect for companies to make informed decisions and stay ahead of the competition. Business Intelligence with Power BI offers a simple and fast solution for efficient data visualization, real-time reporting, and predictive analytics, Power BI can turn data into actionable insights.  


The platform is user-friendly interface and ability to integrate with a wide range of data sources make it easy for companies to get started. Adopting Power BI business intelligence can help organizations make data-driven decisions, improve operational efficiency, and drive growth. Start leveraging the power of Business Intelligence with Power BI today. 


Maximize the potential of your data and gain valuable business insights with Power BI services. As a powerful data visualization and reporting tool, Power BI can help you turn raw data into actionable insights, empowering you to make data-driven decisions with confidence. With its interactive dashboards and insightful reports, you can uncover patterns, trends, and opportunities in your data, and transform your business for growth.  

Business Intelligence with Power BI: Key Advantages

There are many options available for organizations for business intelligence then Why Power BIPower BI have edge over other tools when it comes to effective business intelligence. Microsoft Power BI takes lead over other tools because advantages of Power BI are immense that it offers to organizations. Below are the five advantages of Power BI that results in effective business intelligence which will ultimately bring effective results.

- Data Integration with Power BI

Data integration in Power BI is more advanced compared to other tools due to its seamless integration with other Microsoft products and its ability to handle large amounts of data. Power BI allows for easy import of data from various sources such as Excel, SQL Server, and cloud-based platforms.  


Additionally, Power BI’s Direct Query technology allows for real-time data analysis and visualization, providing users with up-to-date insights. Power BI’s powerful data integration capabilities make it an ideal choice for organizations looking to centralize and make sense of their data. 

- Drag and Drop Interface

The drag and drop interface of Power BI allows users to effortlessly manipulate data to create customized visualizations and reports. Unlike other BI tools that require coding or complex data structures, Power BI’s intuitive interface makes it easy for users of all skill levels to explore and analyze data.  


The ability to drag and drop data sources and instantly see visual representations differentiates Power BI from other BI tools, enabling users to quickly gain insights and make data-driven decisions without having to rely on IT support. 

- Power BI Data Modeling

Data Modeling in Power BI allows users to create relationships between different data sets and create a unified view of the data. This helps in easy data analysis and decision making. So, the next time you consider adding a new facility, Power BI will assist you in analyzing the impact it will have on its suppliers. It allows a person to observe the current world while still planning for the future. 


It also integrates with other Microsoft tools, making it a part of a larger data ecosystem, which can be useful for organizations that use multiple Microsoft products. Additionally, Power BI provides a wide range of data visualization options and interactive dashboards, which can help make data insights more accessible to stakeholders. 

- Ease of Use

Power BI is known for its ease of use, as it offers a simple, intuitive interface for data visualization and business intelligence. This makes it accessible to users with a variety of technical backgrounds, allowing them to easily create and share interactive dashboards and reports. 

- Real-Time Collaboration

Power BI offers real-time collaboration features that allow teams to work together and make data-driven decisions in real-time. With Power BI, users can access and share real-time data dashboards, reports, and visualizations from anywhere, on any device. Power BI also provides robust collaboration tools, including comments, annotations, and co-authoring, which enable teams to discuss and make decisions based on the latest data insights.  


Additionally, Power BI’s cloud-based architecture ensures that all team members have access to the most up-to-date data and insights. With its real-time collaboration capabilities, Power BI empowers organizations to make data-driven decisions faster and more effectively. 

- Data Visualization with Power BI

Data Visualization with Power BI allows businesses to turn data into interactive and shareable insights. Power BI stands out from other tools by offering a comprehensive suite of data visualization, reporting, and business intelligence capabilities in one package. With Power BI, users can easily connect to a variety of data sources, perform data transformations, and create interactive dashboards and reports with a simple drag and drop interface. 


The tool also provides collaboration features such as shared dashboards and data stories, enabling teams to work together and make data-driven decisions. Power BI’s advanced data visualization options, such as its 3D map and custom visualizations, set it apart from other data visualization tools, providing a more immersive and engaging way to explore data. 

Learn how to leverage Business Intelligence with Power BI

Global Data 365 is a leading provider of Power BI services for effective business intelligence in the Middle East and Africa. Our team of experts help organizations streamline their data management, gain valuable insights and drive better business decisions. With a focus on delivering customized solutions or required trainings, our services are designed to meet the unique needs of each client and maximize the impact of Power BI on their overall success. 

Schedule a Demo with our Power BI Experts

Share this blog on:

Search Blog

About Us

Global Data 365 is composed of highly skilled professionals who specialize in streamlining the data and automate the reporting process through the utilization of various business intelligence tools.

Follow us on:

Interact Live with Power BI Dashboards

Increase efficiency and deliver success now with Microsoft Power BI. Enjoy a 20% discount on all Power BI services.

dashboards

Subscribe to Our Newsletter

Business Intelligence with Power BI: Unlock Data Insights Read More »

Increase Revenue with Financial Reporting Tools in 2021

Increase Revenue with Financial Reporting Tools

Increase Revenue with Financial Reporting Tools in 2021

Profitable companies recognize that technology can be a strong competitive game-changer. Technology is widely thought of as a crucial enabler of performance. It is, but software technology also provides new revenue streams. Financial Reporting tools and technologies are an underrated key to unlocking value as businesses aim to maximize sales, expand their customer base, and retain customer loyalty. 


Listed below are the five main strategies for increasing profit using your ERP system and comprehensive financial reporting tools. 

- Drive Sales Team

There is a gap between different silos within a company in far too many cases. For example, between sales and finance or between sales and supply chain management. When information isn’t passed back and forth effectively, revenue opportunities are often lost. Think about what happens when a user attempts to order an item that is no longer available. Sales should, in principle, have good visibility into planned delivery dates and be able to position orders on an available-to-promise (ATP) level without compromising customer satisfaction. This fits well if the ATP numbers are reliably correct, but if they aren’t, it can lead to missed delivery dates, cancelled orders, and disappointed customers. 


If a business is mindful of the problem, sales can be notified, and consumers can be directed to alternative products. Direct replacement object feature is available in many modern ERP systems. MD365 Finance & Supply Chain Management (Microsoft Dynamics 365 Finance & Supply Chain Management) is a Microsoft Dynamics 365 Finance; it is referred to as an alternate item (F&SCM), but the effect is the same. However, without good insight into ATP accuracy and missed delivery dates, management can be unaware that a problem exists. 


What percentage of delivery dates are missed due to incorrect ATP numbers, and what is the root cause? Off-the-shelf ERP reports are unlikely to provide you with enough detail to determine if this is happening, why it is taking place, and whether it needs to be addressed. Both the sales and finance divisions have good insight into the program’s success by closely tracking it with custom reports. 

- Customer Demands Compliance

Customers usually also create vendor specifications to simplify the management of incoming inventory. Electronic Data Interchange (EDI) is the default for obtaining the sales order and delivering advanced shipping notices (ASNs) to customers used by big-box retailers. Larger consumers also enforce barcoding conditions. Although those are well-known examples, large companies are increasingly requiring suppliers to adhere to other requirements as well. Walmart declared its plan to reduce CO2 emissions in 2017. Project Gigaton, as the program is called, aims to reduce the company’s carbon footprint across the supply chain. In other words, Walmart will demand that its suppliers keep track of the carbon footprint of the goods they sell to the company. 


Only a few ERP vendors have built processes into their software to monitor this type of data. It is starting to happen in the biggest, most costly programs, but for most organisations, the problem can be solved with a blend of custom user-defined fields and versatile financial reporting tools. Whatever potential requirements can entail, reporting tools may help companies remain in compliance. 


Only a few ERP vendors have built processes into their software to monitor this type of data. It is starting to happen in the biggest, most costly programs, but for most organisations, the problem can be solved with a blend of custom user-defined fields and versatile financial reporting tools. Whatever potential requirements can entail, reporting tools may help companies remain in compliance. 

- Understanding Customer Demands

From the day of the outbreak of the COVID-19 pandemic, most firms ramped up their efforts to boost customer loyalty, with a particular emphasis on their biggest and most profitable customers. Smart companies searched for ways to diversify sales and preserve consumer loyalty as a wave of shutdowns and rapid swings in demand swept the economy. Understanding who the most valued clients are is the first step in attending to them. 


Basic ERP reports aren’t designed to include that degree of complexity and depth. The data is available, but it may be distributed around your organization. When many software systems are involved, it’s difficult to get a comprehensive picture of the situation. Nonetheless, having that exposure is important for customer-focused companies. It’s possible thanks to reliable reporting tools. In addition, having easy access to consumer data opens up new possibilities. 


The situation has drastically changed in the global marketplace. Although determining the effectiveness of media ads and direct mail remains difficult, digital marketing has revolutionized the business world with possibilities for targeting customers with highly targeted messages and assessing the effectiveness of such promotions quickly. 


To provide a basis for digital marketing automation, a new generation of CRM software has emerged. Despite this, many businesses also regard ERP and CRM as separate roles. As a response, there are untapped opportunities to recognize buying habits and common desires among subsets of consumers and create revenue-generating marketing strategies to meet their needs. The correct reporting tools can act as a catalyst for data to be aligned through multiple silos within an enterprise. 

- E-commerce Integration

With the arrival of COVID-19, online shopping has exploded. Many forward-thinking businesses were already trying to strengthen their e-Commerce capabilities before the pandemic. The coronavirus, on the other hand, was a call to action for anyone with a small online presence. Many ERP vendors have taken the finest integration approach to e-Commerce, allowing consumers to choose from among a variety of online sale platforms. 


This allows sellers more versatility and, in certain cases, provides new business possibilities (via Amazon or eBay, for example), but that also makes it more difficult to get a clear picture of product revenue across platforms. When businesses use the automated reporting tools offered by each e-commerce platform provider, they get a much-distorted vision of their online business. Business executives will obtain consistent visibility into all their sales operations, through all sales channels, including e-commerce, by putting data together under one platform and then validating it so that it offers an apples-to-apples comparison. 

- Data Visualization

Efficient reporting tools ensure that important performance metrics are accessible across the entire enterprise. It is more important than ever for business leaders to have a real-time understanding of what is going on. Management needs to know whether the supply chain isn’t running smoothly, whether backorders are piling up, or whether consumer quotes aren’t converting into purchase orders. 


Simple ERP and CRM report also provide routine preliminary data, but they fall short when it comes to calculating the distinctive numbers and features that are specific to each sector. The ability to run ad hoc queries, ask questions specific to your company, and receive answers that represent reliable, up-to-date data from your ERP, CRM, and other systems is critical to running a successful business in today’s fast-paced world. 

- Automate Processes

Reporting takes up a lot of time for most organisations because it requires time-consuming manual procedures such as copying and pasting data from exported CSV files or device reports or manually inserting data into Excel spreadsheets. These types of processes often create errors, resulting in a lack of trust in the data being recorded. Business leaders often share dissatisfaction with their software systems’ inability to provide clear information on time. If an organisation has straightforward, reliable, and timely information based on real-time data, everybody in the organization will function on the same collection of facts. As a result, the management team will be able to spend less time discussing numbers and more time-solving issues and improving business outcomes. 

In Conclusion

Global Data 365 connects to over 140 different ERP systems to provide financial reporting tools. For nearly three years, we have been assisting business leaders in obtaining the data they need effectively, reliably, and efficiently to improve financial knowledge and increase sales. Contact us today for a live demo if your company wants to boost sales in the coming year 

Get 30 days free upgrade to Jet Reports.

Share this blog on:

Search Blog

About Us

Global Data 365 is composed of highly skilled professionals who specialize in streamlining the data and automate the reporting process through the utilization of various business intelligence tools.

Follow us on:

Interact Live with Dashboards

Increase efficiency and deliver success now with Microsoft Power BI. Enjoy a 20% discount on all Power BI services.

dashboards

Subscribe to Our Newsletter

Increase Revenue with Financial Reporting Tools Read More »

Talk to Our BI Experts!