Ayesha Binte Habib

Ayesha B. Habib is Global Data 365's Marketing Manager, managing marketing, branding and content covering Microsoft Dynamics 365, Power BI, Jet Analytics, and business intelligence topics. She works closely with Global Data 365's technical and training team to turn ERP and reporting concepts into practical, accurate guidance for finance, IT and BI leaders.

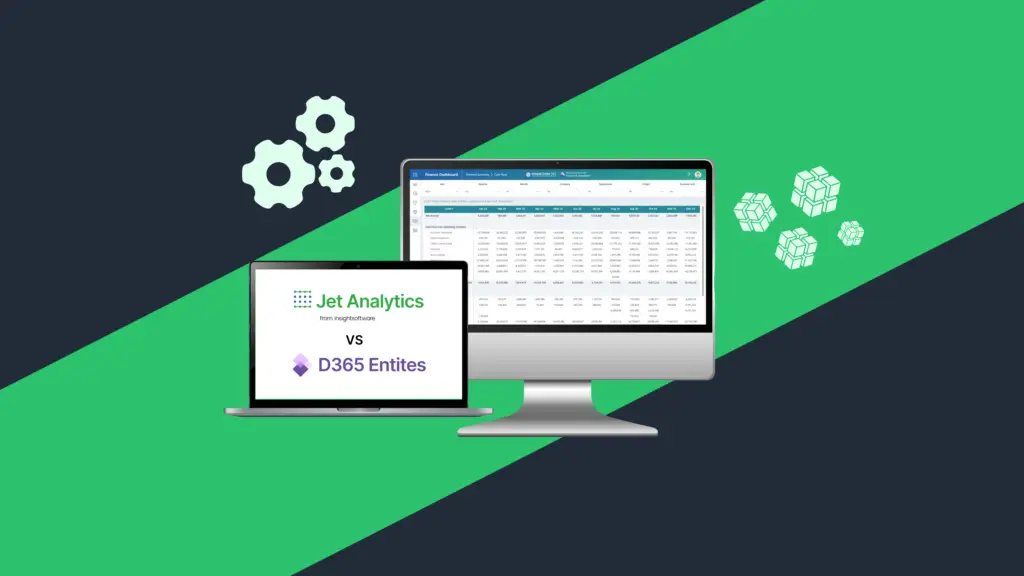
Jet Analytics vs D365 Data Entities 

Jet Analytics vs D365 Data Entities: Choosing the Right Power BI Reporting Strategy for Dynamics 365 F&O

Jet Analytics vs D365 Data Entities 

Each Dynamics 365 Finance & Operations (D365 F&O) team eventually asks the same question: how will Power BI actually connect to D365 F&O? On the surface, it looks like a simple decision. In practice but it is one of the most consequential architecture choice a finance or IT leader will make, because it not only determines how fast reports load but how much historical data survives and how many developers get pulled into every new reporting request and how much the ERP upgrade cycle will cost the business in rework. Two paths dominate this conversation; jet analytics and data entities.

The first is connecting Power BI directly to D365 Data Entities through OData or Azure Data Lake exports and the path most organizations default to because it requires no additional licensing. The second is Jet Analytics, a purpose-built data warehouse and analytics platform designed specifically for Microsoft ERP environments. 

Both approaches can technically get D365 data into a Power BI report. What separates them is everything that happens after that first report is created and shipped: performance under real user load, resilience through D365 upgrades, historical trending, data governance and how much of the IT team’s time gets consumed responding to “can you add one more field” requests. This blog breaks down the Jet Analytics vs D365 Data Entities decision in detail, so finance, IT and BI leaders can choose an architecture that scales with the business rather than one that needs to be rebuilt every time D365 F&O changes.

The Reporting Challenge Inside D365 F&O

D365 F&O stores business data in a complex and normalized OLTP schema that was built to process transactions reliably not to answer analytical questions. That distinction matters more than most teams realize until they try to build production-grade Power BI reporting directly on top of the live system. 


When pulling meaningful and performant reports straight out of this structure without an intermediary layer, it introduces several architectural risks:
 

  • High query complexity caused by deeply joined transactional tables 
  • Risk of performance degradation on the live D365 environment during report execution 
  • Limited historical data retention within the operational system itself 
  • No consistent, governed semantic layer to keep cross-functional reporting aligned 

These risks don’t disappear because a report “works” in testing. They resurface later during month-end close, during a system upgrade or the first time a second business unit asks for the same numbers and gets a different answer.

Two Common Approaches to Power BI Reporting on D365 F&O

Organizations typically choose between two architectural paths when connecting Power BI to D365 F&O: 

  1. Direct via Data Entities – Power BI connects to D365 F&O through OData feeds or Azure Data Lake exports, pulling data directly from virtual entities or staging tables.

Jet Analytics  an ETL-based platform that extracts data from D365 F&O, transforms it into a clean, pre-modelled data warehouse and exposes it to Power BI through optimized semantic models. 

Recommendation: Jet Analytics is the recommended approach for organizations that require production-grade, scalable, and maintainable BI reporting on D365 F&O. The direct Data Entities approach is suitable only for ad-hoc exploration or narrow, low-frequency reporting needs. 

Jet Analytics vs D365 Data Entities: Detailed Comparison

The table below lays out a side-by-side comparison across the evaluation dimensions that matter most once reporting moves from a proof-of-concept into daily business use. 
 

FeatureJet Analytics ClassicD365 Data Entities → Power BI
Data Architecture Dedicated analytical data warehouse with star/snowflake schema. Optimised for BI workloads.Flat OData or Azure Data Lake exports of normalised OLTP tables. Power BI must perform heavy transformation.
Performance Queries run against a pre-built, indexed data warehouse. Sub-second response on large datasets.OData calls are throttled by D365 API limits. Large datasets cause timeouts or require incremental workarounds.
Impact on D365 Zero impact on live D365 environment. ETL runs on a separate database.OData queries execute against the D365 application tier, risking performance degradation.
Data History Full historical data retained in the warehouse from initial load onwards. Supports year-on-year comparison.Limited to what is currently in D365. Deleted or archived records may be lost. Historical trending is limited.
Data Quality ETL layer enforces cleansing, duplication, and business logic before data reaches Power BI.Raw D365 data is exposed as-is. Data quality issues must be handled inside Power BI or Power Query.
AI Readiness LimitedDesigned for AI and Copilot workloads
Pre-built ContentShips with 200+ pre-built KPIs, measures, and reports mapped to D365 F&O modules out of the box.No pre-built semantic layer. All measures and report logic must be developed from scratch in Power BI.
Semantic LayerGoverned, reusable semantic model with business-friendly naming and shared definitions.Each Power BI report builds its own model, leading to inconsistent definitions across reports.
Maintenance Upgrade-resilient. Jet maps changes in D365 schema automatically or via managed updates.D365 upgrades may break OData entity structures, requiring Power BI report rework after each update.
Scalability Designed for enterprise scale. Supports multi-company, multi-currency, multi-ledger consolidation.Scaling requires more complex Power BI Premium configurations and OData pagination handling.
Development Speed Pre-built models accelerate time-to-value. New reports can be built in days, not weeks.Each report requires full data modelling from scratch. Long development cycles for complex reports.
Licensing Additional licensed product (Jet Analytics). Cost justified by reduced development and support overhead.Scaling requires more complex Power BI Premium configurations and OData pagination handling.
Data Access Layer Connects directly to D365 tables via Azure Synapse Link for Dataverse. Full table and field access with no API dependency.Limited to fields exposed through pre-built or custom Data Entities. New data requires entity
New Data Requests IT team adds missing tables or fields via drag-and-drop in Jet Analytics. No developer or release cycle needed.Each new field requires a developer to build or extend a Data Entity — ongoing development cost for every new requirement.
Data Sources Single warehouse supports D365 F&O plus any other source system (CRM, HR, third-party). One unified model in Power BI.Scoped to D365 F&O only. Combining with other systems requires separate Power BI datasets and manual joins.
Ease of Use Drag-and-drop interface accessible to the broader IT team. Low learning curve; no specialist ERP developer required.Requires specialist D365 developer skills (X++, OData) plus advanced Power BI knowledge to build and maintain.
A few rows deserve extra attention, because they’re the ones that determine whether a reporting program scales gracefully or collapses under its own maintenance burden. The Performance, Data History and Maintenance are where the direct Data Entities approach tends to hit its ceiling fastest and where most organizations end up re-evaluating their architecture six to twelve months after go-live.

Why Jet Analytics Outperforms the Direct Data Entities Approach?

– Purpose-Built for the Microsoft ERP Ecosystem 


The Jet Analytics has been developed exclusively for the Microsoft Dynamics ecosystem, with native connectors for D365 F&O, D365 Business Central and legacy AX versions. That focus shows up in three practical ways: 

  • The data model reflects D365 F&O business logic, not raw database tables 
  • Module-level coverage spans Finance and Supply Chain 
  • Dimensions and fact tables are pre-mapped to standard ERP reporting needs 

– Protecting the Live ERP Environment 


One of the most critical concerns for any D365 F&O administrator is the risk of reporting queries degrading ERP performance during business hours. With Jet Analytics: 

  • All analytical queries run against a separate SQL Server or Azure SQL data warehouse 
  • The ETL process runs on a schedule during off-peak hours, minimizing system load 
  • The live D365 environment is never queried at report runtime 

By contrast, connecting Power BI directly to OData Data Entities places query load on the D365 application tier itself which can visibly affect end-user experience during business hours, particularly around period close. 

– Consistent, Governed Data Definitions 


In organizations with more than one Power BI developer, a familiar problem emerges: the same metric gets defined differently across reports. “Revenue” in one dashboard might include intercompany transactions; the same word in another dashboard might exclude them and jet analytics closes that gap through:


  • A centralized semantic layer with agreed, documented measure definitions 
  • Business-friendly naming conventions accessible to non-technical users 
  • Shared dimensions that keep filtering consistent across every report 

– Built for Upgrade Resilience 


Microsoft releases regular updates to D365 F&O, and those updates can modify the underlying data entity structures without warning. Under the direct Data Entities approach, each major upgrade carries real risk of breaking existing Power BI reports overnight. The Jet Analytics mitigates this by:


  • Abstracting the Power BI model from the raw D365 schema 
  • Providing managed updates to the Jet data warehouse mappings, aligned to D365 release cycles 
  • Letting Jet absorb schema changes so Power BI reports don’t need to be rebuilt after every release 

– Accelerated Time-to-Value 


Jet Analytics ships with over 200 pre-built KPIs and measures covering the core D365 F&O modules, which means:


  • Immediate access to financial, operational, and supply chain reports from day one 
  • A foundation development teams extend rather than build from a blank canvas 
  • Reduced dependency on specialist Power BI developers for standard reporting needs 

– Multi-Company and Multi-Currency Consolidation 


For organizations operating across multiple legal entities or currencies, Jet Analytics provides native support for:
 

  • Cross-legal-entity financial consolidation with intercompany elimination 
  • Multi-currency reporting with currency translation handled at the warehouse level 
  • Group-level and entity-level reporting from a single Power BI model 

Achieving equivalent functionality through Data Entities alone requires complex, custom DAX and Power Query logic which significantly increases both development time and ongoing maintenance cost.

Direct Table Access via Azure Synapse Link: Removing the API Bottleneck 

A fundamental limitation of the Data Entities approach is that every single piece of information surfaced in Power BI must first be exposed through a D365 Data Entity. These entities are essentially API wrappers and if the field or table an analyst needs doesn’t already have a corresponding entity, it simply cannot be accessed without new development work. 

That constraint creates a recurring cost and bottleneck. Every time a business user requests a new field or metric, a developer has to: 

  • Identify the underlying D365 table and field
  • Build or extend a Data Entity to expose that field via the API 
  • Test and deploy the entity change, often requiring a full release cycle 
  • Update the Power BI dataset to consume the new entity output 

Jet Analytics bypasses this entirely by connecting directly to the underlying D365 F&O tables through Azure Synapse Link for Dataverse. Instead of routing through the API layer, Jet reads raw tables replicated from D365 into Azure Data Lake giving it full visibility into every table and field in the system, including those that have never been exposed by any Data Entity. 

Adding a previously unavailable field to a Power BI report does not require a developer or a code deployment. IT team members can locate the table and field directly within the Jet Analytics interface and include it in the data model using drag-and-drop eliminating recurring development costs as reporting requirements evolve.

How Jet Analytics Connects via Azure Synapse Link?

Understanding the underlying connection architecture makes it clear why Jet Analytics delivers more control, flexibility, and performance than the Data Entities / OData path. 

The Data Entities / OData Architecture (Current Approach) 

When Power BI connects to D365 F&O via Data Entities, the data flow passes through the application API tier: 

  1. Power BI sends a query request to the D365 F&O application tier via OData 
  2. The Data Entity — an API wrapper — translates that request into one or more underlying database queries 
  3. Results return through the OData API, subject to row limits, throttling, and pagination constraints 
  4. Power BI receives the data and must perform further transformation and modelling inside the report layer

This architecture places load on the live D365 application tier, is constrained to only what existing entities expose, and is subject to API throttling limits that cause timeouts on large datasets. 


The Jet Analytics Architecture via Azure Synapse Link

Jet Analytics connects at the database replication layer, bypassing the API entirely. The data flow looks like:

Jet Analytics vs D365 Data Entities for F&O
StepFlowDescription
Step 1D365 F&O → Azure Synapse Link for Dataverse Microsoft’s native replication service continuously copies D365 F&O tables — not entities — directly into Azure Data Lake Storage Gen2. This runs outside the D365 application tier with no performance impact on the ERP.
Step 2Azure Data Lake → Jet Analytics ETL Jet Analytics reads the replicated tables directly from the Data Lake. The ETL engine transforms, cleanses, and loads data into a structured analytical data warehouse. All tables and fields are available — no API gatekeeping, no entity dependency.
Step 3Jet Analytics Warehouse → Model Extension via Drag-and-Drop IT team members browse the full table catalogue and add any table or field to the data model visually. No code, no developer, no deployment cycle. Other data sources can also be added alongside D365 data in the same warehouse.
Step 4Jet Analytics Warehouse → Power BI Power BI connects to the Jet Analytics warehouse via a fast, direct SQL connection against a clean, indexed OLAP structure. No OData limits, no API throttling, no impact on D365 performance.

What Full Table Access Means in Practice?

Because Jet Analytics operates against the full catalogue of replicated D365 tables rather than the limited subset exposed through Data Entities it delivers complete control over the analytics database: 

  • Access to every standard and custom D365 F&O table replicated via Synapse Link 
  • Visibility of fields that have never been included in any Data Entity 
  • Ability to create relationships between any two tables in the catalogue 
  • No dependency on the D365 development team to expose new data for reporting 
  • Freedom to add additional source systems alongside D365 in the same warehouse 

In summary: the Data Entities approach gives you a window into D365 limited to what the API permits you to see. The Jet Analytics approach via Synapse Link gives you the full database, with complete control over which tables and fields are included in your analytics platform, without writing a single line of code. 

When Direct Data Entities May Still Be Sufficient?

The direct Data Entities approach isn’t wrong in every scenario it simply has a narrow window where it makes sense: 

  • Ad-hoc, exploratory analysis by a single developer, not intended for production use 
  • Narrow, low-volume reporting on a single D365 entity with simple filtering requirements 
  • Organizations in the very early stages of D365 adoption, before reporting requirements mature 

For any scenario involving multiple business users, recurring reports, finance or management reporting, or cross-module data, the limitations of the direct approach will quickly outweigh the cost savings of not licensing Jet Analytics.

Frequently Asked Questions?

For production-grade, recurring, or multi-user reporting, yes and jet offers sub-second query performance, full historical data retention, and a governed semantic layer none of which the direct Data Entities approach can reliably deliver at scale. 

It can OData queries execute against the D365 application tier, which means heavy reporting load competes with day-to-day transactional processing and can degrade the end-user experience. 

The Jet Analytics connects through Azure Synapse Link for Dataverse, reading replicated D365 F&O tables directly from Azure Data Lake bypassing the OData API layer and its row limits, throttling, and entity dependency entirely. 

No, Jet Analytics abstracts the Power BI model from the raw D365 schema and provides managed updates aligned to D365 release cycles, so schema changes are absorbed without requiring report rework. 

Yes. Jet Analytics supports ingestion from multiple source systems into a single warehouse, enabling one unified Power BI model across D365 F&O, CRM, HR, and third-party platforms something Data Entities cannot do on their own. 

Recommendation: Adopt Jet Analytics as the Standard Analytics Platform for D365 F&O

Adopt Jet Analytics as the standard analytics platform for D365 F&O reporting. The investment in Jet Analytics licensing is offset by the significant reduction in Power BI development effort, report maintenance overhead, and the risk of ERP performance incidents caused by uncontrolled direct queries. 


The direct Data Entities path will always look cheaper on day one, because it uses licensing the organization already owns. But that math changes quickly once a second business unit needs the same data, once the first D365 upgrade breaks a dashboard mid-quarter, or once someone in finance asks for a number from eighteen months ago that the live system no longer holds. Jet Analytics is built to remove those failure points before they become production incidents turning Power BI on D365 F&O from a fragile, developer-dependent process into a governed, scalable reporting platform the whole business can rely on. 

Ready to move from Data Entities to a governed Jet Analytics warehouse?

Share this blog on:

Search Blog

About Us

Global Data 365 is composed of highly skilled professionals who specialize in streamlining the data and automate the reporting process through the utilization of various business intelligence tools.

Follow us on:

Still using Jet Basics?

Get Free Upgrade
to Jet Reports

jet services

Subscribe to Our Newsletter

Jet Analytics vs D365 Data Entities Read More »

Jet Analytics Classic vs. New Jet Analytics

Jet Analytics Classic vs. New Jet Analytics: A Complete Comparison

Jet Analytics Classic vs. New Jet Analytics

Organizations using Microsoft Dynamics have relied on Jet Analytics for years to centralize ERP data, simplify reporting, and improve business decision-making. Today, however, the platform has evolved significantly. Businesses evaluating their reporting strategy now face an important question: Should they continue with Jet Analytics Classic or move to the new cloud-native Jet Analytics platform? 


The answer is no longer just about reporting. Modern organizations are investing in AI, Microsoft Fabric, Snowflake, Copilot, and scalable cloud data platforms. That means the underlying data architecture matters more than ever. 


This guide explains the differences between Jet Analytics Classic vs. new Jet Analytics, what has changed, and how each platform fits different business requirements.

What Was Jet Analytics Classic?

Jet Analytics Classic was designed to help Microsoft Dynamics customers build a centralized SQL Server-based reporting environment. Instead of creating reports directly from ERP databases, organizations could extract data into a dedicated warehouse, transform it into a consistent structure, and publish trusted datasets for reporting. 


A typical Jet Analytics Classic deployment followed this architecture: 


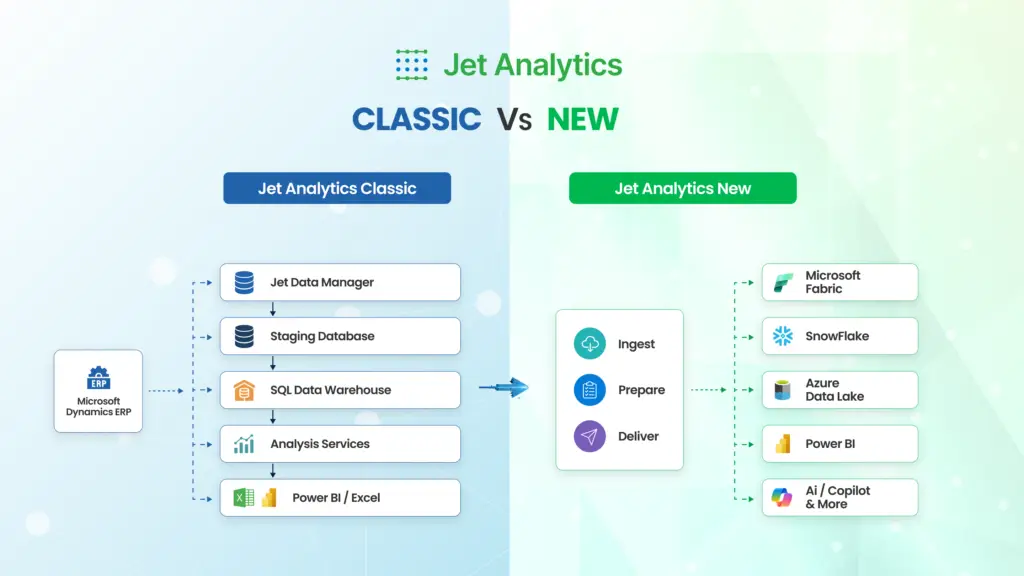
Jet Data Manager → Staging Database → SQL Data Warehouse → SQL Server Analysis Services (SSAS) → Power BI or Excel 


This approach separated reporting workloads from operational ERP systems, improving both reporting performance and data consistency. 

Jet Data Manager extracts data from Microsoft Dynamics ERP and other business applications. The data is first loaded into a Staging Database, where it is cleaned and standardized before moving into a centralized SQL Data Warehouse. From there, SQL Server Analysis Services (SSAS) creates optimized semantic models that Power BI and Excel use for fast, governed reporting. By separating reporting from the live ERP database, organizations can generate complex reports without affecting transactional performance. 


For many organizations, Jet Analytics Classic became the standard enterprise reporting tool because it automated data warehouse creation while reducing manual SQL development. 

Why Jet Analytics Classic Was Successful?

Jet Analytics Classic solved several common reporting challenges for Microsoft Dynamics users. Instead of building SQL scripts manually, organizations could automate data extraction, create repeatable ETL processes, and maintain consistent reporting models across departments. 


It also introduced governed dimensions, standardized measures and reusable business logic, reducing the number of conflicting reports generated across finance, operations and management teams. 

For businesses running SQL Server infrastructure, this architecture provided a reliable and well-understood foundation for enterprise reporting.

Where Jet Analytics Classic Shows Its Age?

Business intelligence has changed considerably over the last decade. 


Organizations are no longer building reporting environments solely for dashboards. They are preparing data for machine learning, AI assistants, Copilot experiences, predictive analytics, and cloud-native applications. 


Traditional SQL Server data warehouses remain effective for reporting, but they require additional work when integrating with platforms like Microsoft Fabric, Snowflake, or modern cloud data lakes. 


As companies start using cloud setups keeping many ETL processes, systems and manual connections gets harder and harder. This change is one of the reasons the new Jet Analytics platform was created.

What Is the New Jet Analytics?

The new Jet Analytics is a cloud-native data integration platform built through insightsoftware’s expanded partnership with TimeXtender. 


Rather than focusing only on building SQL Server warehouses, the platform helps organizations create an AI-ready data foundation that supports reporting, analytics, cloud platforms, and future AI initiatives. 


Instead of a warehouse-first approach, the platform follows a modern workflow: 

Ingest → Prepare → Deliver 

Data is first ingested from Microsoft Dynamics, cloud applications, databases and other business systems. It is then prepared using automated data transformations, business rules, and governance, with support for Spark and PySpark without requiring extensive coding. Finally, the curated data is delivered to modern platforms such as Microsoft Fabric, Snowflake, Azure Data Lake and Power BI, where it becomes available for reporting, analytics, machine learning, and Copilot experiences. 


This framework allows organizations to collect data from multiple business systems, transform it using governed pipelines, and publish trusted data to platforms such as Microsoft Fabric, Snowflake, Azure Data Lake, Power BI and other analytical environments. 

The result is a flexible cloud data platform that supports both traditional reporting and modern analytics. 

A Modern Data Platform Instead of Just a Data Warehouse

The biggest change is philosophical. Jet Analytics Classic focused on creating a reporting database. The new Jet Analytics focuses on creating a governed, reusable data foundation that serves multiple consumers simultaneously. 


Instead of preparing data separately for Power BI, AI projects, data science teams, and business users, organizations prepare data once and deliver it wherever it is needed. 


This approach aligns closely with today’s modern data stack, where trusted data becomes a shared organizational asset instead of existing inside isolated reporting systems.

Jet Analytics vs New Jet Analytics: Architecture Comparison

Jet Analytics Classic follows a structured SQL Server architecture that is highly effective for organizations committed to Microsoft SQL infrastructure. 


The new Jet Analytics introduces a more flexible architecture capable of connecting cloud storage, distributed processing engines, and multiple analytics platforms without requiring organizations to redesign their data strategy every time a new technology is introduced. 


Rather than replacing proven governance practices, it extends them into modern cloud ecosystems.

Key Comparison: Jet Analytics Classic vs. New Jet Analytics

Understanding AR vs AP becomes easier when viewed side-by-side:


FeatureJet Analytics ClassicNew Jet Analytics
Architecture SQL Server Data WarehouseCloud-native data platform
Primary Focus Enterprise reportingAI-ready data foundation
Deployment Mostly on-premises or hosted SQLCloud-first and hybrid
Data Processing SQL Server ETLAutomated cloud pipelines
Data Delivery SSAS, Power BI, ExcelMicrosoft Fabric, Snowflake, Azure Data Lake, Power BI
AI Readiness LimitedDesigned for AI and Copilot workloads
Security SQL-based permissionsZero-access security architecture
Transformation SQL workflowsNo-code Spark and PySpark transformations
Scalability SQL Server dependentCloud-scale architecture
Ideal For Traditional reportingModern analytics and AI initiatives

Microsoft Fabric Integration

One of the things about this is that it supports Microsoft Fabric right out of the box. 

A lot of companies are using Microsoft Fabric for reporting and other things like data engineering and artificial intelligence because it has everything they need in one place. This means they can do things like look at data lakes and analytics and engineering and governance and business intelligence all at the time. 

The new Jet Analytics proves to be helpful because it lets companies get their ERP data ready and put it into Microsoft Fabric without having to do a lot of extra work to make it all connect. This makes it easier to get started with reporting and people can use their ERP information right away with things, like Power BI and Copilot and other advanced analytics tools. 


For companies that are starting to use Microsoft Fabric this is a deal because it makes it a lot simpler to get their ERP data ready and use it with Microsoft Fabric. 

Snowflake Support

Modern companies often keep their data inside Snowflake because it can handle a lot of information and works faster. The new Jet Analytics works with Snowflake as a place to send data so companies can get Microsoft Dynamics data together with CRM, finance, HR, manufacturing and other kinds of data. 


Rather than having separate reporting databases businesses can create one single data system where all the different teams use the same correct information. This feature makes Jet Analytics a better tool for data warehouses, for companies that are focused on using the cloud. 

AI-Ready Data Foundation

Artificial intelligence depends on trustworthy data. 

With poor governance, duplicate records, inconsistent business definitions and disconnected systems, all of them results in the reduced and poor quality of AI-generated insights. 


The new Jet Analytics focuses on preparing clean, governed and reusable datasets before they reach AI applications. This is what many vendors now describe as an AI-ready data foundation. Instead of using raw data from enterprise resource planning systems companies are now using standardized business information that is ready to use. This helps to make the AI output more consistent and reliable. It also makes it easier to track where the information is coming from and to have confidence in the results that AI systems are producing. 


This is where the AI ready data foundation comes in it helps companies to get the most out of their intelligence systems.

Faster Data Pipelines

Building traditional ETL processes often requires significant SQL development, manual documentation, and ongoing maintenance. The new Jet Analytics automates much of this work using metadata-driven development and no-code transformation capabilities. 


Companies can manage data pipelines quickly while keeping everything in order, across different environments. When the needs of the business change people can make these changes in one place of having to redo many separate connections this results in dramatically shorter implementation cycles and easier long-term maintenance.

Zero-Access Security

Security requirements continue to increase as organizations adopt cloud platforms. 


The new Jet Analytics introduces a zero-access security model designed to reduce unnecessary exposure to production data. 


Instead of granting broad access to operational databases, data is governed through managed pipelines and controlled delivery mechanisms. This improves compliance while allowing data teams, analysts, and business users to work from trusted datasets without compromising operational systems.

Governed Semantic Layer

Reporting becomes inconsistent when different teams calculate the same KPI differently. 

A governed semantic layer solves this problem by defining business metrics once and making them available across reporting tools. 


When people make dashboards in Power BI or look at data through Microsoft Fabric everyone is working with the definitions. This really helps to cut down on arguments about reports. It also makes people feel more confident when big decisions are made by executives. 


For companies that have to deal with a lot of reports having a governed layer in place is a really smart thing to do it is one of the best things they can do for the long run, for Power BI and Microsoft Fabric and all the reports they have to manage.

Governed Semantic Layer

Reporting becomes inconsistent when different teams calculate the same KPI differently. 


A governed semantic layer solves this problem by defining business metrics once and making them available across reporting tools. 


When people make dashboards in Power BI or look at data through Microsoft Fabric everyone is working with the definitions. This really helps to cut down on arguments about reports. It also makes people feel more confident when big decisions are made by executives. 


For companies that have to deal with a lot of reports having a governed layer in place is a really smart thing to do it is one of the best things they can do for the long run, for Power BI and Microsoft Fabric and all the reports they have to manage.

Jet Analytics for Microsoft Dynamics Data Warehousing

Microsoft Dynamics environments often include finance, sales, purchasing, inventory, manufacturing, and operations data spread across multiple modules. 


The new Jet Analytics simplifies data warehousing by bringing these datasets together into a governed platform ready for reporting and analytics. 


Organizations can also bring in systems that are not part of Dynamics. This means they have one place to get all the information they need of having to deal with separate reporting systems that are not connected. This makes the platform a good choice for businesses that want to do more, than report on their ERP. 

Should You Stay with Jet Analytics Classic?

Jet Analytics Classic remains a strong solution for organizations with stable reporting requirements. 

It continues to make sense when businesses: 

  • Operate entirely on-premises 
  • Depend heavily on SQL Server infrastructure 
  • Have mature SSAS reporting environments 
  • Do not plan immediate cloud or AI initiatives 
  • Prefer maintaining existing reporting investments 

For these organizations, Classic still delivers reliable enterprise reporting for decisions that matter.

When Should You Move to the New Jet Analytics?

When migration becomes much more compelling since organizations are modernizing their data strategy time to time. 

The new platform is an excellent fit when businesses: 

  • Are adopting Microsoft Fabric 
  • Plan to use Snowflake 
  • Want an AI-ready data platform 
  • Need faster data integration 
  • Are replacing legacy ETL processes 
  • Want to simplify cloud deployments 
  • Need scalable governed data pipelines 
  • Plan to use Microsoft Copilot with business data 

The move is not simply an upgrade but it represents a shift toward a modern data architecture. 

Does Migration Mean Starting Over?

A common concern is whether moving from Jet Analytics Classic requires rebuilding every existing report. 


In most cases, the answer is no. 


Organizations can migrate incrementally by preserving reporting logic, reusing business definitions where appropriate and modernizing the underlying data platform over time. 


The migration strategies vary depends on existing architecture, customizations and reporting requirements, but businesses do not necessarily need to replace everything simultaneously. A phased migration typically delivers lower risk while allowing teams to continue using existing reports during the transition.

Final Thoughts

Comparing Jet Analytics Classic vs. new Jet Analytics is really a comparison between two generations of enterprise data architecture. 


Jet Analytics Classic was designed to build trusted SQL Server reporting environments. 


The new Jet Analytics is designed to build governed, cloud-native, AI-ready data foundations that support reporting, analytics, Microsoft Fabric, Snowflake, and future AI initiatives. 


Neither platform is universally better. The right choice depends on your organization’s infrastructure, cloud strategy, reporting maturity, and long-term data goals. 


However, for organizations investing in AI, cloud analytics, or Microsoft Fabric, the new Jet Analytics provides a stronger foundation for the future. 

Frequently Asked Questions

Is Jet Analytics Classic still supported?
Yes. Jet Analytics Classic continues to be supported for existing customers. However, organizations planning future cloud, AI, or Microsoft Fabric initiatives should evaluate the new Jet Analytics platform to align with modern data architectures. 

Jet Analytics Classic is a SQL Server-based enterprise reporting platform focused on building traditional data warehouses vs the new Jet Analytics is a cloud-native data integration platform that supports Microsoft Fabric, Snowflake, AI-ready data, governed pipelines, and modern cloud architectures.

Yes. The new Jet Analytics supports Snowflake as a native cloud destination, making it easier to prepare ERP data for enterprise analytics without building custom integrations.

Yes. The new Jet Analytics can ingest Microsoft Dynamics data, prepare it through governed pipelines, and deliver it directly into Microsoft Fabric for reporting, analytics, and AI workloads.
An AI-ready data foundation is a governed data environment where information is clean, standardized, secure, and consistently defined before it is used by AI applications, analytics platforms, or business intelligence tools.
Yes. Most organizations can migrate gradually from old jet analytics to new jet analytics by modernizing their data architecture while preserving valuable reporting assets and minimizing disruption to business users.

Ready to Modernize Your Data Platform?

Whether you’re evaluating Jet Analytics Classic vs New Jet, planning a migration to the new Jet Analytics or building an AI-ready data foundation with Microsoft Fabric or Snowflake, the right implementation strategy makes all the difference. 

Global Data 365 helps organizations assess their current environment, design scalable data architectures, and implement modern Jet Analytics solutions that support reporting today and AI initiatives tomorrow. 

Talk to Experts and discover which Jet Analytics approach best fits your business.

Share this blog on:

Search Blog

About Us

Global Data 365 is composed of highly skilled professionals who specialize in streamlining the data and automate the reporting process through the utilization of various business intelligence tools.

Follow us on:

Still using Jet Basics?

Get Free Upgrade
to Jet Reports

jet services

Subscribe to Our Newsletter

Jet Analytics Classic vs New Jet Analytics Read More »

HR analytics complete guide

The HR Analytics Process: Turning Workforce Data into Strategic Business Decisions

HR analytics complete guide

Organizations generate vast amounts of employee data every day, from attendance records and performance evaluations to recruitment metrics and employee engagement surveys. However, collecting data alone does not improve workforce performance. A business must transform raw workforce information into insights that actually support operational strategic decision-making through effective HR analytics process. The HR Analytics Process becomes a necessity because HR analytics provides a structured framework for converting workforce data into actionable intelligence. By following a defined process, organizations can identify all the KPIs that affect the business and their operational strength such as workforce trends, employee productivity, turnover, recruitment efforts and align HR initiatives with broader business objectives.


Modern businesses increasingly rely on workforce analytics to gain visibility into operational performance. Understanding the Human Resource analytics process is the first step toward building a more agile and productive workforce.

What Is HR Analytics?

HR analytics is the practice of collecting, organizing, analyzing and interpreting workforce data to improve business outcomes. It combines HR expertise with data analysis techniques to help organizations understand employee behavior, their ROI, the overall operational performance.

Unlike traditional HR reporting, which focuses on historical information, HR analytics helps organizations to uncover patterns and support proactive decision-making.


Effective HR analytics helps organizations answer questions such as:

  • Why is employee turnover increasing?
  • Which departments have the highest absenteeism rates?
  • How can recruitment efficiency be improved?
  • What factors influence employee performance?
  • Which workforce initiatives deliver the highest ROI?

By answering all the above questions, HR teams move from administrative functions to strategic business partners.


The 8-Step HR Analytics Process

8 steps of hr analytics process

1. Set Clear Objectives

Every successful HR analytics initiative begins with a clearly defined objective. The organization must identify the workforce challenges or business goals they want to address.

Examples include:

  • Reducing employee turnover
  • Improving workforce productivity
  • Optimizing recruitment performance
  • Enhancing workforce planning

Without clear objectives, data collection and analysis can become unfocused and ineffective.


2. Collect Relevant Workforce Data

The next step involves gathering data from relevant HR systems and sources, since that works as a base for your workforce analytics planning, the data may include:

  • Employee demographics
  • Attendance records
  • Payroll information
  • Recruitment metrics
  • Performance evaluations
  • Learning and development records

Your data quality plays a critical role in the success of your HR analytics initiatives. With accurate and consistent data you can rely on your insights with evidence.


Payroll data is often the messiest input, especially across regions with different labor laws. Localized payroll solutions help keep this data accurate, for example by ensuring UAE gratuity and WPS compliance, before it reaches the analytics stage.


3. Prepare and Organize Data

If you have raw workforce data it might contain inconsistencies, duplicate records or missing values. Before analysis can begin, organizations must clean, standardize and organize their data.


Data preparation helps ensure:

  • Consistent reporting
  • Improved accuracy
  • Reliable workforce metrics
  • Better analytical outcomes

This stage forms the foundation for meaningful workforce analysis.


4. Analyze Workforce Data

The fundamental step; data analysis transforms workforce information into actionable insights. HR teams use analytical techniques to identify patterns, trends or any relationships within workforce data.


Common workforce analytics applications include:

  • Employee turnover analysis
  • Absenteeism analysis
  • Recruitment funnel analysis
  • Employee performance analytics
  • Diversity and inclusion reporting
  • Workforce productivity measurement

The goal is to uncover insights that support strategic workforce decisions for better organizational growth.


5. Interpret Findings and Generate Insights

Although analysis alone does not create value. Organizations must interpret the results within the context of their business goals.


For example, turnover analysis may reveal that employees leave after a specific tenure period. Further investigation can identify root causes such as limited career development opportunities or ineffective management practices.


This stage aligns your organizations business goals with your workforce strategy to ensure that both work on a mutual roadmap.


6. Share Results Across the Organization

Your workforce insights become valuable only when stakeholders can understand and use them. Organizations increasingly rely on HR dashboards and workforce analytics dashboards to present information through interactive visualizations and KPI tracking.


A well-designed HR dashboard enables leaders to monitor:

  • Employee turnover
  • Workforce productivity
  • Recruitment performance
  • Employee engagement
  • Workforce demographics

7. Develop Action Plans

All insights should lead to measurable actions, organizations can use HR analytics findings to create targeted improvement initiatives.

Examples include:

  • Employee retention programs
  • Recruitment process optimization
  • Leadership development initiatives
  • Employee wellness programs
  • Performance improvement strategies

The purpose of workforce analytics is not simply to measure performance but to improve it.


8. Track Progress and Continuously Improve

HR analytics is an ongoing process rather than a one-time project. Each organization should continuously monitor workforce KPIs and evaluate the impact of implemented actions, regular tracking helps organizations:

  • Measure improvement
  • Identify emerging challenges
  • Adjust workforce strategies
  • Improve decision-making accuracy

With continuous improvement, your workforce analytics remains aligned with changing business objectives.

The Role of HR Dashboards in Workforce Analytics

As workforce data volumes continue to grow, organizations need efficient ways to monitor and interpret workforce performance. HR dashboards serve as a centralized platform for tracking key HR metrics and workforce KPIs.


Modern HR dashboards combine multiple workforce indicators into a single view, allowing HR leaders and executives to quickly identify trends and opportunities.


Key metrics commonly tracked include:

  • Employee turnover rate
  • Employee satisfaction
  • Workforce productivity
  • Recruitment effectiveness
  • Training performance
  • Diversity metrics

By combining data visualization with workforce analytics, HR dashboards help organizations accelerate decision-making and improve workforce outcomes.

Building a Data-Driven HR Culture

A successful HR analytics initiative requires more than technology. The organization must build a culture that values data-driven decision-making.

This involves:

  • Encouraging evidence-based HR strategies
  • Improving data literacy
  • Defining meaningful workforce KPIs
  • Promoting transparency
  • Continuously reviewing workforce performance

When HR teams adopt a data-driven mindset, workforce analytics becomes a strategic advantage rather than a reporting function.

Conclusion

The HR Analytics Process provides a structured approach for transforming workforce data into strategic business insights. By setting clear objectives, collecting relevant data, analyzing workforce trends, and continuously measuring outcomes, organizations can improve employee performance, optimize workforce planning, and drive better business results.


As businesses increasingly prioritize workforce intelligence, HR reporting and workforce planning will continue to play a central role in organizational success. Combining a robust analytics process with modern HR dashboards allows organizations to move beyond reporting and toward proactive workforce management.

Ready to transform your HR Analytics Process?

Share this blog on:

Search Blog

About Us

Global Data 365 is composed of highly skilled professionals who specialize in streamlining the data and automate the reporting process through the utilization of various business intelligence tools.

Follow us on:

Still using Jet Basics?

Get Free Upgrade
to Jet Reports

jet services

Subscribe to Our Newsletter

The HR Analytics Process: Turning Workforce Data into Strategic Business Decisions Read More »

top Business Intelligence Companies UAE 2026 guide

Top Business Intelligence and Analytics Companies in the UAE

top Business Intelligence Companies UAE 2026 guide

Data has become one of the most valuable business assets in today’s competitive market. However, collecting data alone is not enough. Organizations need the right expertise, tools, and strategies to transform raw information into actionable insights that drive growth, improve operational efficiency, and support smarter decision-making.


As digital transformation accelerates across industries, businesses are increasingly searching for the best Business Intelligence Companies UAE has to offer. From startups and mid-sized organizations to large enterprises, companies are partnering with specialized data analytics companies UAE and analytics consulting companies UAE to gain deeper visibility into their operations, improve forecasting accuracy, and make data-driven decisions.


Across the UAE, organizations are investing heavily in business intelligence (BI), reporting automation, data warehousing, forecasting, and artificial intelligence solutions to stay competitive. Whether you’re looking to build executive dashboards, automate reporting processes, implement enterprise analytics, or leverage predictive insights, partnering with the right business intelligence consulting UAE provider can accelerate your digital transformation journey.


In this guide, we explore some of the leading business intelligence companies UAE businesses trust to unlock the full value of their data and drive sustainable growth.

1. Global Data 365

Global Data 365 is a leading business intelligence, analytics, and reporting solutions provider serving organizations across the UAE and beyond. The company specializes in helping businesses transform complex data into meaningful insights through modern reporting, dashboarding, forecasting and data management solutions. 


With extensive expertise in Microsoft technologies, Power BI, Jet Analytics, Microsoft Dynamics 365, Business Central, and enterprise reporting environments, Global Data 365 delivers end-to-end analytics solutions tailored to business requirements. Recognized for delivering some of the best Power BI dashboards and Power BI consulting services in the UAE, the company helps organizations turn raw data into interactive, actionable insights. Their focus on data-driven decision-making enables organizations to improve visibility, optimize operations, and identify growth opportunities through actionable intelligence. 

Key Services

  • Business Intelligence Consulting
  • Power BI Dashboard Development
  • Data Warehousing
  • Forecasting and Predictive Analytics
  • Microsoft Dynamics Reporting
  • Executive KPI Dashboards
  • Analytics and Reporting Training 

Best For:
Organizations seeking a trusted partner for analytics strategy, implementation, reporting automation, and business intelligence transformation.

2. Bay Forward

Bay Forward is a trusted technology consulting and business solutions provider specializing in ERP implementation, business process automation, and Microsoft Power BI consulting services. By combining industry expertise with modern analytics and AI-powered solutions, Bay Forward helps organizations transform complex business data into actionable insights that improve efficiency, decision-making, and long-term growth.

Key Services

  • Data Analytics & Business Intelligence
  • Microsoft Power BI Consulting
  • AI-Powered Business Automation
  • Data Integration & Reporting
  • Interactive Dashboards & Reporting
  • Digital Transformation Consulting

Best For:
Businesses looking to modernize operations, streamline reporting, and leverage Microsoft Power BI to gain real-time, data-driven insights for smarter decision-making.

3. Accenture UAE

Accenture is one of the world’s largest consulting and technology services firms, helping organizations leverage data, analytics, artificial intelligence, and cloud technologies to drive business transformation. Their analytics practice focuses on turning enterprise data into actionable insights that improve decision-making and operational performance.

Key Services

  • Data & Analytics Consulting
  • Artificial Intelligence Solutions
  • Business Intelligence Implementation
  • Cloud Data Platforms
  • Data Engineering
  • Enterprise Reporting
  • Digital Transformation 

Best For:
Large enterprises seeking end-to-end digital transformation, advanced analytics, and AI-driven business insights.
 

4. Deloitte Middle East

Deloitte helps organizations build data-driven cultures through advanced analytics, business intelligence, and digital transformation services. Their consultants assist businesses in improving visibility, governance, and performance through modern reporting and analytics frameworks.

Key Services

  • Business Intelligence Consulting
  • Data Strategy
  • Data Governance
  • Enterprise Reporting
  • Predictive Analytics
  • Performance Management
  • Digital Transformation

Best For:
Organizations looking to align analytics initiatives with broader business and operational strategies.

5. PwC Middle East

PwC provides analytics and consulting services that enable organizations to improve decision-making, streamline operations, and maximize the value of their data assets. Their solutions combine technology, strategy, and industry expertise.

Key Services

Data Analytics Consulting

  • Business Intelligence Solutions
  • Performance Reporting
  • Data Governance
  • AI & Automation Advisory
  • Risk Analytics
  • Digital Strategy

Best For:
Businesses seeking strategic analytics consulting and enterprise-wide reporting transformation.

6. KPMG Lower Gulf

KPMG assists organizations in transforming data into business value through analytics, AI, reporting, and governance solutions. Their services help businesses improve forecasting, planning, and operational efficiency.

Key Services

  • Advanced Analytics
  • Business Intelligence
  • Data Management
  • Artificial Intelligence Solutions
  • Predictive Modeling
  • Data Governance
  • Enterprise Reporting

Best For:
Organizations requiring strong governance, compliance, and analytics capabilities. 

7. TARGIT

TARGIT specializes in business intelligence and analytics solutions that simplify reporting and decision-making. The company is particularly known for delivering industry-specific analytics solutions integrated with ERP systems. 

Key Services

  • Business Intelligence Platforms
  • Executive Dashboards
  • Self-Service Analytics
  • ERP Reporting
  • Data Visualization
  • KPI Monitoring
  • Automated Reporting

Best For:
Manufacturing, retail, wholesale distribution, and ERP-driven organizations seeking industry-focused BI solutions.
 

8. Infosys

Infosys delivers enterprise analytics and digital transformation solutions that help businesses leverage data to optimize performance, improve customer experiences, and identify growth opportunities. 

Key Services

  • Data Analytics
  • AI & Machine Learning
  • Cloud Analytics
  • Data Engineering
  • Enterprise BI Solutions
  • Forecasting & Planning
  • Reporting Automation

Best For:
Large organizations looking to modernize data infrastructure and analytics capabilities.

9. Wipro

Wipro helps organizations unlock the value of data through analytics, AI, cloud technologies, and business intelligence solutions designed to improve decision-making and operational efficiency.

Key Services

  • Business Intelligence
  • Data Modernization
  • Artificial Intelligence
  • Predictive Analytics
  • Cloud Data Solutions
  • Reporting & Dashboards
  • Data Integration

Best For:
Businesses seeking enterprise-scale analytics and cloud transformation initiatives.

10. Tata Consultancy Services (TCS)

TCS offers a wide range of data and analytics services that help organizations build intelligent enterprises. Their solutions focus on data-driven decision-making, operational excellence, and innovation.

Key Services

  • Enterprise Analytics
  • Business Intelligence
  • AI & Machine Learning
  • Data Warehousing
  • Reporting Automation
  • Predictive Analytics
  • Cloud Data Platforms

Best For:
Enterprises requiring large-scale analytics implementations and global consulting expertise.

11. Protiviti Middle East

Protiviti delivers analytics and advisory services focused on improving business performance, governance, risk management, and operational efficiency through data-driven insights.

Key Services

  • Data Analytics Consulting
  • Governance & Compliance Analytics
  • Performance Management
  • Risk Analytics
  • Business Intelligence
  • Reporting Solutions
  • Digital Transformation Advisory

Best For:
Organizations focused on risk management, governance, operational performance, and data-driven strategic planning.

What Are the Best Business Intelligence Companies in the UAE?

Organizations looking for reliable business intelligence solutions UAE need providers that combine technology expertise with strategic consulting. The companies listed below are among the leading data analytics consultants UAE and BI specialists helping businesses improve reporting, forecasting, performance monitoring, and decision-making.

How to Choose the Right Analytics Company?

Selecting the right analytics partner requires more than evaluating technical capabilities. The best business intelligence companies UAE combine industry knowledge, proven methodologies and advanced technologies to deliver measurable business value. Organizations should consider several factors before making a decision:
 

  • Industry Experience 
    Choose a company that understands your industry challenges, reporting requirements and operational processes. 
  • Technology Expertise 
    Look for expertise in leading analytics platforms such as Power BI, Microsoft Fabric, Azure, SQL and cloud-based data solutions. 
  • Scalability 
    Ensure the provider can support future growth, increased data volumes and evolving analytics requirements. 
  • Reporting and Forecasting Capabilities 
    Modern analytics solutions should go beyond historical reporting and provide forecasting, predictive insights and scenario analysis. 
  • Training and Support 
    A reliable analytics partner should offer implementation support, user training and ongoing optimization services. 

Why Business Intelligence Is Becoming Essential in the UAE?

The UAE continues to position itself as a leader in digital innovation and data-driven transformation. As organizations generate increasing amounts of data, the ability to convert information into actionable insights has become a critical competitive advantage.


Businesses that invest in advanced analytics can monitor performance in real time, identify emerging trends, reduce operational inefficiencies, and uncover new growth opportunities. As a result, demand for data analytics services UAE continues to grow across industries.


From finance and manufacturing to retail, healthcare, logistics, and professional services, business intelligence companies UAE are helping organizations transform how they collect, analyze, and use data. Companies working with experienced business intelligence firms Dubai and analytics specialists are often better positioned to respond quickly to market changes and achieve sustainable growth.

Final Thoughts

As organizations generate increasing volumes of data, the ability to transform information into actionable insights has become a key competitive advantage. The right analytics partner can help businesses automate reporting, improve forecasting, enhance operational visibility, and support strategic decision-making.


Whether you’re looking for enterprise-scale consulting from global firms or specialized expertise from leading BI companies UAE, the companies listed above represent some of the most trusted providers in the region.

For organizations seeking personalized analytics solutions, reporting automation, forecasting capabilities, Power BI expertise, and Microsoft-focused business intelligence services, Global Data 365 provides a comprehensive approach to helping businesses become truly data-driven.

Contact Us Now

Share this blog on:

Search Blog

About Us

Global Data 365 is composed of highly skilled professionals who specialize in streamlining the data and automate the reporting process through the utilization of various business intelligence tools.

Follow us on:

Still using Jet Basics?

Get Free Upgrade
to Jet Reports

jet services

Subscribe to Our Newsletter

Top Business Intelligence and Analytics Companies in the UAE Read More »

Azure Services for Enterprise

Complete Azure Cloud Services

Azure Cloud Services for Enterprise: Infrastructure, Data & D365 Integration Explained

Azure Services for Enterprise

Running a modern enterprise means managing a lot of moving parts applications, data pipelines, remote workforces, ERP systems, and cloud infrastructure all at once. Microsoft Azure enterprise services has become the backbone for organisations that want to do all of this at scale, securely, and without rebuilding from scratch every few years.


At Global Data 365, we work with enterprises across the Middle East, the US, and beyond to deploy, manage, and optimise their Azure environments. This guide covers the 10 core Azure Cloud Services we specialise in from foundational infrastructure to advanced data and Dynamics 365 F&O integration.

Whether you’re evaluating Azure for the first time or looking to extend an existing environment, this is the complete picture.

What Are Azure Cloud Services for Enterprise?

Azure Cloud Services for enterprise refers to a suite of managed cloud capabilities compute, networking, containers, DevOps, data, analytics and security delivered through Microsoft’s global cloud platform. Unlike generic hosting, Azure is designed to integrate deeply with Microsoft’s broader ecosystem, including Dynamics 365, Power Platform and Microsoft 365. 

Enterprises choose Azure because it offers: 

  • Global reach across 60+ regions
  • Security and compliance built in from the ground up
  • Seamless integration with Microsoft ERP and productivity tools
  • Scalability from startup to multinational without re-architecture 

Let’s break down each service in detail:

1. Azure Infrastructure

Azure Infrastructure is the foundation everything else sits on. It includes virtual machines (VMs), virtual networks (VNets), DNS, storage accounts, resource groups, and high-availability (HA) architecture all configured for production-grade enterprise workloads.

A properly designed Azure infrastructure isn’t just about spinning up VMs. It’s about designing for resilience, cost efficiency, and compliance from day one. At Global Data 365, our certified architects set up environments that score 90+ across availability, scalability, and compliance benchmarks.


Key capabilities:  
– Virtual Machines & Scale Sets  
– VNet & DNS Configuration  
– High-Availability Architecture  
– Storage Accounts  
– Cost Optimisation via Azure Advisor 


Who needs it: 
Any enterprise moving to the cloud or consolidating on-premise workloads.

2. Azure Kubernetes Services (AKS)

Modern applications are increasingly containerised. Azure Kubernetes Services (AKS) is Microsoft’s fully managed Kubernetes offering, allowing enterprises to run containerised workloads at scale without managing the underlying cluster infrastructure. 

With AKS, teams can ship faster, scale automatically, and reduce infrastructure overhead. We handle cluster provisioning, Helm deployments, ingress configuration, auto-scaling policies, and GitOps-based delivery pipelines. 


Key capabilities:  
– Cluster Management  
– Helm & GitOps  
– Auto-Scaling  
– Service Mesh  
– Persistent Storage  
– Ingress Configuration 


Who needs it:  
Development teams running microservices, APIs or any containerised application in production. 

3. Azure DevOps & CI/CD Pipelines

Speed of delivery is a competitive advantage. Azure DevOps gives enterprises a fully integrated platform for code repositories (Azure Repos), project tracking (Azure Boards), automated testing, and multi-stage CI/CD pipelines all in one place.

Our team helps organisations achieve ELITE DORA performance scores meaning faster deployments, higher build success rates, and dramatically reduced mean time to recovery (MTTR). Infrastructure-as-code through Terraform and Bicep ensures every environment is consistent, auditable, and repeatable.


Key capabilities:
  
– CI/CD Pipelines
– Azure Repos
– Terraform / Bicep (IaC)
– Release Gates
– Azure Boards


Who needs it:
  
Engineering and DevOps teams that need to ship reliably, frequently, and without manual handoffs. 

4. Azure Integration Services

Enterprise environments are complex ERP systems, third-party SaaS tools, legacy on-premise applications, and cloud-native services all need to talk to each other. Azure Integration Services solves this with Logic Apps, API Management, Service Bus, Event Grid, and Data Factory working together as a cohesive middleware layer. 

We help enterprises connect 200+ systems with message throughput of 50,000+ events per day and latency below 0.1%. This eliminates data silos, automates cross-system workflows, and gives operations teams real-time visibility. 


Key capabilities:
  
– Logic Apps
– API Management
– Service Bus
– Event Grid
– Data Factory
– Workflow Automation


Who needs it:
  
Enterprises with multiple systems that need real-time data flow and process automation across platforms. 

5. Azure App Services & Web Apps

Not every application needs a containerised microservices architecture. For many enterprise web applications and APIs, Azure App Service provides a fully managed platform with zero infrastructure overhead auto-scaling, SSL, deployment slots, and Application Insights included. 

Teams get production-ready performance with 99%+ uptime, 97/100 overall health scores, and seamless deployments using staging slots before pushing to production. 


Key capabilities:
  
– Web Apps & APIs
– Deployment Slots
– Application Insights
– Custom Domains
– Auto-Scaling
– SSL / TLS


Who needs it:
  
Teams deploying customer-facing applications, internal portals, or REST APIs on Azure without wanting to manage servers. 

6. Azure Virtual Desktop (AVD)

Remote and hybrid work is now permanent for most enterprises. Azure Virtual Desktop enables a secure, scalable virtual desktop infrastructure (VDI) accessible from any device, anywhere in the world. 

We deploy AVD with FSLogix profile management for fast, persistent user sessions, Intune policy enforcement for device compliance, and session pooling to optimise licensing costs. With 10,000+ remote users supported and 99.7% session uptime, it’s enterprise VDI done right.


Key capabilities:
  
– AVD Deployment
– FSLogix Profile Management
– Microsoft Intune Policies
– Remote Access
– Session Pooling
– Multi-Device Support


Who needs it:
  
Enterprises with distributed, remote, or BYOD workforces needing secure access to corporate applications and data. 

7. Azure Security & Identity

Security is not an add-on it’s a foundation. Azure Security & Identity covers the full Zero Trust framework: Microsoft Entra ID (formerly Azure AD), Conditional Access, Privileged Identity Management (PIM), Role-Based Access Control (RBAC), and Microsoft Defender for Cloud. 


We implement continuous threat monitoring, compliance posture management, and identity governance tailored to your organisation’s risk profile through our Microsoft Defender consulting services, helping businesses proactively detect threats, secure endpoints and strengthen their Zero Trust security strategy. The result: 95%+ identity protection, 88%+ threat detection rates, and enterprise-grade Zero Trust coverage. 


Key capabilities:
  
– Zero Trust Architecture
– Microsoft Entra ID
– Defender for Cloud
– RBAC & PIM
– Conditional Access
– Compliance Alignment


Who needs it:
  
Every enterprise security is non-negotiable in cloud environments handling sensitive business data. 

8. Azure SQL & Managed Databases

Data is the lifeblood of enterprise operations. Azure SQL & Managed Databases provides fully managed relational database services Azure SQL Database, Azure SQL Managed Instance, and Azure Database for PostgreSQL / MySQL with built-in high availability, automated backups, and intelligent performance tuning. 

For Dynamics 365 users, Azure SQL Managed Instance provides the closest compatibility to SQL Server on-premise, making it the preferred migration target for legacy ERP databases. 


Key capabilities:
  
– Azure SQL Database
– Azure SQL Managed Instance
– Intelligent Query Performance Tuning
– Automated Backups & Point-in-Time Restore
– Geo-Replication & High Availability
– Built-in Threat Detection


Who needs it:
  
Enterprises running transactional workloads, ERP backends, or any application requiring structured, relational data at scale. 

9. Azure Data Factory & Azure Synapse Analytics

For enterprises that need to move, transform, and analyse large volumes of data, Azure Data Factory (ADF) and Azure Synapse Analytics are the core services. 

Azure Data Factory is a cloud-based ETL and data integration service. It allows you to build data pipelines that connect to 90+ sources  on-premise databases, cloud APIs, file systems, SaaS platforms  and move data reliably into your data warehouse or data lake.
 

Azure Synapse Analytics takes it further. It’s a unified analytics platform that brings together big data processing (Apache Spark), enterprise data warehousing, and data integration in a single workspace. Synapse enables SQL-based analytics on petabyte-scale data alongside machine learning and real-time streaming. 

Together, ADF and Synapse power end-to-end data platforms from raw data ingestion to business-ready reporting in Power BI. 


Key capabilities (Data Factory):
 
– 90+ data source connectors
– Code-free and code-first pipeline authoring
– Scheduled and trigger-based execution
– Data flow transformations
– Integration with Azure Data Lake & Blob Storage


Key capabilities (Synapse Analytics):
  
– Server-less and dedicated SQL pools
– Apache Spark for big data processing
– Synapse Studio unified development environment 
– Native Power BI and Azure ML integration
– Real-time analytics with Synapse Link


Who needs it:
  
Enterprises building enterprise data warehouses, data lakes, or unified analytics platforms that feed BI reporting in Power BI. 

10. Azure Synapse Link for Dynamics 365 F&O

This is one of the most powerful and under-utilised capabilities available to Dynamics 365 Finance & Operations users. 


Azure Synapse Link for D365 F&O (formerly known as Export to Data Lake) creates a near-real-time, continuous export of your Dynamics 365 F&O data directly into Azure Data Lake Storage Gen2. From there, it can be analysed in Synapse Analytics, transformed with Azure Data Factory, and visualised in Power BI without touching the live D365 environment or impacting production performance. 


This eliminates the need for complex, fragile custom integrations just to report on your ERP data. Business users get fresh, accurate data in their dashboards. IT teams get a governed, scalable data pipeline. Finance and operations leaders get the analytics they’ve always needed. 


Key capabilities:
  
– Near-real-time D365 F&O data export
– No performance impact on production D365
– Automatic table change tracking
– Integration with Azure Synapse Analytics
Power BI reporting on live ERP data
– Support for Finance, Supply Chain, HR, and more


Who needs it:
  
Any organization running Dynamics 365 Finance & Operations that wants real-time visibility into ERP data without custom integrations or reporting bottlenecks. 

How These Services Work Together

  1. Azure Infrastructure:  
    The foundation: VMs, VNets, storage and HA configuration. 
  2. Azure Security & Identity:  
    Zero Trust, Entra ID, and RBAC applied across everything. 
  3. Azure DevOps & CI/CD:   
    All deployments automated through pipelines. No manual changes in production. 
  4. Azure App Services / AKS:   
    Applications deployed on managed platforms with auto-scaling. 
  5. Azure Integration Services 
    Connecting D365, third-party SaaS, and internal systems. 
  6. Azure SQL & Managed Databases:   
    Transactional data layer for ERP and applications. 
  7. Azure Data Factory:   
    Pipelines pulling data from D365, SQL, and other sources into the data lake. 
  8. Azure Synapse Analytics:   
    Analytics on top of the data lake, feeding Power BI dashboards. 
  9. Azure Synapse Link for D365 F&O:   
    Real-time ERP data flowing into the analytics platform. 
  10. Azure Virtual Desktop:  
    Remote teams accessing everything securely from any device. 

The result is a governed, scalable, analytics-ready enterprise cloud environment not a collection of disconnected tools.

Why Global Data 365 for Azure Cloud Services?

Global Data 365 is a certified Microsoft partner with deep specialisation in both Azure cloud infrastructure and Dynamics 365 ecosystems. That dual expertise matters because most Azure partners don’t understand ERP, and most ERP partners don’t do cloud infrastructure. 

We do both: 

  • Microsoft-certified Azure architects lead every engagement 
  • Global delivery across 15+ countries 
  • Fast time-to-value  production-ready environments weeks ahead of standard timelines 
  • Security-first  hardening, compliance alignment, and monitoring built into every project 
  • Transparent cost management via Azure Cost Management and Advisor 
  • 24/7 managed support from deployment through day-2 operations 

Frequently Asked Questions

What are Azure Cloud Services for enterprise?  
Azure Cloud Services for enterprise refers to Microsoft’s suite of managed cloud solutions including compute, networking, containers, DevOps, databases, analytics, and security configured and managed for production enterprise workloads. 

What is Azure Synapse Link for D365 F&O?  
Azure Synapse Link for Dynamics 365 Finance & Operations is a near-real-time data export capability that continuously replicates D365 F&O data into Azure Data Lake Storage, enabling analytics in Synapse and reporting in Power BI without impacting ERP performance. 

How does Azure Data Factory differ from Azure Synapse Analytics?  
Azure Data Factory is an ETL/data integration service for building pipelines that move and transform data across sources. Azure Synapse Analytics is a unified analytics platform for big data processing and data warehousing. They are complementary ADF typically feeds data into Synapse. 

Is Azure SQL good for Dynamics 365 workloads?  
Yes. Azure SQL Managed Instance is the preferred migration target for enterprises moving D365 or other SQL Server workloads to Azure, offering near-complete SQL Server compatibility with managed infrastructure. 

How long does it take to set up Azure Cloud Services for an enterprise?  
With an experienced partner like Global Data 365, production-ready Azure environments can be deployed weeks ahead of industry standard timelines using proven delivery frameworks and infrastructure-as-code (Terraform/Bicep). 

Ready to Build Your Enterprise Azure Environment?

Share this blog on:

Search Blog

About Us

Global Data 365 is composed of highly skilled professionals who specialize in streamlining the data and automate the reporting process through the utilization of various business intelligence tools.

Follow us on:

Struggling with complex reports?

Power BI makes it simple!

Industry dashboards

Subscribe to Our Newsletter

[wpforms id="26968"]

Complete Azure Cloud Services Read More »

FP&A Reporting in D365 F&O From Spreadsheets to Live Insight

FP&A Reporting in D365 F&O: From Spreadsheets to Live Insights

Dynamics 365 Finance & Operations

FP&A Reporting in D365 F&O From Spreadsheets to Live Insight

If your finance team still starts every month by pulling data out of Dynamics 365 Finance & Operations into Excel, stitching together reports, and chasing department heads for numbers, you’re not alone. And you’re not wrong for doing it that way. That’s just how FP&A has always worked in most organizations. But it doesn’t have to stay that way. Modern FP&A reporting in D365 F&O isn’t about replacing your finance team’s instincts, it’s about giving them live, structured, trustworthy data so they can spend less time building reports and more time analyzing what the numbers actually mean.


This blog breaks down what FP&A reporting really involves inside D365 F&O, why it matters more than ever, what dashboards and KPIs your team should be tracking module by module, and how companies are moving from spreadsheet chaos to real time insight

What Is FP&A Reporting and Why Does It Matter?

Financial Planning & Analysis (FP&A) is the function inside every finance team responsible for budgeting, forecasting, variance analysis, and strategic financial reporting. It answers the questions leadership actually cares about:

  • Are we on track to hit our targets this quarter
  • Where are we overspending and why?
  • What does next year look like if revenue drops 10%?
  • Which business unit is dragging down overall profitability?

These are not questions you can answer from a static report that’s already two weeks old. FP&A requires data that is current, connected across departments, and structured in a way that lets finance teams slice it, drill into it, and build scenarios on top of it.

The Problem with Traditional FP&A in D365 F&O

Dynamics 365 Finance & Operations holds an enormous amount of financial and operational data. But most finance teams access it the same way they did a decade ago through exports, manual queries, and spreadsheet models that need to be rebuilt every month.

The result is a reporting cycle that looks something like this:

  • Month end close happens
  • Someone exports GL, AP, AR, and budget data from F&O
  • The data gets cleaned, merged, and formatted in Excel
  • Reports get distributed sometimes days after the close
  • Leadership makes decisions based on numbers that are already stale

The average finance team spends 60 70% of their time collecting and formatting data. Less than 30% goes to actual analysis. FP&A reporting tools flip that ratio.

Why FP&A Reporting Is Now Business Critical?

In high growth or high complexity organizations, especially those running multi entity or multi-currency operations in D365 F&O slow reporting isn’t just inefficient. It’s a strategic risk.

  • Budget overruns get caught too late to course correct

  • Revenue forecasts are based on incomplete pipeline data

  • Cash flow projections miss payable and receivable timing

  • Leadership loses confidence in the numbers and in finance

Real time FP&A reporting doesn’t just save time. It changes how finance teams are perceived from report generators to strategic advisors.

FP&A Reporting Across D365 F&O Modules

Module by Module: FP&A Dashboard Overview
📊 Finance Dashboard
  • P&L vs Budget (Actual vs Plan by Period)
  • Revenue & Expense Variance Analysis
  • Cost Center Performance
  • GL Account Drilldowns
  • Trial Balance & Financial Statements
💰 Sales Dashboard
  • Revenue by Region, Customer, Product
  • Sales Target vs Actual
  • Order Backlog & Fulfilment Rate
  • Top Customer Profitability
  • Sales Trend & Forecast
📦 Inventory Dashboard
  • Inventory Valuation & Carrying Cost
  • Stock Turnover Ratio
  • Dead Stock & Slow Moving Items
  • Inventory Aging
  • Warehouse Utilisation
🛒 Procurement Dashboard
  • Purchase Spend by Vendor & Category
  • PO vs Invoice Variance
  • Budget Consumption by Department
  • Vendor Performance & Lead Times
  • Pending Approvals & Open POs
🏭 Production Dashboard
  • Production Cost vs Standard Cost
  • Efficiency & Utilisation Rates
  • Scrap & Waste Tracking
  • Production Output vs Plan
  • Work in Progress (WIP) Valuation
🧾 Accounts Payable Dashboard
  • Outstanding Payables by Vendor & Age
  • DPO (Days Payable Outstanding)
  • Invoice Processing Time
  • Cash Flow Forecast Payments
  • Early Payment Discount Opportunities
💳 Accounts Receivable Dashboard
  • Outstanding Receivables by Customer & Age
  • DSO (Days Sales Outstanding)
  • Overdue Invoice Tracking
  • Cash Flow Forecast Collections
  • Bad Debt Exposure & Risk
🗂 Project Dashboard
  • Project Revenue vs Budget
  • Cost to Complete Estimates
  • Margin by Project & Project Type
  • Resource Utilisation & Billing Rates
  • Milestone & Delivery Tracking
👥 HR Dashboard
  • Headcount vs Budgeted FTEs
  • Payroll Cost by Department
  • Attrition & Hiring Cost Trends
  • Overtime & Leave Tracking
  • HR Cost as % of Revenue

Every one of these dashboards connects back to your D365 F&O data automatically, in real time, without manual exports

The FP&A Reporting Stack: What Tools Work Best with D365 F&O?

There is no single tool that works for every finance team. The right approach depends on your team size, data complexity, and how deep you need to go. Here’s how the three main options compare for FP&A in D365 F&O:

Atlas - Live Excel for FP&A Teams

If your FP&A team lives in Excel building models, running scenarios, doing variance analysis Atlas is built exactly for you. It’s an Excel add in that connects directly to D365 F&O’s data entities, pulling live data into your spreadsheets without any manual export.

  • Build live financial statements, P&L, and balance sheets in Excel
  • Run budget vs actual analysis with data that updates automaticall
  • No copy paste, no stale numbers, no version conflicts
  • Respects D365 F&O role based security each user only sees what they should

Atlas is the answer to: ‘Can we keep using Excel but stop wasting time on exports?’ Yes and the data will always be current.

Power BI - Visual Dashboards for Finance & Leadership

When FP&A outputs need to be shared with leadership, department heads, or the board, Power BI turns your F&O data into clean, interactive dashboards that anyone can use.

  • Connect D365 F&O via Data Entities or OData feeds
  • Build custom P&L, cash flow, and variance dashboards
  • Drilldowns from company level → business unit → cost centre → GL account
  • Schedule automatic data refresh no manual intervention needed
  • Share reports securely with leadership via the Power BI service

Jet Analytics - Enterprise FP&A Data Warehouse

For large organizations, with multi entity structures, multiple ERPs, or high data volumes, Jet Analytics provides the most robust FP&A foundation. Data from D365 F&O flows via Azure Synapse Link into a centralized data warehouse, where it’s structured, cleaned, and optimized for reporting.

  • Consolidate financials across multiple entities, currencies, and legal entities
  • Integrate budget data, actuals and forecasts in one model
  • Power BI and Excel both connect to the same centralized data source
  • Historical data preserved for trend analysis and multi year planning
  • Enterprise grade governance, trusted data that the whole organization relies on

Jet Analytics is the right choice when you need one version of truth across a complex, multi entity organization not just for FP&A, but for every function that touches financial data.

From Spreadsheets to Live Insights: What the Shift Actually Looks Like

The move from traditional Excel based FP&A to live D365 F&O reporting isn’t just a technology change. It changes how the finance function operates day to day.

Before: The Old Way

  • Month end report takes 5 7 days to produce after close
  • Finance team spends Monday Wednesday every week updating spreadsheets
  • Different departments have different versions of the same numbers
  • Budget vs actual analysis is done manually, one entity at a time
  • Leadership asks for a number and finance has to ‘go and check’

After: With Live F&O Reporting

  • Dashboards update automatically finance reviews insights, not raw data
  • Variance reports are available the moment the period closes
  • One centralised model no more version conflicts between teams
  • CFO can drill into any number in a board deck before the meeting starts
  • FP&A team focuses on scenario modelling and strategic input, not report building

The goal isn’t to automate FP&A. It’s to give FP&A teams back the time they need to do what they’re actually good at thinking about the numbers, not moving them around.

Key FP&A KPIs Your D365 F&O Dashboards Should Always Show

Regardless of industry or company size, every FP&A team working on D365 F&O should have visibility into these core metrics at all times:

Financial Performance

  • Revenue vs Budget – by period, YTD, and full year forecast

  • Gross Margin % – by product, business unit, and region

  • EBITDA – actual vs plan with variance explanation

  • Expense Ratio by Department

Cash & Liquidity

  • Cash Flow Forecast – 13 week rolling

  • DSO, DPO, and Cash Conversion Cycle

  • Working Capital Movement

Budget & Forecast

  • Budget Consumption Rate- how much of the annual budget has been used

  • Forecast Accuracy – how close previous forecasts were to actuals

  • Scenario Comparison – base case vs upside vs downside

Operational Finance

  • Cost Centre P&L – profitability by department or function
  • Headcount Cost vs Budget
  • Capex vs Opex Spend – actual vs approved

The move from traditional Excel based FP&A to live D365 F&O reporting isn’t just a technology change. It changes how the finance function operates day to day.

Ready to Modernize FP&A Reporting in Your D365 F&O Environment?

Share this blog on:

Search Blog

About Us

Global Data 365 is composed of highly skilled professionals who specialize in streamlining the data and automate the reporting process through the utilization of various business intelligence tools.

Follow us on:

Struggling with complex reports?

Power BI makes it simple!

Industry dashboards

Subscribe to Our Newsletter

[wpforms id="26968"]

FP&A Reporting in D365 F&O: From Spreadsheets to Live Insights Read More »

Accounts Receivable vs Accounts Payable

Accounts Receivable vs Accounts Payable

Accounts Receivable vs. Accounts Payable: What's the difference?

Accounts Receivable vs Accounts Payable

Every business transaction tells a story.


Some bring money into your company, while others represent obligations you need to pay. Understanding the difference between accounts receivable (AR) and accounts payable (AP) is crucial for maintaining healthy cash flow, managing working capital, and making smarter financial decisions.


For businesses of all sizes, mastering the balance between accounts receivable vs payable is crucial, it isn’t just about bookkeeping, it’s about gaining a clear picture of financial health, optimizing liquidity and empowering decision-makers with actionable insights. This is where advanced AR and AP dashboards come in, transforming data into decisions.

What Are Accounts Receivable(AR)?

Accounts receivable refers to the money your customers owe you for goods or services delivered on credit. These amounts are considered current assets on your balance sheet because they represent future cash inflows. When your customers pay on time, your cash flow remains steady, working capital stays healthy, and your business is positioned for growth.

Why Accounts Receivable Matters?

Proper accounts receivable management helps businesses:

  • Improve cash inflow
  • Reduce late payments
  • Minimize bad debt
  • Maintain healthy working capital
  • Monitor customer credit risk

The efficiency of your accounts receivable process directly impacts liquidity. Slow collections can restrict growth, even if your company is profitable on paper.

However, delayed payments can create challenges. Slow collections not only restrict operational cash but can also increase the risk of bad debt, forcing businesses to borrow or dip into reserves. Effective accounts receivable management involves monitoring outstanding invoices, tracking payment behavior, and proactively following up on overdue balances.

Modern businesses leverage Accounts Receivable Dashboards to visualize their receivables in real-time, analyze overdue invoices, and identify collection opportunities. With the right dashboard, your finance team can quickly pinpoint high-risk accounts, forecast cash inflows, and prioritize collections, all without manual spreadsheet headaches.

You can explore this solution here: Accounts Receivable Dashboard.

What is Accounts Payable(AP) and Its Impact on Cash Flow?

On the other side of the coin, accounts payable represents the money your business owes to suppliers, vendors, or service providers. These obligations are current liabilities, reflecting cash outflows that need to be paid within agreed-upon terms.

Proper accounts payable management ensures that you pay vendors on time, avoid late fees, and maintain strong supplier relationships. Strategic AP practices also allow businesses to optimize cash flow by balancing payment timing without compromising operational efficiency.

Why Accounts Payable Matters?

Strong accounts payable management helps businesses:

  • Maintain positive vendor relationships
  • Avoid late payment penalties
  • Optimize cash outflow timing
  • Improve working capital management
  • Strengthen financial planning

A well-structured accounts payable process ensures that bills are paid accurately, on time, and without disrupting operations.


With an Accounts Payable Dashboard, finance teams gain complete visibility into outstanding obligations, upcoming payments, and vendor performance. Real-time insights allow businesses to plan cash outflows effectively, take advantage of early payment discounts, and maintain a healthy cash reserve.


Check out the sample report here: Accounts Payable Dashboard.

Accounts Receivable vs Accounts Payable: Core Differences

Understanding AR vs AP becomes easier when viewed side-by-side:

FeatureAccounts Receivable (AR)Accounts Payable (AP)
MeaningMoney customers owe your businessMoney your business owes vendors
Financial CategoryCurrent AssetCurrent Liability
Cash ImpactCash InflowCash Outflow
FocusInvoice collection & credit controlBill payments & vendor management
RiskBad debts, overdue receivablesLate fees, damaged supplier relations

In simple terms:
Accounts receivable brings money in
Accounts payable sends money out

Both are equally important for maintaining financial balance.

AR vs AP: Balancing the Cash Flow Equation

The interaction between accounts receivable and accounts payable is the heartbeat of a company’s financial operations. Receivables bring money in; payables manage money going out. When AR is collected efficiently and AP is managed strategically, businesses can maintain liquidity, reduce reliance on debt, and optimize working capital.


Ignoring either side can create financial strain. For example, if receivables are delayed while payables are due, businesses may struggle to meet obligations, damaging supplier trust and incurring penalties. Conversely, focusing solely on AP without actively managing AR limits the funds available to reinvest, grow operations, or seize new opportunities.


This balance is precisely why businesses today turn to interactive dashboards that combine AR and AP insights. By visualizing cash flow from both angles, you gain a complete picture of financial health enabling smarter decisions and faster responses to changing business conditions.

How AR and AP Impact Cash Flow & Working Capital?

One of the most critical aspects of financial management is balancing receivables and payables.


1. Accounts Receivable & Cash Flow

If customers delay payments:

  • Cash inflow slows down
  • Liquidity decreases
  • Business operations may suffer

Monitoring your AR aging report helps identify overdue invoices and take corrective action quickly.


2. Accounts Payable & Cash Flow

If supplier payments are mismanaged:

  • Cash reserves may deplete quickly
  • Vendor relationships may weaken
  • Early payment discounts may be missed

Using an AP aging report ensures you know exactly when obligations are due.


The Ideal Scenario

A financially strong business:

  • Collects receivables faster
  • Strategically manages payables
  • Maintains positive working capital

This balance directly improves financial stability and scalability.

Accounts Receivable Process vs Accounts Payable Process

Accounts Receivable Process
The AR process typically includes:
  1. Customer order confirmation
  2. Invoice generation
  3. Invoice delivery
  4. Payment tracking
  5. Follow-ups for overdue receivables
  6. Cash application & reconciliation
accounts receivable process vs accounts payable

Automation in accounts receivable reduces manual errors and accelerates collections.

Accounts Payable Process

The AP process usually involves:
  1. Vendor invoice receipt
  2. Invoice verification
  3. Approval workflow
  4. Payment scheduling
  5. Payment processing
  6. Recording & reconciliation
Efficient accounts payable systems prevent duplicate payments and improve compliance.
accounts payable process vs accounts receivable

Common Challenges in Managing Receivables and Payables

Without proper financial reporting systems, companies often face:

  • Lack of visibility into outstanding receivables
  • Manual invoice tracking
  • Delayed payment follow-ups
  • Poor AP approval workflows
  • Inaccurate aging reports
  • Cash flow forecasting issues

This is where financial dashboards become critical.

Why Businesses Need an AR and AP Dashboard

Traditional spreadsheets and manual tracking are slow, error-prone, and offer little insight into real-time performance. In contrast, dashboards provide:

  • A single view of receivables and payables
  • AR aging reports and AP aging reports to monitor overdue items
  • Cash flow forecasting to anticipate liquidity needs
  • Actionable insights to prioritize collections or payments
  • A clear view of working capital efficiency

For businesses aiming to maintain financial stability while driving growth, investing in a dashboard is no longer optional, it’s a strategic advantage. Our Accounts Receivable and Accounts Payable Dashboards offer precisely this level of insight, transforming raw financial data into clear, actionable intelligence.

Conclusion: Turn Insights into Action

Understanding accounts receivable vs accounts payable is more than an accounting exercise. It’s about controlling cash flow, safeguarding working capital and making informed decisions that drive growth.


With the right processes and real-time dashboards, businesses can move from reactive reporting to proactive financial management. You not only monitor outstanding balances but also uncover patterns, mitigate risks, and strategically plan your cash flow.

Take Control of Your Cash Flow Today

Share this blog on:

Search Blog

About Us

Global Data 365 is composed of highly skilled professionals who specialize in streamlining the data and automate the reporting process through the utilization of various business intelligence tools.

Follow us on:

Struggling with complex reports?

Power BI makes it simple!

Industry dashboards

Subscribe to Our Newsletter

[wpforms id="26968"]

Accounts Receivable vs Accounts Payable Read More »

Power BI Writeback

Power BI Writeback: What is it and Why it matters?

Power BI Writeback: What It Is, Why It Matters and How It Works

power bi for industry

Power BI has always been great for analysis, but traditional dashboards hit a wall when users need to act on insights. That’s where writeback comes in. It turns Power BI from a passive reporting tool into an interactive decision-making platform. Below is a simple breakdown of what writeback does, when to use it, how you can setup writeback in power bi and how it works in real-world scenarios.

What Is Power BI Writeback?

Power BI Writeback lets users send data from Power BI back to a database or application. Instead of only reading data, it lets you update, insert or modify records directly from a report.


In short:
See the data → Edit it → Save it back to the source
All inside Power BI.

Why Power BI Writeback Matters?

Here are some of the key reasons writeback capability is valuable for organizations:

  1. Improved Data Accuracy
    Users can correct mistakes or adjust data in real time, ensuring analyses reflect the most accurate, up-to-date information.

  2. Streamlined Planning & Forecasting
    Teams can enter budget numbers, forecast adjustments, or “what-if” scenario values directly in Power BI. This makes planning more dynamic and collaborative.

  3. Enhanced Collaboration
    With writeback, multiple people (e.g., finance, sales, ops) can contribute data (comments, inputs, etc.) inside the same Power BI report, improving alignment.

  4. Efficiency Gains
    No need to switch between Power BI and other applications (Excel, PowerApps or custom forms) for data entry everything happens in one place.

  5. Auditability & Governance
    Good writeback solutions keep logs of who changed what and when, which is crucial for data governance.

How Writeback Works?

Power BI doesn’t natively store writeback data, so the process usually looks like this:

Step 1: User edits data

Through:

  • A Power Apps form embedded in Power BI

  • A custom visual (like Acterys, PowerOn, Inforiver, Zebra BI Writeback)

  • A custom-built writeback API

Step 2: Writeback logic kicks in

Data is sent to:

  • SQL Server / Azure SQL

  • Dataverse

  • SharePoint

  • API endpoints

  • Cloud storage

Step 3: Power BI refreshes

Depending on strategy:

  • DirectQuery shows updates instantly

  • Automatic refresh triggers when updates happen

  • On-demand refresh via Power Automate

Step 4: Updated reports reflect new values

Writeback Architecture Options

There are multiple ways to implement writeback in Power BI, depending on architecture and governance needs. Some common approaches are:

1. Writeback Visuals

  • Use custom visuals (like editable tables or forms) inside Power BI that allow users to input data (text, dates, dropdowns, numbers). 

  • These visuals then write the data back to a database (e.g., Azure SQL, Fabric SQL) via APIs or connector logic.

  • After writeback, Power BI visuals re-query the data (via DirectQuery, Import, or “Direct Lake”) to reflect the new values.

2. Power Apps Embedded in Power BI

  • Embed a Power Apps form inside the Power BI report.
  • Users fill out the form; then Power Apps writes data to Dataverse or SQL.
  • Power BI visuals are refreshed (or re-query) to show updates.

3. Custom API / Service Layer

  • Build a backend service (REST API) that handles writeback requests.

  • This service can apply validation, permission checks, business logic, then write to a governed database.

  • Power BI calls this service from visuals (e.g., via button click), and afterward, reads the updated data.

4. Native Writeback with Microsoft Fabric

  • With Microsoft Fabric, Power BI can leverage User Data Functions (UDFs) to write back to a Fabric SQL database.

  • This is more “native” (no need for external Power Apps or third-party visuals), and leverages modern Fabric architecture.

5. Writeback Comments / Notes

  • Some visuals allow writing comments or annotations directly on a Power BI report.

  • You can capture these comments via Power Automate Flows. For example, a “Writeback Comments” trigger captures changes (delta), and then writes them into a database (e.g., Azure SQL, Snowflake).

Common Use Cases

Here are some real-world scenarios where Power BI Writeback brings value:

  • Budgeting & Financial Planning:
    Finance teams enter budget numbers, make adjustments, and run “what-if” simulations directly in Power BI.

  • Sales Forecasting:
    Sales reps or managers can update their sales forecasts, and these updates are written back to a central database for aggregated reporting.

  • Data Correction / Master Data Management:
    Users spot data errors (in Power BI) and correct them on the spot, ensuring that data stays clean and consistent.

  • Collaborative Commentary:
    Multiple users write comments or feedback on data points, e.g., on reports or dashboards, which is stored centrally for audit and future reference.

  • Operational Input:
    Teams working in operations (like inventory planning, staffing) input numbers (like headcount, targets) in a Power BI report, to drive planning cycles.

Benefits of Writeback

Let’s list the main advantages in depth:

  • Enhanced Interactivity:
    The Power BI experience is no longer just “view-only”; users can act, input and contribute.

  • Reduced Tool Switching:
    Eliminates back-and-forth between Power BI and Excel or other planning tools.

  • Real-Time Updates:
    When implemented properly, writeback can be near-instant, so data is always current.

  • Better Collaboration:
    Multiple people (from different roles) can contribute within the same BI environment.

  • Governance:
    With audit logs, you get accountability (“who changed what”), which is very important for financial / sensitive data.

  • Scalability:
    With architectures like Fabric + UDFs, writeback can scale to large organizations with many users.

Challenges & Risks

Writeback isn’t trivial. Here are common challenges organizations face:

  1. Data Integrity & Security

    • Allowing users to write data means there must be strict permissions: who can write, what they can write and where.

    • You need validation rules to prevent bad or inconsistent data entry.

  2. Performance Concerns

    • Writing data and then re-querying your data model could impact report performance, especially with large datasets.

    • Frequent writes can increase load on your database or lakehouse, so you need to design your backend to handle that.

  3. User Training

    • Not all users are comfortable entering data in a BI tool; training is needed so they understand the effects of their changes.

    • Mistakes in writeback (like overwriting the wrong row) can cause serious data issues, so guardrails are essential.

  4. Auditing & Compliance

    • You need to maintain comprehensive audit logs. Without these, tracking changes or rolling back incorrect edits is difficult.

    • For regulated industries, writeback may raise compliance concerns (e.g., financial, healthcare).

  5. Complex Architecture

    • Implementing writeback may require extra infrastructure: SQL databases, APIs or services, possibly Power Automate flows.

    • The newer “native” writeback via Fabric UDFs is promising, but organizations need to adopt Fabric and set up their environment accordingly.

  6. Cost

    • Third-party solutions (writeback visuals, Inforiver, etc.) may come with licensing costs.

    • There may be overhead in maintaining APIs, databases, and governance processes.

Best Practices for Implementing Power BI Writeback

Here are some recommended practices based on real-world implementation patterns:

  1. Define Clear User Permissions

    • Set up roles: who can write, what fields they can change, and whether they can insert new records or only update.

    • Use row-level security (RLS) or other security models to granularly control data entry.

  2. Implement Data Validation

    • Use validation logic in your writeback layer (forms, API) so erroneous or invalid input is rejected.

    • Use dropdowns, date pickers, and controlled UI inputs to minimize “free text” mistakes.

  3. Audit Logging & Change Tracking

    • Maintain detailed audit logs: who changed what, when, old vs new value.

    • Regularly review these logs (or alert) for unusual or unauthorized activity.

  4. Use Efficient Data Architecture

    • If using Fabric, leverage User Data Functions (UDFs) for native writeback.

    • Optimize your backend to handle write volume e.g., batch writes, or use a write-optimized store.

  5. Train Users Properly

    • Provide training so users understand not just how to write data but why they’re doing it, and what the downstream impact is.

    • Maintain a sandbox or test environment for users to practice before writing to production data.

  6. Govern with Policies

    • Have a data governance policy specifically for writeback. Who approves it? When can users change data? What workflows exist for correction or rollback?

    • Review and update these policies periodically based on usage patterns and risk.

  7. Monitor Performance

    • Keep an eye on the performance of your writeback architecture. Monitor latency, database load, report refresh times.

    • Use optimizations (indexing, batching, efficient schema) to ensure scalability.

  8. Document Use Cases & Feedback

    • Document which writeback use cases you support (budgeting, forecasting, notes, etc.).

    • Collect feedback from users so you can refine interfaces, validation, and workflows.

Emerging Trends: Native Writeback with Microsoft Fabric

One of the most exciting developments is native writeback in Microsoft Fabric. Instead of relying on external visuals or Power Apps, you can now use User Data Functions (UDFs) in Fabric to write data from Power BI directly into a Fabric SQL database.

  • UDFs act like endpoints: you define a function that receives user input (via Power BI), do validation or business logic, and then commit to a Fabric SQL table.

  • This setup reduces architectural complexity and improves performance, because everything stays within Fabric (Power BI, SQL, compute).

  • It’s a “first-party” way to write back, aligning with Microsoft’s long-term direction for analytics and data management.

Final Thoughts

Power BI writeback is a powerful capability that shifts Power BI from being just a reporting tool to a more interactive data management platform. It enables real-time collaboration, planning, forecasting and data correction all within the same BI ecosystem. Learn writeback and many other tips and tricks in Power BI with our training programs.


However, implementing writeback requires careful planning: security, governance, architecture, and performance are all critical. When done right, especially with modern platforms like Microsoft Fabric, writeback can deliver major business value by making insights actionable and enabling teams to work more collaboratively and efficiently.

Empower Your Team With Live Data Input. Let’s Talk

Share this blog on:

Search Blog

About Us

Global Data 365 is composed of highly skilled professionals who specialize in streamlining the data and automate the reporting process through the utilization of various business intelligence tools.

Follow us on:

Struggling with complex reports?

Power BI makes it simple!

Industry dashboards

Subscribe to Our Newsletter

[wpforms id="26968"]

Power BI Writeback: What It Is, Why It Matters and How It Works Read More »

Financial Reporting and Accounting

Financial Reporting and Accounting: Turning Data into Business Insight

Financial Reporting and Accounting

In today’s data-driven economy, financial reporting and accounting are more than just compliance functions, they are the core of business intelligence. From small startups to multinational corporations, every organization relies on accurate financial data to make informed decisions, assess performance and plan for the future.


Yet, while accounting records the financial heartbeat of an organization, financial reporting gives that data meaning, transforming figures into insights that drive growth.

Understanding the Foundation: What Is Accounting?

Accounting is often referred to as the language of business and rightly so. It is the systematic process of recording, classifying and summarizing financial transactions to provide an accurate picture of a company’s financial position.

At its core, accounting involves:

  • Recording transactions such as sales, purchases, and expenses

  • Maintaining ledgers and journals

  • Managing accounts receivable (AR) and accounts payable (AP)

  • Ensuring compliance with financial standards (GAAP or IFRS)

Accurate accounting ensures that financial data is reliable, consistent, and ready to be analyzed, serving as the foundation upon which financial reports are built.

What Is Financial Reporting?

If accounting is about recording data, financial reporting is about communicating it.
It’s the process of organizing accounting data into structured statements and reports that reflect a company’s performance and financial health.

The most common reports include:

  • Balance Sheet: Shows assets, liabilities, and equity — a snapshot of what the company owns and owes.

  • Income Statement (Profit & Loss): Highlights revenue, expenses, and profit over a specific period.

  • Cash Flow Statement: Tracks how cash moves in and out of the business.

  • Statement of Changes in Equity: Displays how owners’ equity changes over time.

These reports enable stakeholders — management, investors, creditors, and regulators — to evaluate profitability, liquidity and stability.

Accounting vs. Financial Reporting: Two Sides of the Same Coin

Though the terms are often used interchangeably, accounting and financial reporting serve different purposes.


AspectAccountingFinancial Reporting
PurposeRecords financial transactionsCommunicates financial performance
FocusDay-to-day bookkeeping and accuracyPeriodic summaries and insights
UsersInternal teams (finance, operations)Internal & external stakeholders
TimingContinuousPeriodic (monthly, quarterly, annual)

In short, accounting builds the foundation, while financial reporting tells the story. A well-structured reporting process ensures that data captured through accounting turns into actionable intelligence.

Why Financial Reporting Matters?

Modern financial reporting is far more than producing statements for compliance, it’s about enabling decision-making.


Some key benefits include:

  • Strategic Decision Support:
    Reports reveal trends in profitability, costs, and growth areas.

  • Transparency & Compliance:
    Helps meet regulatory standards and build investor confidence.

  • Performance Evaluation:
    Managers can assess departmental efficiency and ROI.

  • Forecasting & Planning:
    Historical data helps predict future cash flows and budgets.

Without consistent reporting, organizations risk flying blind — unable to measure success or identify issues early.

From Ledgers to Dashboards: The Evolution of Financial Intelligence

Traditionally, finance teams relied on spreadsheets and manual reports to analyze data. Today, however, the landscape has transformed.


With advanced tools and platforms, companies are moving from static statements to real-time financial dashboards that integrate accounting data and visualize it for faster, smarter decision-making.


A Finance Dashboard allows businesses to:

  • Track revenue, expenses, profit and key KPIs in real time

  • Compare financial performance across months, quarters or departments

  • Visualize cash flow trends, cost distribution and profitability ratios

  • Identify financial risks before they escalate

Meanwhile, Accounts Receivable and Payable Dashboards bring additional clarity to cash flow management; providing insights into collections, overdue invoices and upcoming liabilities.


Together, these dashboards transform financial data from static numbers into live insights that empower decision-makers.

The Role of Accounting in Modern Dashboards

For any financial dashboard to be effective, it needs accurate and timely accounting data. Every entry made in the books, from sales invoices to expense receipts, flows into the reporting system.


Here’s how this integration typically works:
Accounting Data → Financial Statements → Dashboard Visualization → Business Insights


This process ensures that dashboards display up-to-date information, helping finance leaders make proactive decisions instead of reacting after the fact.

Best Practices for Effective Financial Reporting

To make financial reporting meaningful and accurate, businesses should focus on these best practices:

  1. Maintain Data Integrity:
    Ensure accounting entries are correct and consistent across systems.

  2. Automate Where Possible:
    Reduce manual errors and save time through automation tools or BI integration.

  3. Standardize Reporting Formats:
    Use consistent templates and metrics (e.g., gross margin %, operating income).

  4. Use Visual Reporting:
    Replace long tables with dashboards for faster interpretation.

  5. Monitor Key Financial KPIs:

    • Gross Profit Margin

    • Return on Assets (ROA)

    • Current Ratio

    • Days Sales Outstanding (DSO)

    • Accounts Payable Turnover

  6. Combine AR & AP Insights:
    Understanding both receivables and payables provides a true picture of liquidity and cash flow health.

Common Challenges and How to Overcome Them

Despite its importance, financial reporting faces several challenges:

  • Data Fragmentation:
    Information scattered across multiple systems or departments.

  • Manual Processes:
    Spreadsheets prone to error and version control issues.

  • Delayed Reporting:
    By the time reports are finalized, the data may already be outdated.

  • Limited Visualization:
    Numbers without context hinder understanding.

Solutions:

  • Use centralized reporting systems or BI dashboards.

  • Integrate accounting and ERP data sources for consistency.

  • Automate data refresh and reporting cycles.

  • Adopt visual storytelling, turning data into actionable narratives.

The Future of Financial Reporting

The next era of financial reporting is data-driven, real-time and predictive.
As artificial intelligence, machine learning, and automation continue to evolve, finance teams will move beyond reporting what happened to predicting what will happen next.


Dashboards will become more interactive, self-updating and intelligent, automatically flagging anomalies, forecasting trends and offering recommendations.


Organizations that embrace this transformation will enjoy:

  • Faster decisions through real-time data

  • Greater accuracy via automation

  • Improved collaboration across finance, sales, and operations

Final Thoughts

Accounting captures the details. Financial reporting gives them meaning. Dashboards bring them to life.


By blending these three dimensions, organizations can move from manual bookkeeping to strategic financial intelligence, where every number tells a story and every report drives action.


In a world where business speed defines success, the future of finance lies not just in reporting the past but in visualizing the future.

Ready for Smarter Industry Decisions? Let’s Talk

Share this blog on:

Search Blog

About Us

Global Data 365 is composed of highly skilled professionals who specialize in streamlining the data and automate the reporting process through the utilization of various business intelligence tools.

Follow us on:

Struggling with complex reports?

Power BI makes it simple!

Industry dashboards

Subscribe to Our Newsletter

[wpforms id="26968"]

Financial Reporting and Accounting: Turning Data into Business Insight Read More »

power bi for industry

Power BI Benefits of Industry Dashboards

Top 10 Benefits of Using Power BI for Industry-Specific Analytics

power bi for industry

In a world where every industry runs on data, one-size-fits-all analytics simply doesn’t work. Each business sector, from finance and sales to hospitality and manufacturing, needs dashboards designed for its unique KPIs and workflows. That’s exactly where Power BI for industry comes in. Global Data 365’s Power BI Industry Dashboards deliver real-time insights, interactive visuals, and industry-tailored intelligence that help organizations turn data into strategic decisions.

1. Unified Industry Dashboards for Full Business Visibility

With dashboards like the Sales Dashboard, Customer Dashboard, Item Dashboard, Finance Dashboard, Hotel Dashboard and Manufacturing Dashboard offered by Global Data 365, you gain one central platform where cross-functional data converges. This holistic view enables you to identify performance interdependencies for instance: how manufacturing output affects item sales, or how hotel occupancy influences finance metrics.


Example: A Sales Dashboard instantly shows which products and regions drive revenue growth, giving managers visibility from order to profit — all in one place.

2. Industry-Specific KPIs Tailored to Each Domain

Each dashboard is built with metrics meaningful to its domain:

  • Finance Dashboard — profit & loss, working capital, budget variance.

  • Sales Dashboard — order trends, top customers, regional performance.

  • Item Dashboard — SKU movement, inventory turnover, margin by item.

  • Customer Dashboard — customer lifetime value, churn, segmentation.

  • Hotel Dashboard — occupancy rate, average daily room rate (ADR), guest spend.

  • Manufacturing Dashboard — production yield, scrap rate, throughput.
    This precision means data insights are relevant and actionable.

3. Real-Time & Interactive Insights

These Power BI dashboards are interactive: you can filter, drill-down, and explore data in real time. For example, the Item Dashboard might let you click into a SKU and immediately see its sales trend, margin history and inventory status. This immediacy allows faster reaction to emerging issues or opportunities.


Example: In the Hotel Dashboard, live booking data automatically updates occupancy and revenue KPIs, letting hotel managers track daily room performance with accuracy.

4. Deep Drill-Down Analytics Across Industries

From a high-level view you can dive into specifics:

  • In the Sales Dashboard, click into a region to see top items using the Item Dashboard.

  • In the Hotel Dashboard, drill into a property or guest segment to see finance impacts in the Finance Dashboard.
    Such linkage across dashboards ensures you’re not just looking at siloed data, but connected insights.

Example: The Real Estate Dashboard lets you drill from total revenue down to individual property performance, uncovering which properties generate the highest rental yields.

5. Forecasting & Trend-Spotting for Strategic Advantage

Industry-specific dashboards help spot patterns: in manufacturing you may detect yield declines; in hotels you may see an occupancy drop tied to guest reviews; in sales you could spot a SKU losing momentum. These insights help you proactively adjust strategy rather than react after the fact.


Example: The Project Management Dashboard uses historical data to predict upcoming project delays or cost overruns, empowering managers to take preventive actions.

6. Seamless Integration with Business Systems

Dashboards like those from Global Data 365 are built to integrate with ERP, CRM, PMS (for hotels), manufacturing systems, inventory systems etc. That means your Sales, Finance, Manufacturing, Hotel dashboards all pull live from core systems, reducing manual data work and boosting accuracy.


Example: The HR Dashboard automatically syncs employee data from your HRMS, giving you up-to-date insights on hiring trends and workforce performance.

7. Cross-Team Collaboration Made Visual

When each function uses a standardized dashboard (Sales, Item, Customer, Finance, Manufacturing, Hotel), different teams speak the same data language. Sales refers to the Sales Dashboard; operations references the Manufacturing Dashboard; finance looks at the Finance Dashboard. Shared understanding fosters collaboration and alignment.


Example: In the Hospital Dashboard, administrators and department heads can view shared KPIs like patient admission rates and bed occupancy, ensuring medical, finance and operations teams work in sync. Whether managing patient care, clinical operations, or healthcare administration, organizations such as Lifespan Health can benefit from centralized reporting and analytics platforms like Power BI.

8. Strong Visualizations & Storytelling Power

Power BI’s visual capabilities (charts, heatmaps, slicers, drill-through) are leveraged deeply in Global Data 365’s industry dashboards. You’re not just seeing tables of numbers, you’re seeing visuals that tell a story: e.g., in the Hotel Dashboard a waterfall chart shows revenue by guest segment; in the Customer Dashboard a segmentation treemap highlights high-value groups.


Example: The Restaurant Dashboard uses color-coded visuals to show peak dining hours, top-performing menu items, and customer satisfaction scores, making trends instantly clear to management.

9. Scalable & Customizable for Growth

Whether you’re a single-site hotel or a global chain; a manufacturing plant or a multi-plant operation; a regional sales team or a global sales force the dashboards offered are designed to scale. You can customise them: add new KPIs, adjust visuals, filter by geography, adapt to new products. Global Data 365’s samples show this flexibility across domains.


Example: A Property Management Dashboard can scale from tracking 5 buildings to 500, giving real estate companies unified oversight across all assets.

10. Informed Decision-Making Across Industries

The ultimate benefit: with all these dashboards (Sales, Customer, Item, Finance, Hotel, Manufacturing) you can make data-driven decisions with confidence. Want to know how a drop in item inventory is impacting sales? Or how a shift in manufacturing yield is shaping cost of goods sold and finance margins? Or how guest behaviour in a hotel correlates with revenue trends? These dashboards tie it all together.


Example: The Logistics Dashboard helps identify delivery delays, optimize routes, and track shipment costs, enabling logistics managers to make real-time operational decisions that cut expenses and improve reliability.

Final Thoughts

Leveraging industry-specific dashboards from Global Data 365 built in Power BI isn’t just about better reporting, it’s about enabling actionable, domain-specific insights across your business. Whether you operate in sales, manufacturing, hospitality, or finance, you get tailored views, real-time data, visual storytelling and cross-department alignment.

Ready for Smarter Industry Decisions? Let’s Talk

Share this blog on:

Search Blog

About Us

Global Data 365 is composed of highly skilled professionals who specialize in streamlining the data and automate the reporting process through the utilization of various business intelligence tools.

Follow us on:

Struggling with complex reports?

Power BI makes it simple!

Industry dashboards

Subscribe to Our Newsletter

[wpforms id="26968"]

Top 10 Benefits of Using Power BI for Industry-Specific Analytics Read More »