Business Intelligence Help in Demand Forecasting
How Does Business Intelligence Help in Demand Forecasting?

- Global Data 365
Businesses are investing significantly in advanced analytics to maintain a competitive advantage and improve their result due to big developments in artificial intelligence and machine learning. Business Intelligence in Demand Forecasting is one of these fields where businesses extract information from existing data to assess purchasing patterns and predict future trends through predictive analytics.
Predictive analytics makes use of a combination of data, statistical algorithms, and machine learning approaches to predict the likelihood of future outcomes based on the past. Every sector, from banking to retail, uses this technology to assess consumer responses or orders, forecast inventory, manage capital, and even detect fraud. Predictive analytics is becoming more popular, even though it has been around for decades, thanks to increasing quantities of data and readily available tools ready for a transformation.
Below we will look at how market intelligence can help with demand forecasting, a type of predictive analytics that focuses on consumer demand. We’ll go into what demand forecasting is, how it operates, and how to get started with it using business intelligence tools.
What is Demand Forecasting?
Demand forecasting is a type of predictive analytics that focuses on predicting customer demand for products and services. It estimates potential demand based on historical data and current market conditions and sets the level of supply-side preparedness needed to match demand.
Demand forecasting is important in production planning and supply chain management, even if it isn’t an acquired skill. Demand forecasting impacts everything from budgeting and financial planning to capacity planning, sales and marketing planning, and capital investment.
Why Should You Use Demand Forecasting?
Manufacturers, distributors, and retailers use demand forecasting as an important part of supply chain planning to gain insight into their activities and make educated, efficient decisions about pricing, inventory stock, resource optimization, and more.
Listed below are some major reasons why demand forecasting is so important in today’s supply chain:
- Increased customer loyalty (providing customers with the items they want, whenever they want it).
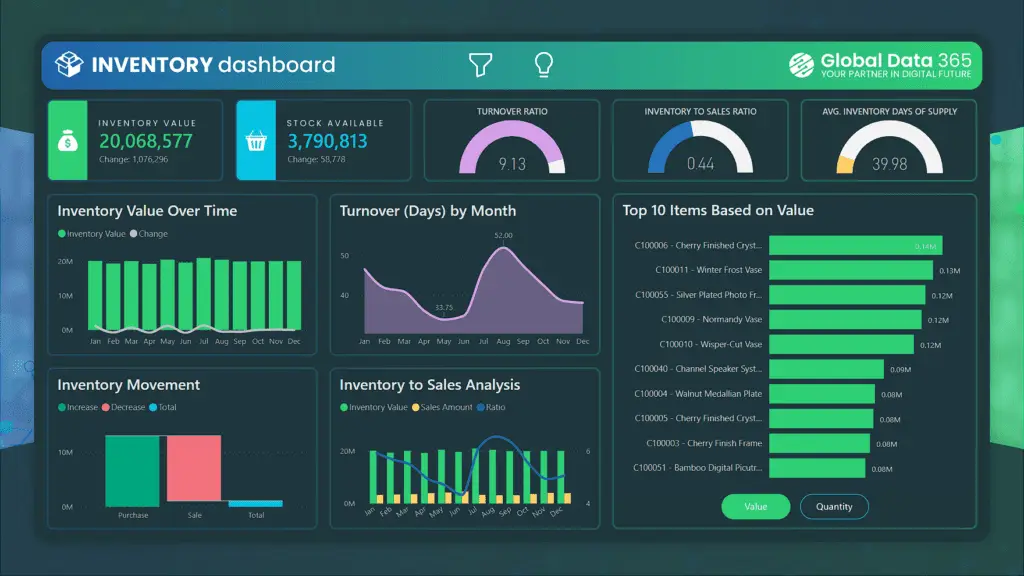
- Inventory management to minimize stock-outs and overstocking.
- Effective raw material and labor scheduling.
- Improved capacity planning and resource allocation.
- Better distribution planning and logistics.
- Affordable pricing and promotion.
Use of Business Intelligence in Demand Forecasting
Data is used in demand forecasting. If the data you use is incorrect, the math and how you apply it will result in under or overestimated demand, leaving you with a slew of disgruntled customers or an overabundance of goods. Most businesses use a business intelligence solution to help with data planning, data co-ordination, and forecasting to better understand demand and supply.
Business intelligence software is designed to capture, unify, sort, tag, analyze, and report on large volumes of data. Here are four main areas where market intelligence can help you get started with reliable demand forecasting:
Data Preparation
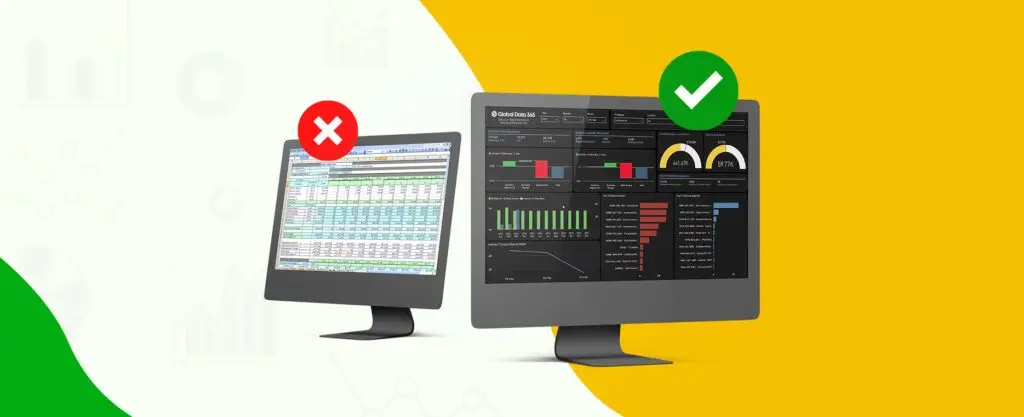
Most businesses fail to cleanse, verify, and audit their data regularly. As a result, 40% of company data is either incorrect, incomplete, or inaccessible (Gartner). BI software allows you to organize and monitor your data in one place, ensuring that your analytics are based on reliable data.
Data Collection
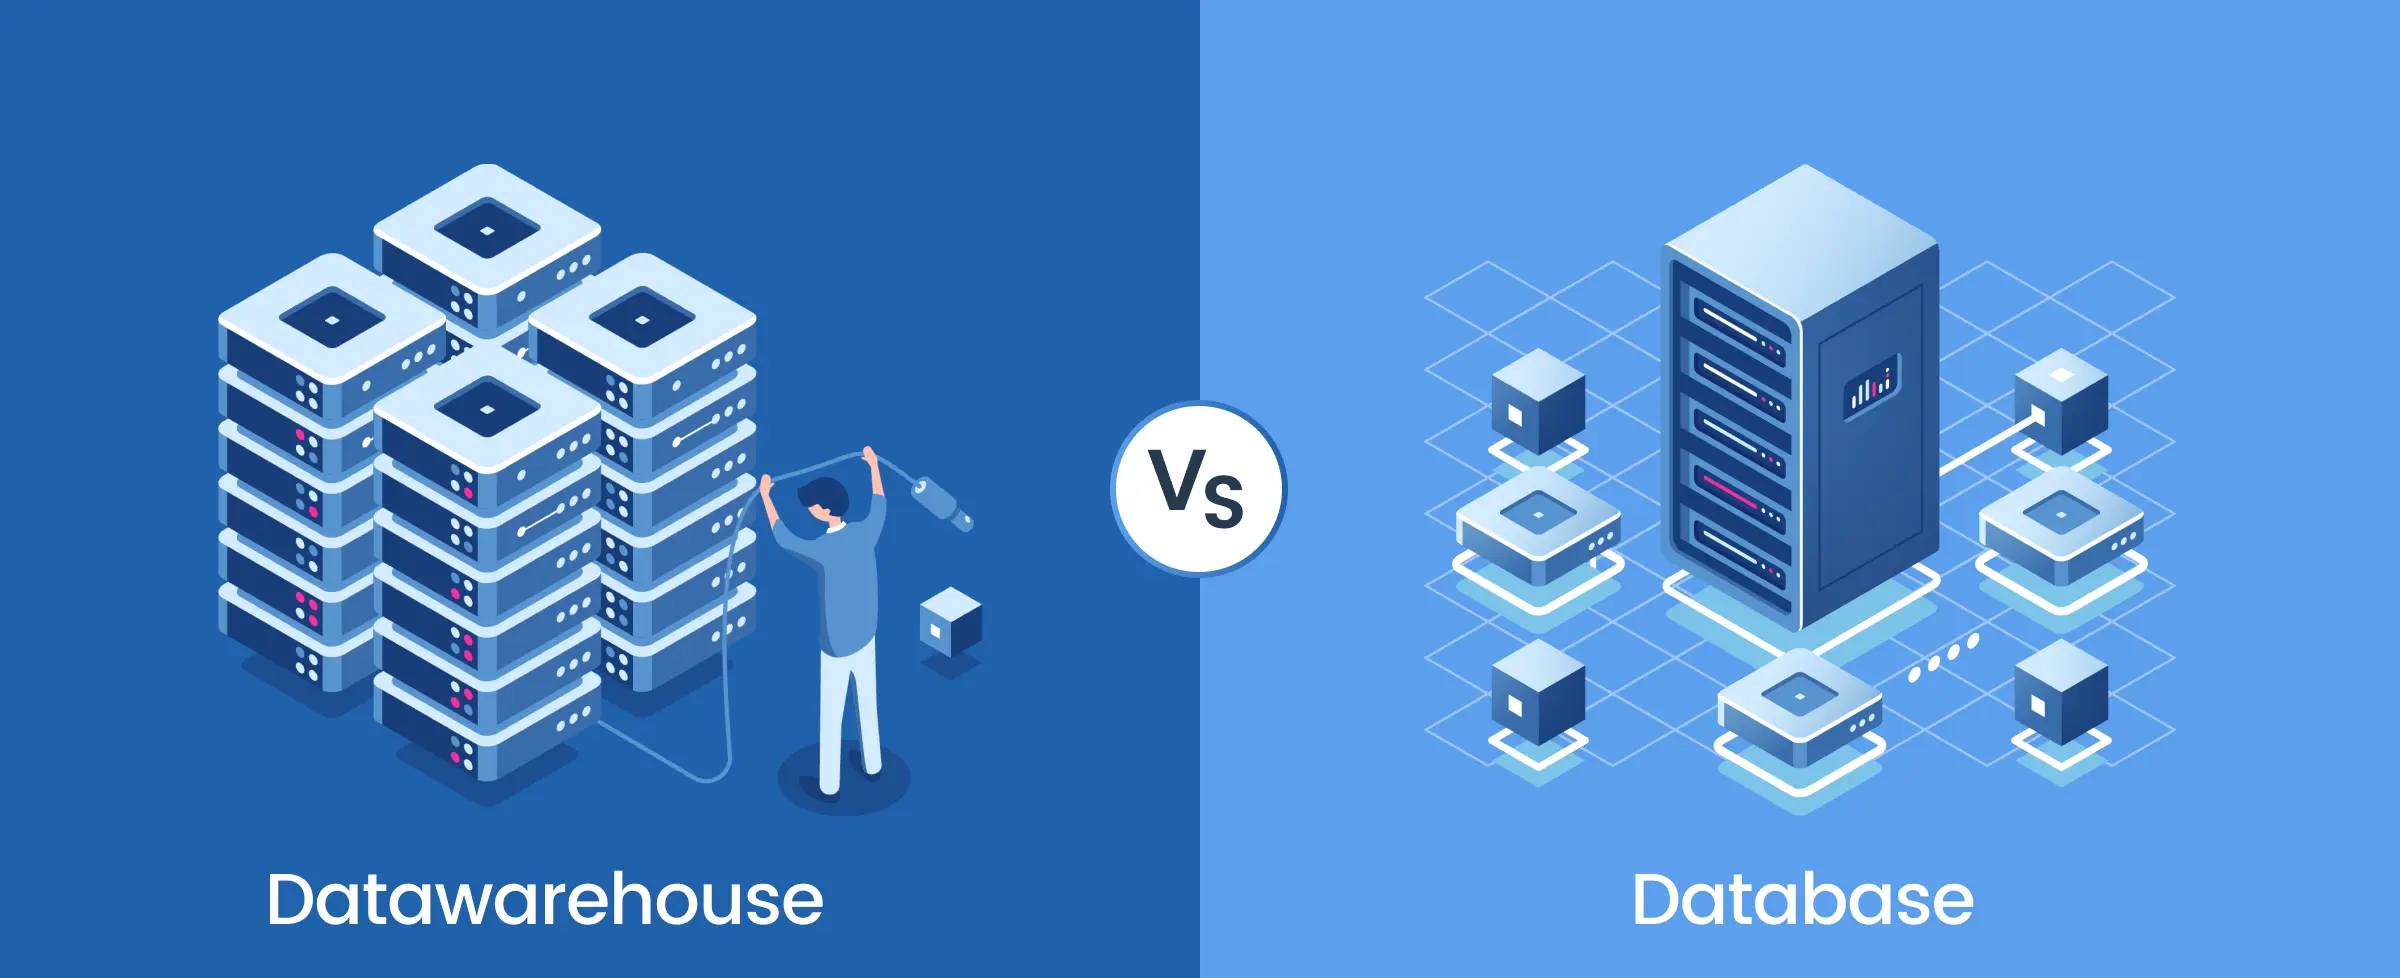
A data warehouse can assist you in gathering business data from a variety of sources and using it for accurate reporting and analytics. Data warehouse-powered BI will help correlate data from different systems to provide further visibility into the supply chain, revenues, and financials, among other items.
Data Analysis
BI software is built for processing and measuring large quantities of data. Maintaining a system of records, which includes historical records and various data sources, ensures that all findings are based on the same version of the facts.
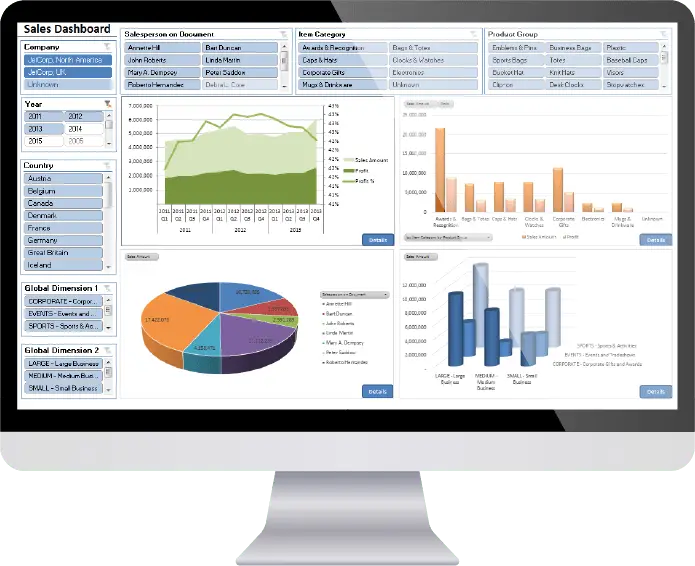
Reporting and Analytics
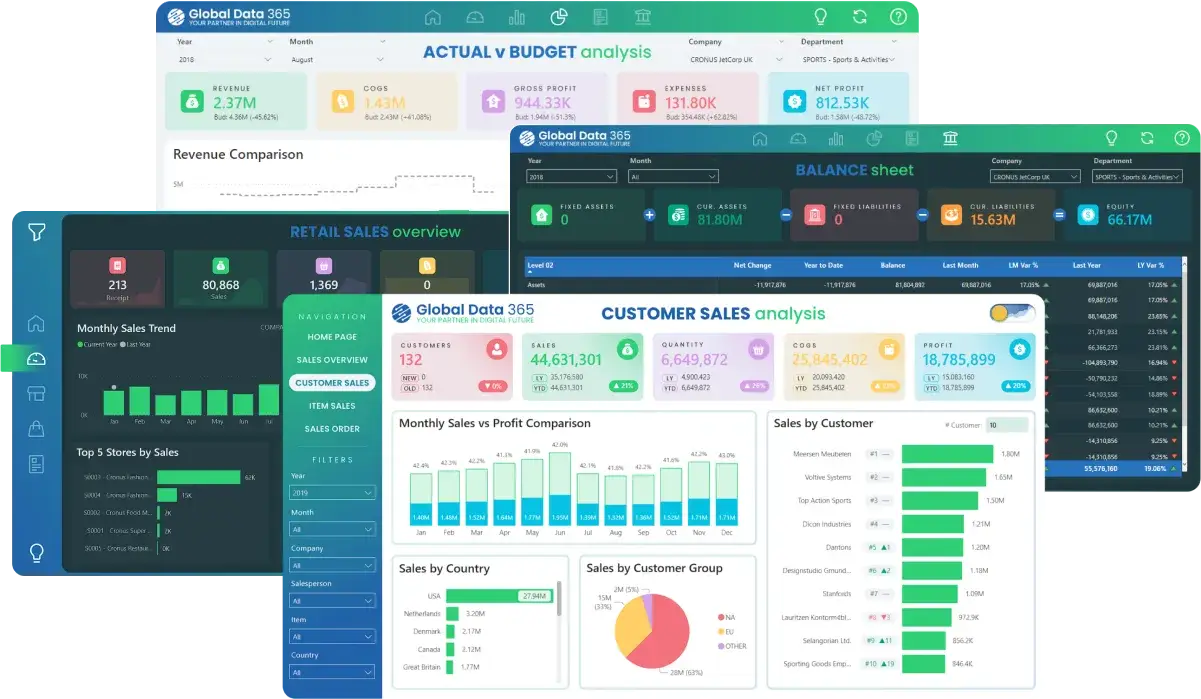
With pre-built dashboards, BI software will give you a single view of results and reports for the rapid dissemination and exchange of real-time information on demand. This encourages better preparation and coordination between the teams.
Improve your data quality and plan your data for reliable demand forecasting by learning more about what you need to do. At Global Data 365, we will analyze your current systems and show you how business intelligence will help you build the technology base for your company.
Contact our team for more information!
Talk to our BI Experts
Search Blog
Related Resources
Overcome Your Fear of Advanced Analytics

Cash Flow Analysis with Microsoft BI

Everything You Need to Know About BI Dashboard
Interact Live with Dashboards
Increase efficiency and deliver success now with Microsoft Power BI. Enjoy a 20% discount on all Power BI services.
Subscribe to Our Newsletter
Business Intelligence Help in Demand Forecasting Read More »