Why is Building a BI Strategy Important?
Why is Building a BI Strategy Important for Businesses?

- Global Data 365
Many business executives face the ongoing challenge of obtaining straightforward and reliable reporting from their business software systems. While they recognize the vast amount of data at their disposal, the processes of extracting, organizing, and evaluating that data often seem unnecessarily complex. This is where Global Data 365 comes in. We are committed to simplifying the reporting process through a robust BI Strategy, making it more efficient and accessible for everyone in the organization.
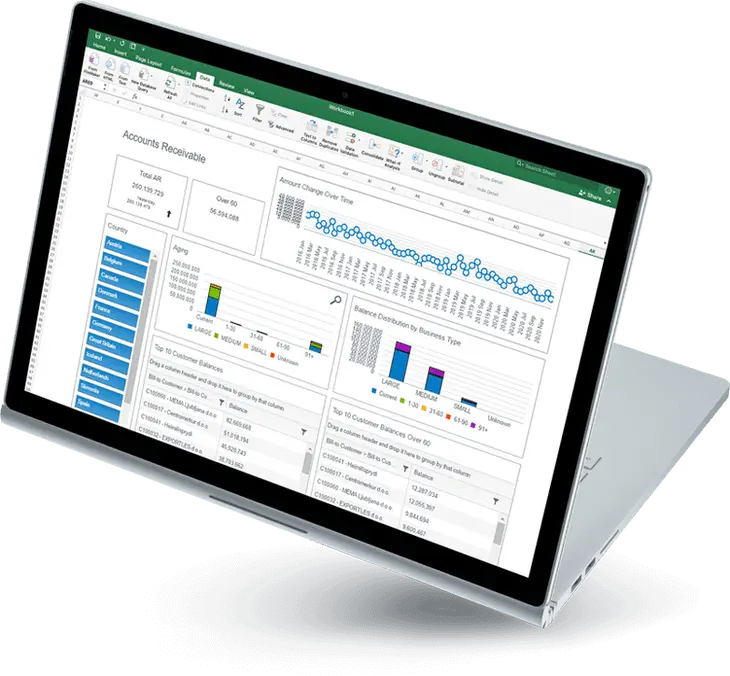
Business intelligence is the method of transforming raw data into actionable information. It helps you to gather data from various sources, arrange it, and then analyse it. In recent years, BI has exploded in popularity among small and mid-sized businesses (SMEs), owing to advances in technology that have made powerful analytics accessible to businesses of all sizes.
When you realize the real business advantages that powerful reporting can offer, BI resources provide a very good return on investment. A BI strategy will let you solve all your data problems and requirements, create a coherent structure, and sustain it. What happens if you begin BI implementation without a plan? In other words, if you are focused on making those graphs but no one in the business understands why or how to use them.
There is no one-size-fits-all solution because every other organization is unique. In the end, it’s all about figuring out where the company is now, where you want it to go in the future, and how you will get there.
Why Stock Reporting Tools Are Not Effective
Most businesses already use a variety of monitoring methods, and they may not even be aware of how disorganized their processes are. Consider the different tech platforms that your company employs. Most businesses use an ERP system to manage their financial and operational activities daily. Some companies have their own CRM system that may or may not be integrated with the ERP. Others use a digital marketing automation tool to generate and develop leads, improve customer interaction, and increase brand recognition and reputation.
These structures have their own set of reporting features. Unfortunately, such methods are frequently intended to be effective. They meet the basic reporting criteria, but they are limited in terms of versatility and complexity. Those tools, in many cases, lack the ability to generate custom reports.
Frequently, current reports cannot be modified to benefit the organization’s strategic, complex business processes.
ERP software, in general, is infamous for requiring specialized IT skills for report creation and customization. This entails allocating limited IT resources to the task or hiring costly outside contractors to complete the task. Accounting, inventory, sales, and buying are the only areas where ERP reports can provide details. There is some consumer data there, but it is likely to be minimal.
To some degree, integration can help with the issue of information silos, but it can only go so far. However, some companies have begun to realize that time-consuming workarounds are inevitable disadvantages. The process of running reports through two to three different systems, then exporting the information to Excel, and forming a report takes time and manual errors.
BI systems must address the differences between the software systems that business leaders rely on to control their businesses and to deliver genuinely accurate reporting that offers a unified view of the business. A successful BI platform should deliver data in real-time and be simple enough to use so that everyone in the company can create and change reports without needing specialized skills.
Cloud ERP
As companies move toward Cloud ERP, they must think about the consequences of reporting and analytics. Most tech providers have taken the requisite measures to change the way you access data as they have moved to a cloud-first approach. Businesses that used a cloud ERP framework will no longer render direct database queries using structured query language due to security concerns. This is a technological transition, but it has far-reaching consequences for business intelligence.
As companies move to Microsoft Dynamics 365 Finance & Supply Chain Management from Microsoft Dynamics AX, for example, they will have a variety of options for accessing data and running reports. A better solution for businesses looking for a dependable BI platform with a low total cost of ownership is to look for a robust, validated reporting and analytics product that is optimized for high performance and ease of use.
Building Powerful BI Strategy
In any company, BI can be used to effectively improve operations. Everyone will concentrate on the same goals, collaborating with the same KPIs to push action and develop procedures, when the whole team is working from the same strategy and has access to a common source of reality. Although technology is a part of every discussion about business intelligence, it should not be the baseline. Building an effective BI strategy must address the requirements of the organization’s financial and operational decision-makers. It should meet financial and operational reporting needs with powerful and adaptable tools that enable everyone in the company to create and adjust ad hoc reports without requiring advanced training or IT skills.
At Global Data 365, we provide effective business intelligence solutions to meet your company’s needs. Some major questions that make their BI strategy effective are:
– What are the record systems of your business data?
These are typically the starting point for creating a cohesive approach to reporting, putting together data that provides business leaders with a comprehensive picture, a unified understanding of what’s going on in the company.
– In the company, how does your team use reporting?
Which reports do decision-makers consult on a regular, weekly, or monthly basis? What happens if you need an urgent report?
– Are the financial reporting systems capable of completing period-end closing quickly and efficiently?
Is there a way to make the period-end process more efficient and automated? Do the numbers in the general ledger and sub-ledgers of the ERP method immediately connect to the reconciliations and supporting worksheets?
– When do the stakeholders receive the information?
Have you ever had a situation where you wanted details right away but couldn’t get them? What were the consequences of the delay?
– Is your company thinking of shifting to cloud ERP or cloud CRM system?
If it is so, you must link with a provider who can meet your needs both now and, in the future, when you migrate to the cloud.
When you answer these questions, it can help you figure out what you want to do with BI in the coming years, as well as the kinds of benefits your company will reap in the short and long run.
Usually, when companies are implementing a BI plan, the finance department’s specific reporting requirements are ignored, but with Global Data 365 onboard that won’t happen, as we prioritize customer satisfaction.
Talk to Our BI Experts!
Search Blog
Related Resources

9 Ways you are failing at Business Intelligence(BI)

Cash Flow Analysis with Microsoft BI

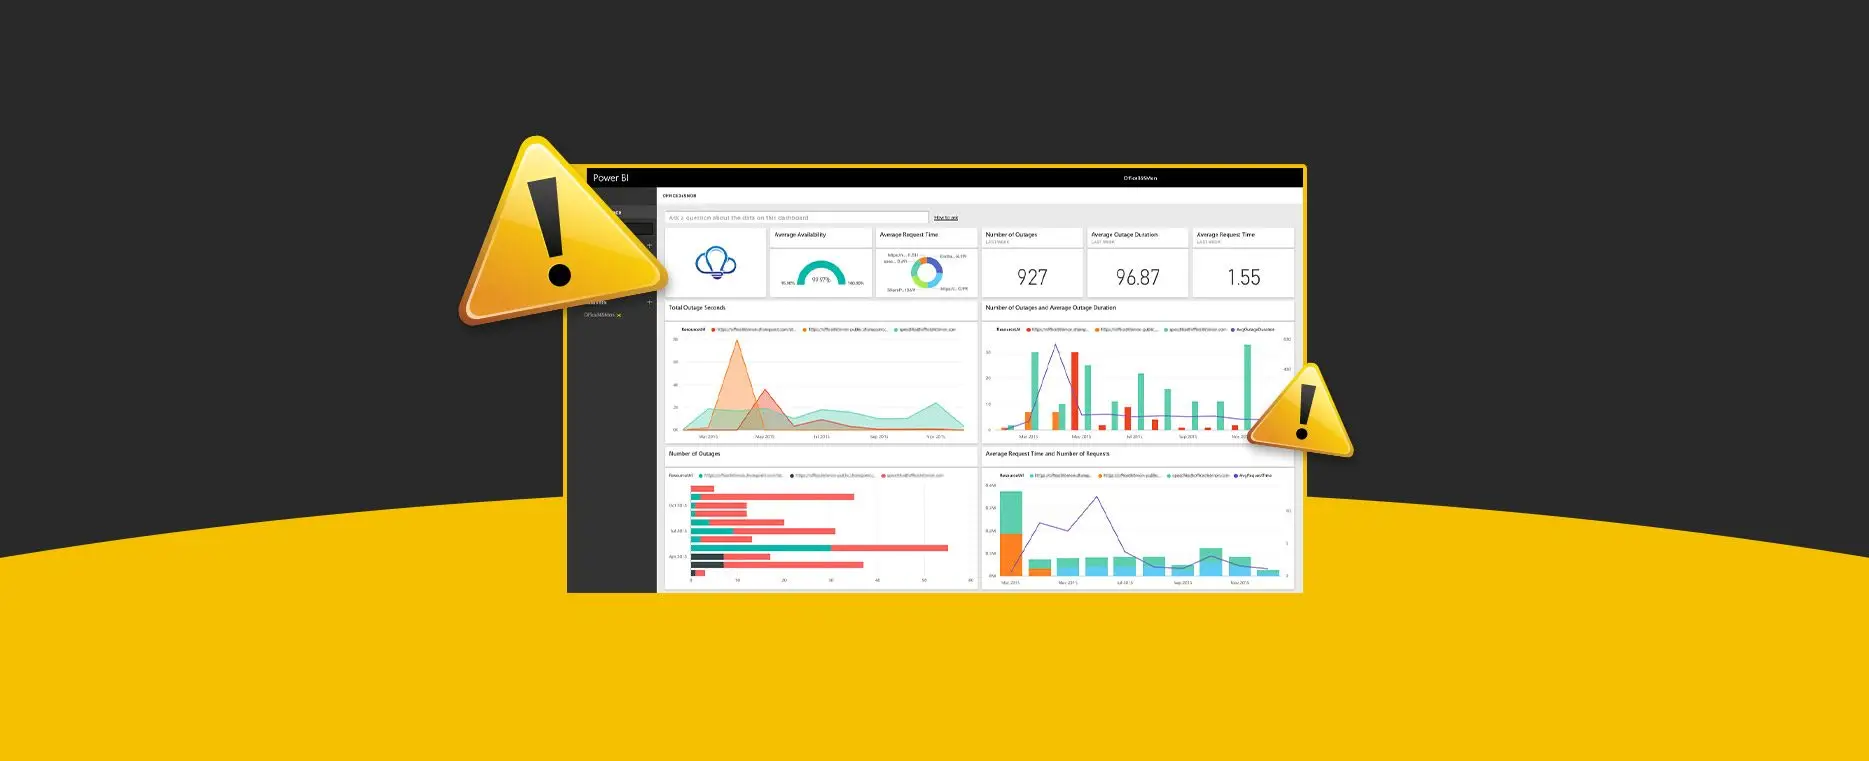
Why BI Implementation Can Be Risky?
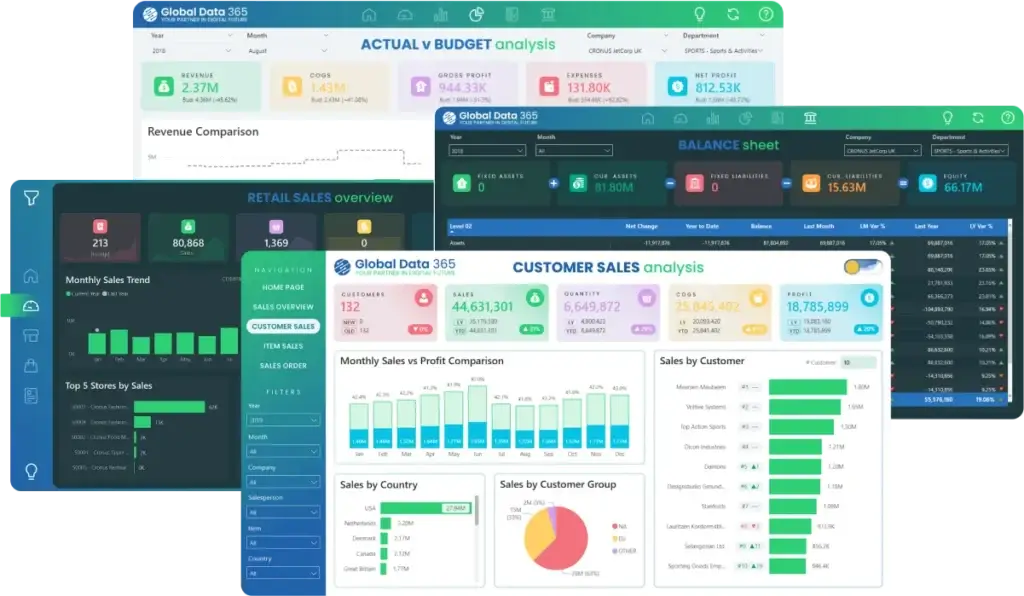
Interact Live with Dashboards
Increase efficiency and deliver success now with Microsoft Power BI. Enjoy a 20% discount on all Power BI services.
Subscribe to Our Newsletter
Why is Building a BI Strategy Important? Read More »