Limitations of Power BI – Are They Risky?
Limitations of Microsoft Power BI
- Global Data 365
If your business is considering implementing Microsoft’s Power BI analytics framework, you must understand the level of complexity and limitations of Power BI involved in successful integration. Power BI is a many-month software project based on a complex mix of technological elements, not just a device you install and customize. To get it right, you’ll need a lot of preparation and the highest level of management skills. So, what is Power BI and what are some limitations of Power BI?
Power BI
Microsoft’s Power BI is a cloud-based business intelligence service package. It uses insightful visualizations and tables to transform raw data into usable information. Data can be processed and used to make strategic business decisions in a short amount of time. Power BI is a set of business intelligence and data visualization tools that includes software services, applications, and data connectors. Power BI is a user-friendly tool with versatile drag-and-drop design and self-service capabilities. Power BI can be used on both on-premises and cloud systems.
So, what are the limitations of Power BI that you can avoid?
What is Jet Reports?
Jet Reports, on the other hand, is a dynamic business intelligence tool that goes beyond conventional financial reporting. With its user-friendly interface and Jet Dashboard Designer, organizations can leverage its capabilities for comprehensive financial reporting and analysis. Jet Reports is known for its adaptability and ease of use, making it an asset for businesses aiming to enhance their reporting processes.
We are going to give you three scenarios where a user should consider switching to Jet Reports or Jet Analytics:
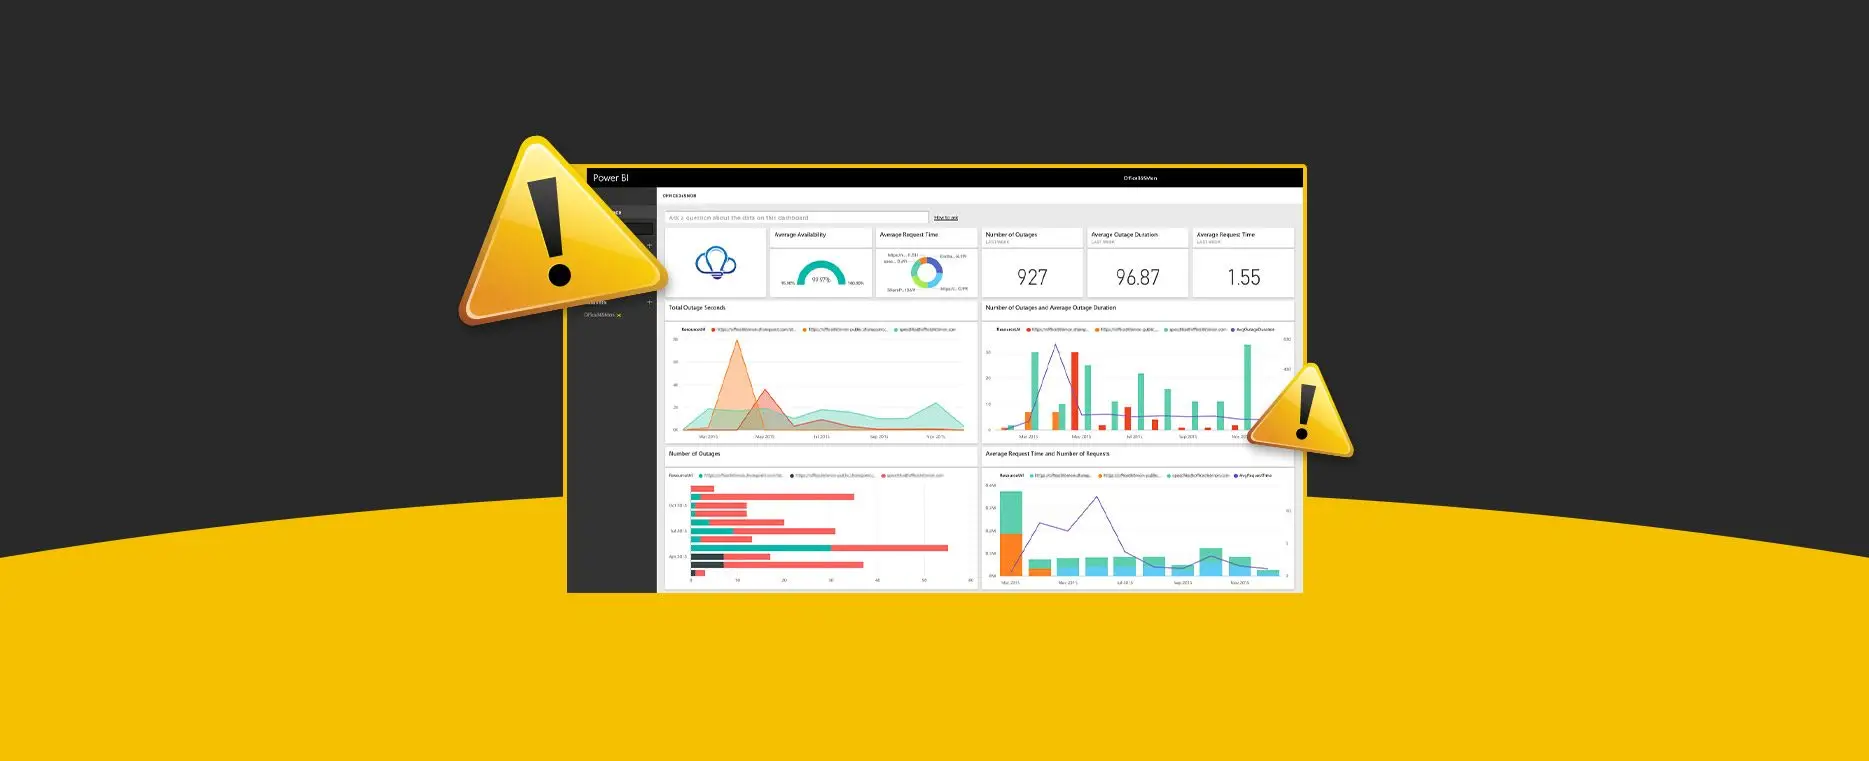
Complexity Involved with Power BI
Most of us have become used to applications that can be downloaded in minutes or even hours in the case of more advanced systems. That’s a fairly straightforward scenario. At the other side of the curve are items that entail some configuration and are designed and implemented by a team of specialized experts to overcome the limitations of Power BI. A full Power BI implementation must solve a slew of design issues. The answers to those questions will affect efficiency, productivity, and adaptability in the long run. Some of the major differences between a Power BI cloud deployment and an on-premise deployment. For instance:
– What features should you run, where should they run, and how will they all interact?
– What level (or levels) of security do you incorporate?
– Will you be using SQL Server Analysis Services to model your results, or will you use the Power BI desktop tool?
– Should you use Power BI’s Direct Query function or import data?
– Will a gateway component be needed, and if so, where will it be installed?
All these are technical questions, but the solutions have long-term consequences, and it’s always difficult to adjust later. This level of complexity necessitates upkeep, which entails additional costs and disruption.
Power BI: Toolset not a Complete Solution
There are no reports included with Power BI out of the box. In fact, Power BI reporting necessitates a substantial upfront expenditure, not just in terms of constructing the technological infrastructure, but also in terms of deciding how you access the data, how and when data must be converted or pre-processed, where you archive them, and so on. After you have answered those design considerations and limitations of Power BI, you will need to put in a lot of time to set up the data access and data flow.
Data access is becoming more complex in this age of cloud computing. This is particularly true of Microsoft Dynamics 365 products, which no longer require unlimited reporting access. Microsoft has suggested some possible workarounds, but all of them require major compromises. Microsoft has introduced an indirect layer of “data entities” in Microsoft Dynamics 365 Finance & Supply Chain Management (D365 F&SCM), for instance, that developers can use to obtain entry to ERP data. Personalizing Power BI can be very costly. Since every company is different and has its own set of requirements, customization is unavoidable. Recurring costs arise from the ongoing maintenance of such customizations.
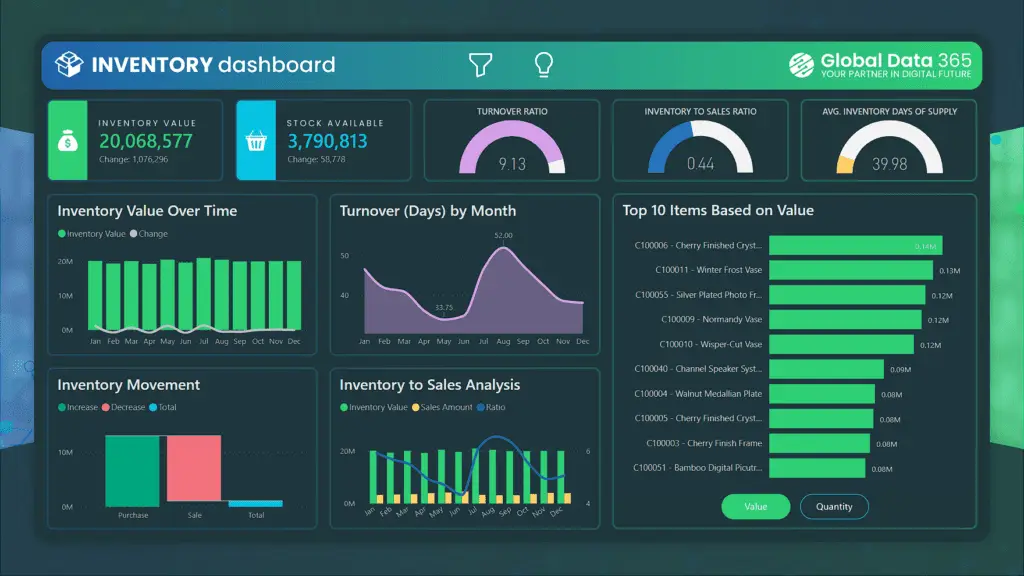
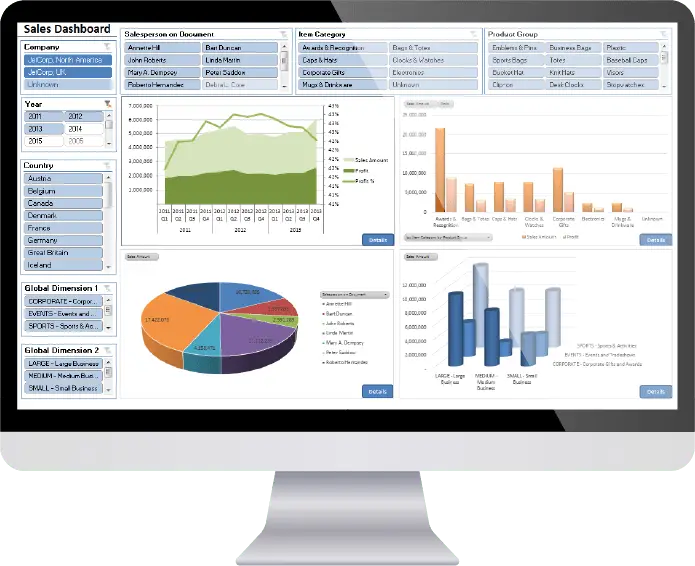
Power BI as a Dashboard Visualization Tool
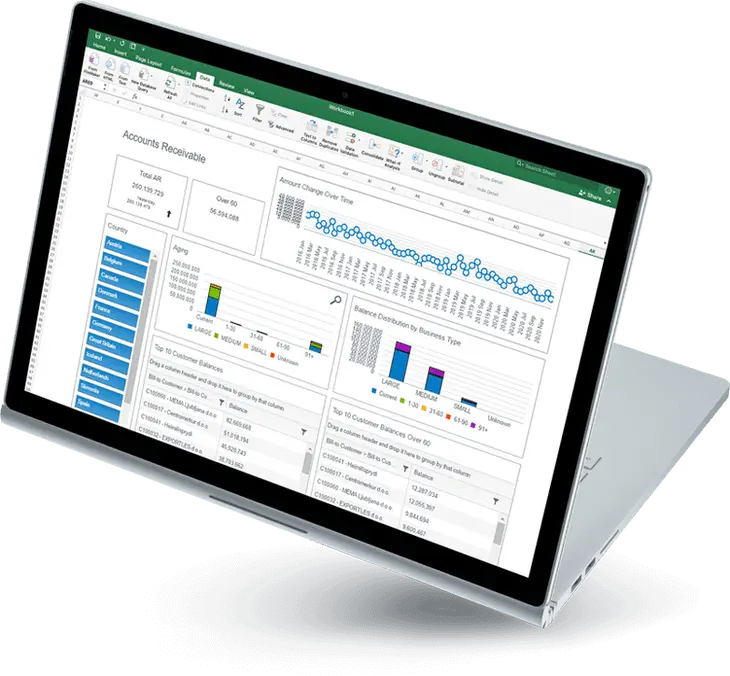
Power BI was developed to be used as a dashboard visualization tool. It does an adequate job of producing conventional tabular reports, lists of individual records with several columns and subtotals, and it does a great job of providing an insightful visual analysis of what is happening in the market. Traditional banking statements are not generated by Power BI because they are somewhat different from other forms of reports. Some more limitations of Power BI such as Filtering, masking, or grouping GL sums by account column, for example, is commonly required when creating a P&L statement. This is often done in different ways for each row in the report.
Columns in the report may be sorted by organizational agency or division, or they can be used to reflect various time spans, budget vs. real, or variance amounts or percentages. Since Limitations of Power BI has a little method of controlling such distinctions, having it generate a comparatively straightforward P&L is a very costly custom programming activity.
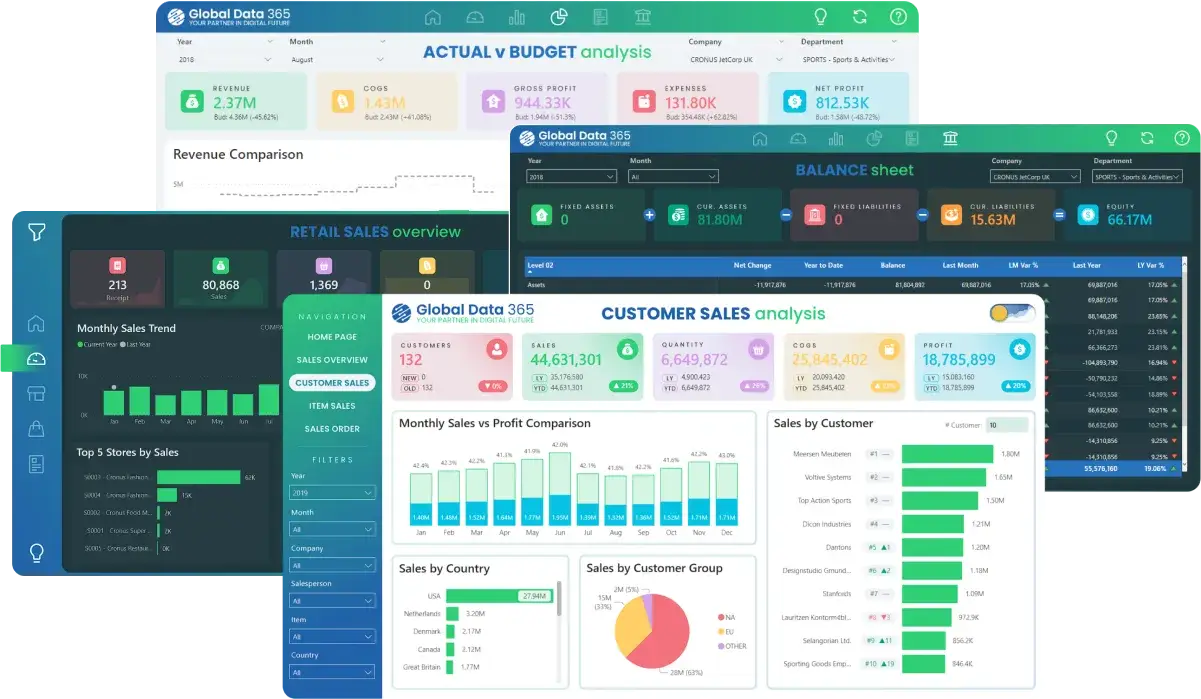
Power BI without the Limitations
Global Data 365 offers self-service, user-friendly analytics and reporting tools, as well as collaboration with Power BI and Excel. With the help of Jet Analytics, we hold the guesswork out of Power BI by automating the process of developing a data warehouse with pre-built connectors for over 140 different ERP systems, allowing business leaders and analysts to have the data they demand, when they need it, without any need for specific commands or the complexity and limitations of Power BI stack.
Need to overcome the limitations of Power BI, opt for our Power BI Training program today.
Register Now and Get 25% on Power BI Training!
Search Blog
Related Resources

What is Power BI?

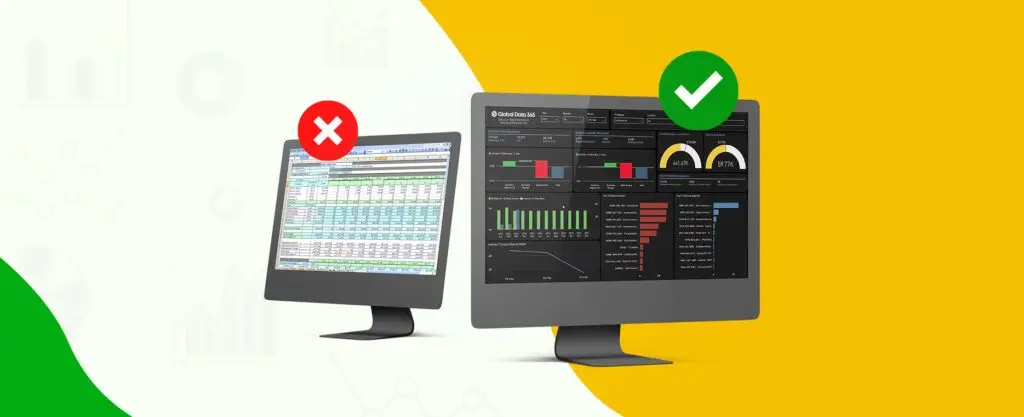
Why Power BI is a Better Choice than Excel for Analytics

Business Intelligence with Power BI: Unlock Data Insights
Subscribe to Our Newsletter
Limitations of Power BI – Are They Risky? Read More »