12 Key Differences between Data Lake and Data Warehouse
Data Lake vs Data Warehouse: What's The Key Difference?
- Global Data 365
With the rise of big data and the explosion of new data sources, traditional data warehousing approaches may not be sufficient to meet the needs of modern data management and analytics, creating confusions between Data Lake vs Data warehouse. This has led to the development of new approaches, including Data Lake and Data Warehouse. Each approach offers unique benefits and drawbacks, and understanding the differences between them is critical to making informed decisions about data management and analytics.
Data Lake
A Data Lake is a centralized repository that allows businesses to store vast amounts of raw, unstructured, or structured data at scale. It provides a flexible storage environment, enabling organizations to ingest diverse data types without the need for upfront structuring. This unrefined data can then be processed and analyzed for valuable insights, making Data Lakes ideal for handling large volumes of real-time and varied data.
Benefits and Use Cases of Data Lake
Data lakes provide scalable and cost-effective storage, accommodating diverse data types such as raw and unstructured data for flexible analysis. With a focus on real-time analytics and advanced capabilities like machine learning, they support innovation in algorithm development. Cost-efficient storage solutions, often leveraging scalable cloud storage, make data lakes economical for managing large datasets.
Use cases range from big data analytics, IoT data management, and ad hoc analysis to long-term data archiving and achieving a 360-degree customer view. In essence, data lakes offer dynamic repositories that empower organizations with flexibility, real-time insights, and comprehensive data management solutions.
Data Warehouse
On the other hand, a Data Warehouse is a structured, organized database optimized for analysis and reporting. It is designed to store structured data from various sources in a format that is easily query able and supports business intelligence reporting. Data Warehouses are characterized by their schema-on-write approach, requiring data to be structured before entering the system, ensuring a high level of consistency for analytical purposes.
Benefits and Use Cases of Data Warehouse
Data warehouses offer a multitude of benefits, including optimized structured data analysis for improved query performance and efficient reporting. They preserve historical data for time-series analysis and audit trails, enhance business intelligence through data consolidation and dashboard creation, ensure data quality and consistency through cleansing processes, and provide scalability to handle growing data volumes.
Common use cases encompass business performance analysis, customer relationship management, supply chain optimization, financial reporting and compliance, and human resources analytics.
Find the visual representation and difference between: Data Lake vs Data Warehouse.
Data Lake vs Datawarehouse: Key Differences
|
Features |
Data Lake |
Data Warehouse |
|
Purpose
|
Used for storing vast amounts of diverse data types for future analysis. |
Optimized for large-scale analytical queries, storing historical data for reporting and analysis. |
|
Data Type
|
Stores raw, unprocessed data in its native format. |
Stores summarized, aggregated, and historical data. |
|
Data Structure |
Schema-on-read, allowing for flexibility in data storage. |
Optimized for read-heavy operations (OLAP – Online Analytical Processing). |
|
Users
|
Primarily used by data engineers, data scientists, and machine learning teams. |
Mainly used by business analysts, data scientists, and decision-makers for insights and reporting. |
|
Data Volume |
Holds vast amounts of unstructured and structured data. |
Handles large volumes of historical data from various sources. |
|
Performance
|
Performance can vary; optimized for large data ingestion rather than query speed. |
High performance for complex queries and large-scale data retrieval for analysis. |
|
Schema Design |
Uses a flexible schema design; data is often stored without a predefined schema. |
Denormalized schema (e.g., star or snowflake schema) for faster query performance. |
|
Data Processing
|
Processes a wide variety of data types, including structured, semi-structured, and unstructured data. |
Processes complex queries requiring significant data aggregation. |
|
Concurrency |
Supports high concurrency for data ingestion and retrieval.
|
Supports a lower number of users. |
|
Storage Cost
|
Typically cheaper to store vast amounts of data due to lower storage costs.
|
Higher storage costs due to large datasets and complex processing requirements.
|
|
Example Use Cases
|
Data exploration, machine learning, real-time analytics. |
Business intelligence reporting, trend analysis, forecasting, decision support. |
|
Data Source |
Captures data from various sources, including social media, IoT devices, and unstructured data. |
Aggregates data from multiple sources, including databases, external systems, and log files. |
- Data Type:
Data Lake: Stores raw, unprocessed data in its native format.
Data Warehouse: Stores summarized, aggregated, and historical data.
- Purpose:
Data Lake: Used for storing vast amounts of diverse data types for future analysis.
Data Warehouse: Optimized for large-scale analytical queries and historical data analysis. - Data Structure:
Data Lake: Schema-on-read, allowing for flexibility in data storage.
Data Warehouse: Optimized for read-heavy operations (OLAP – Online Analytical Processing). - Users:
Data Lake: Primarily used by data engineers, data scientists, and machine learning teams.
Data Warehouse: Mainly used by business analysts, data scientists, and decision-makers for insights and reporting. - Data Volume:
Data Lake: Holds vast amounts of unstructured and structured data.
Data Warehouse: Handles large volumes of historical data from multiple sources. - Performance:
Data Lake: Performance can vary; optimized for large data ingestion rather than query speed.
Data Warehouse: High performance for complex queries and large-scale data retrieval. - Schema Design:
Data Lake: Uses a flexible schema design; data is often stored without a predefined schema.
Data Warehouse: Denormalized schema (e.g., star or snowflake schema) for faster query performance. - Data Processing:
Data Lake: Processes a wide variety of data types, including structured, semi-structured, and unstructured data.
Data Warehouse: Processes complex queries requiring significant data aggregation. - Concurrency:
Data Lake: Supports high concurrency for data ingestion and retrieval.
Data Warehouse: Supports a lower number of users. - Storage Cost:
Data Lake: Typically cheaper to store vast amounts of data due to lower storage costs.
Data Warehouse: Higher storage costs due to large datasets and complex processing. - Data Source:
Data Lake: Captures data from various sources, including social media, IoT devices, and unstructured data.
Data Warehouse: Aggregates data from multiple sources, including databases, external systems, and log files. - Example Use Cases:
Data Lake: Data exploration, machine learning, real-time analytics.
Data Warehouse: Business intelligence reporting, trend analysis, forecasting.
Finding the Right Fit: data lake vs data warehouse
Is there room for both Data Lake and Data Warehouse in your data strategy? Explore the benefits of adopting a hybrid approach, seamlessly integrating the strengths of both solutions for comprehensive data management. Discover the factors to consider when choosing between Data Lake and Data Warehouse solutions. From cost considerations to scalability needs and varying data types and formats, find the perfect fit with Global Data 365 for your business’s unique requirements by contacting us now.
Simplify Your Data – Get a Free Consultation!
Search Blog
Related Resources
What is Data Pipeline?
The Difference between Database and Data Warehouse

What are Data Lakes?

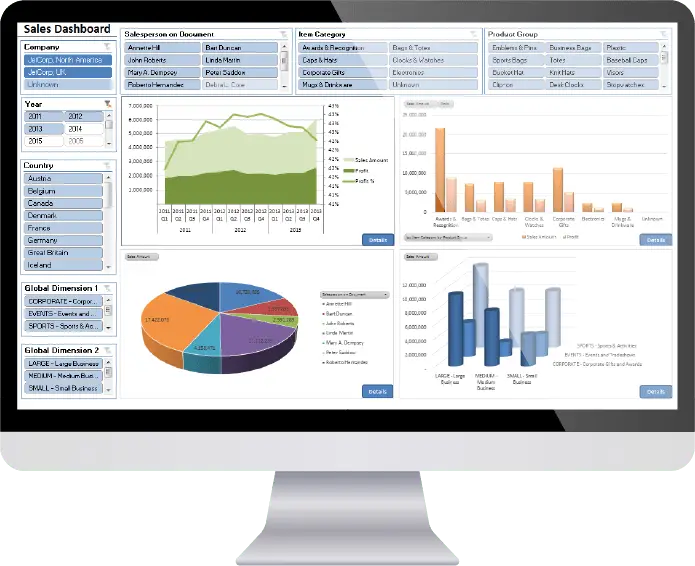
Jet Analytics Data Warehouse
Subscribe to Our Newsletter
Data Lake vs Data Warehouse Read More »