What is Power BI? A Beginner’s Guide

- Global Data 365
Modern businesses depend on data, and we’re producing more of it than ever before. However, accumulating volumes of digital data is useless unless companies can make use of it. Business intelligence tools can help with this. Are you planning to introduce a platform to assist you in extracting valuable, actionable insight from your data? You have arrived at the right place. In this blog, we will go over the fundamentals of Microsoft Power BI, like what it can do, what it costs, and what benefits it can provide to your company.
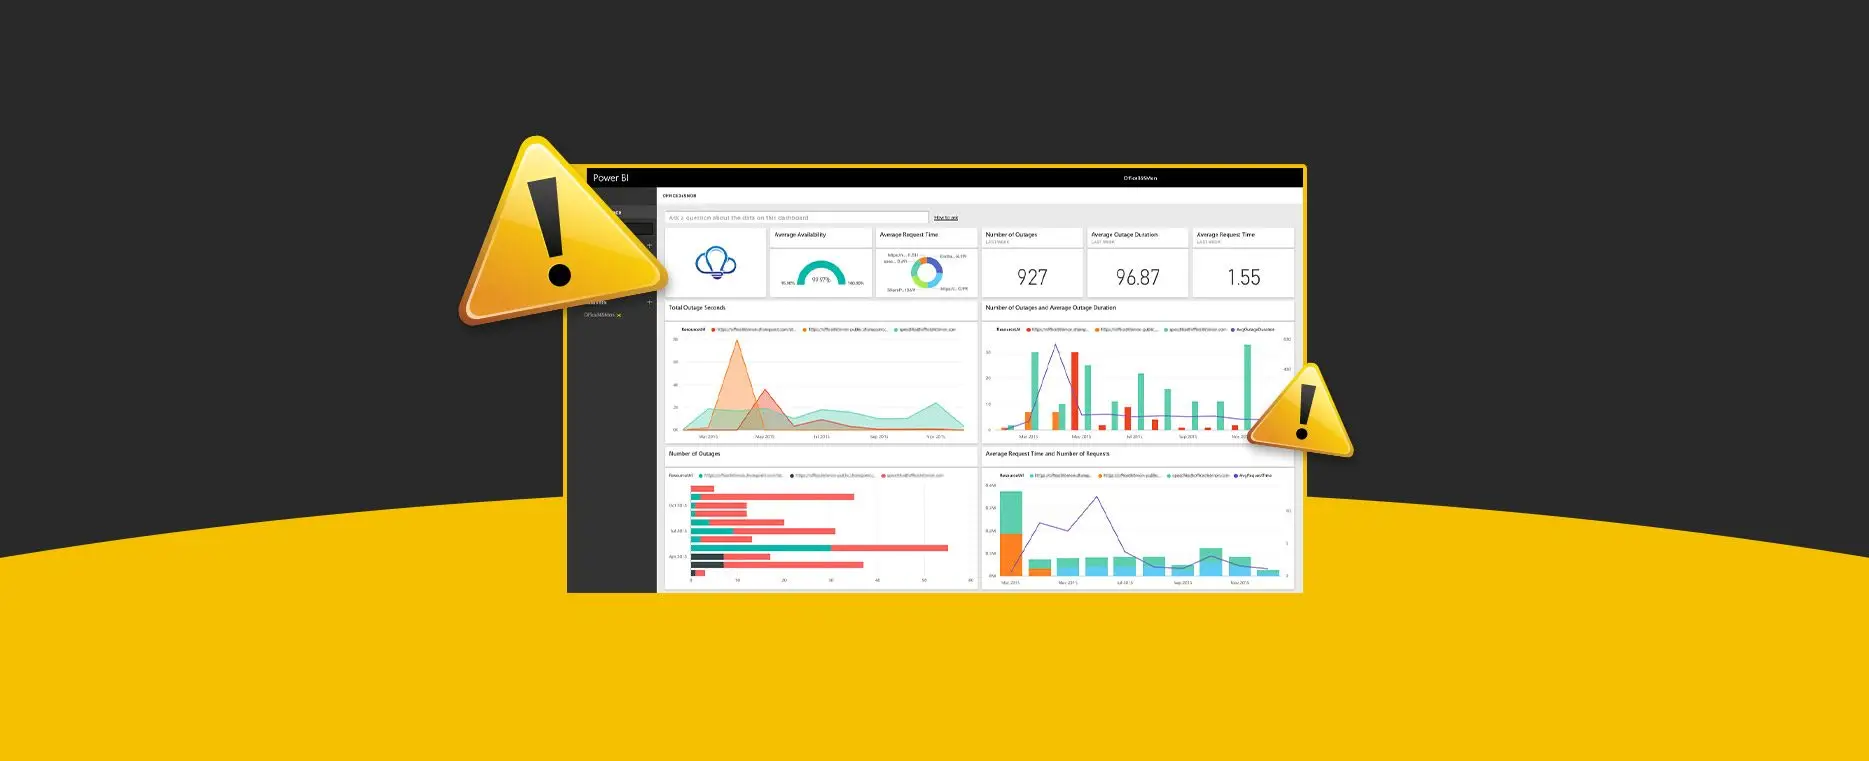
What is Power BI?
Power BI is a business analytics tool by Microsoft that empowers organizations to visualize and analyze data, enabling data-driven decision-making. It allows users to connect to various data sources, transform data, and create interactive reports and dashboards.
Mainly, it draws data together and transforms it, transforming it into meaningful insights, including using visually convincing and easy-to-process charts and graphs. This allows users to create and share simple and useful snapshots of what’s happening in their market.
What is Power BI Used For?
It is primarily used for:
- Data Visualization: Creating visually appealing reports and dashboards that help users understand data trends and patterns.
- Business Intelligence: Transforming raw data into actionable insights to support strategic decision-making.
- Data Analysis: Allowing businesses to analyze data from multiple sources in real-time.
- Reporting: Developing detailed, interactive reports that provide in-depth insights and promote alignment across the organization.
- Sharing & Collaboration: Facilitating collaboration among team members by sharing insights and reports in a secure and controlled environment.
- Financial Analysis: Create and analyze financial reports to understand business performance.
- Marketing and Sales: Leverage data to improve customer engagement and sales strategies.
Components of Power BI
The tool comprises several key components, each serving a specific purpose:
- Power BI Desktop: A desktop application used to create and publish reports. It offers robust data modeling and visualization capabilities and serves as the primary tool for data analysts.
- Power Query: Power Query is a powerful tool for data cleaning and transformation, enabling users to manipulate data from various sources effortlessly. Its intuitive interface streamlines complex processes, ensuring data is efficiently prepared for analysis.
- Model View: A data modeling component that allows users to create complex models, define relationships, and perform calculations using DAX.
- Report View: An interactive data visualization tool that allows users to create dynamic charts, graphs, and maps for data exploration.
- Power BI Service: A cloud-based platform that allows users to share, collaborate, and consume Power BI reports and dashboards. It is ideal for distributing insights across an organization.
- Power BI Mobile: Mobile applications available for iOS, Android, and Windows devices, enabling users to access their reports and dashboards on the go.
- Power BI Report Server: An on-premises server that can host and manage Power BI reports and paginated reports. It is particularly useful for organizations that need to keep their data on-premises due to security or compliance requirements.
Benefits of Using Power BI
Power BI transforms a company’s data into actionable reports and insights by connecting to various data sources and cleaning the information for better comprehension. This enables the creation of shareable reports and visualizations that enhance collaboration across teams.
- Comprehensive Data Insights: Users can analyze historical data, monitor current trends, and leverage predictive analytics to anticipate future outcomes.
- Advanced Analytics: Power BI harnesses machine learning capabilities to identify patterns in data, helping businesses make informed decisions and generate forecasts.
- Interactive Dashboards: Users can create personalized dashboards tailored to their specific needs, ensuring quick access to vital information.
As a stable Microsoft-hosted cloud service, Power BI provides users with seamless access to dashboards, reports, and applications via web browsers or mobile apps for Windows, iOS, and Android. Other benefits of using it include:
- Powerful Visualization Tools: Enhance data understanding with robust visualization features that turn complex data into clear, actionable insights.
- Cloud-Based Advantages: Benefit from cutting-edge intelligence technologies and powerful algorithms that are regularly updated, ensuring users always have access to the latest tools.
- Customizable Dashboards: Tailor dashboards to highlight the most relevant data, allowing users to focus on key performance indicators (KPIs).
- Real-Time Alerts: Set up alerts for critical metrics, keeping users informed of any significant changes or updates in their data.
- User-Friendly Interface: Enjoy a more intuitive experience compared to complex spreadsheets, making data analysis accessible to users at all skill levels.
- Robust Data Security: Ensure data protection with granular access controls, allowing for secure sharing of information both internally and externally.
Power BI Architecture
The Power BI architecture is designed to provide flexibility and scalability. It consists of the following layers:
- Data Sources: Power BI connects to various data sources, including databases, cloud services, and files. Data is extracted and transformed.
- Data Storage: After extraction and transformation, data is stored in the Power BI cloud-based service or on-premises in the Power BI Report Server.
- Data Modeling: Users can create relationships between different data tables, define calculations, and create data models using Power BI Desktop.
- Data Visualization: Users create interactive reports and dashboards using the visualization tools provided in Power BI Desktop.
- Report Publishing & Collaboration: The Power BI Service is where reports and dashboards are published and shared. It also handles user management, security, and data refresh.
Power BI Services
It offers several services that enhance its functionality:
- Power BI Pro: A subscription-based service that provides enhanced collaboration and sharing features.
- Power BI Premium: Offers dedicated cloud resources, greater data capacity, and advanced features, such as paginated reports and AI capabilities.
- Power BI Embedded: Aimed at developers, this service allows reports and dashboards to be embedded within custom applications.
Find the newest article on how to connect Power BI to Claude using MCP Server: Connect Power BI MCP Server to Claude Desktop
Power BI Dashboard
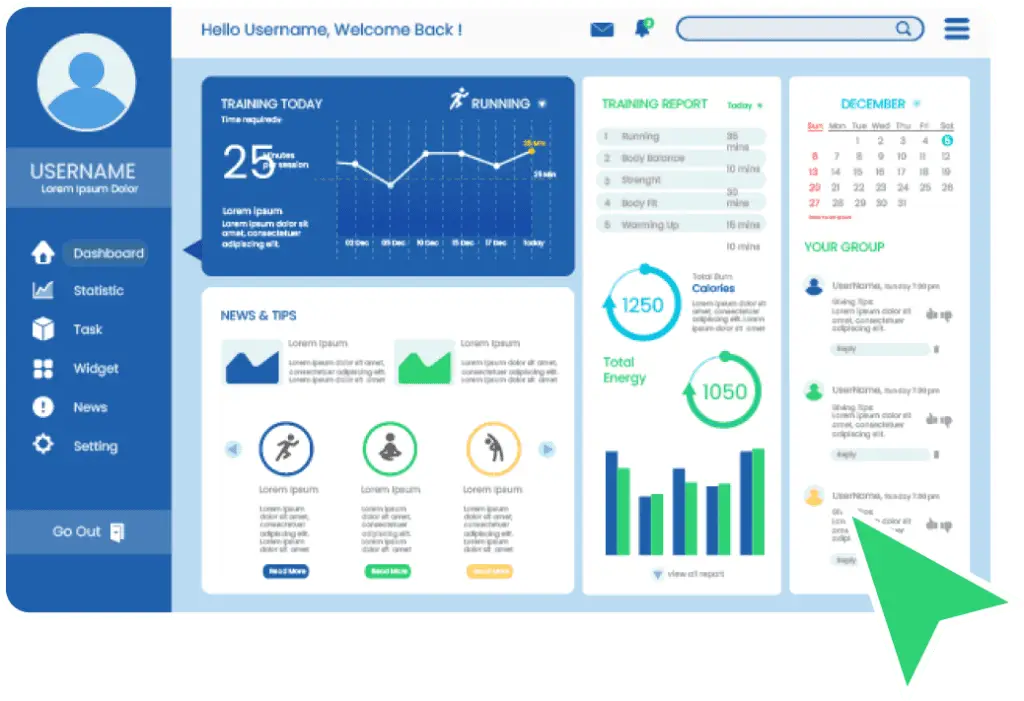
A Power BI Dashboard is a single-page, interactive view of your data, created from one or more reports. It allows users to monitor business metrics briefly and drill down into details as needed. Dashboards can be customized with various visualizations, such as charts, graphs, and tables, and can be shared with others for collaborative decision-making.
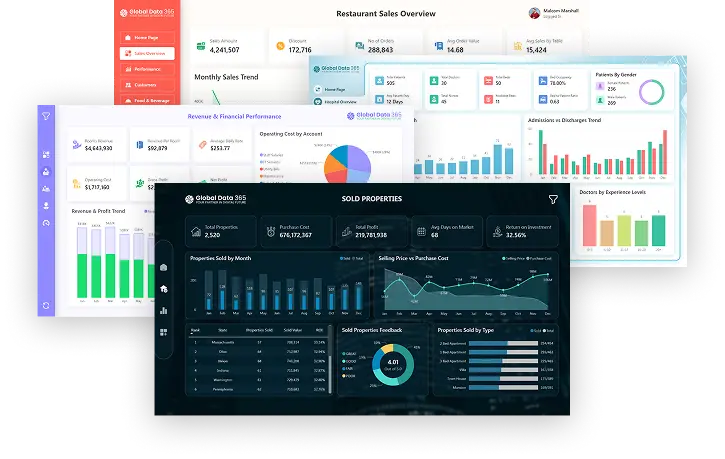
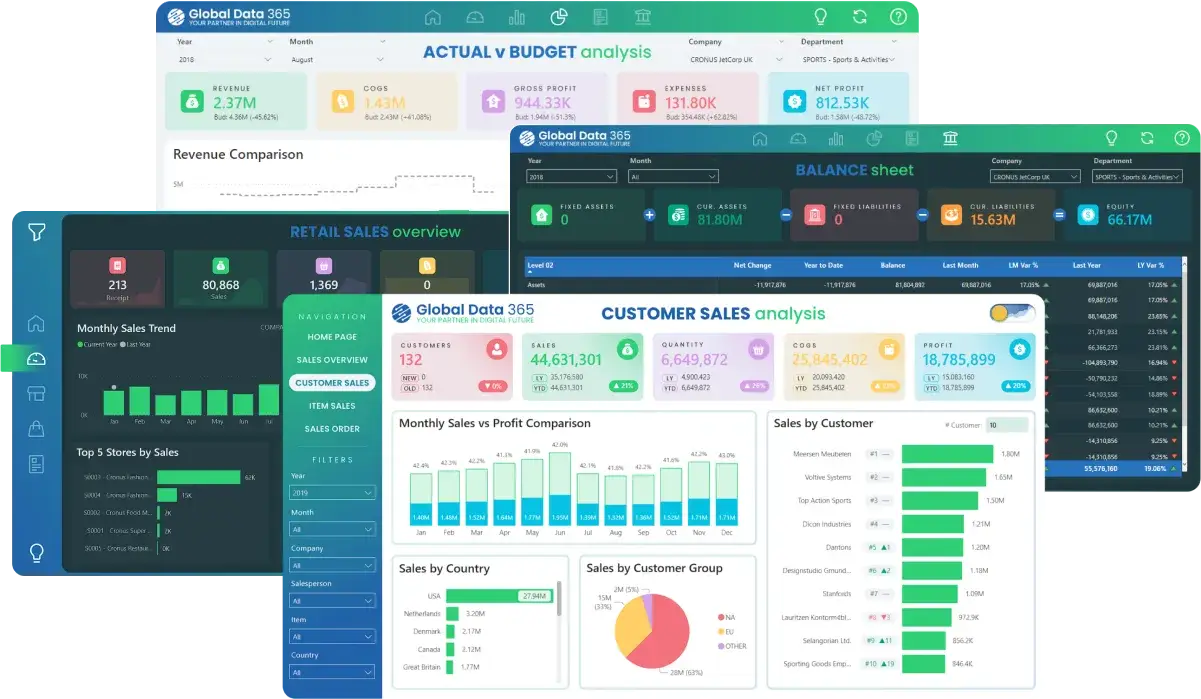
Top Power BI Pack of Dashboards
We offer a customized dashboard package tailored to meet the unique needs of your business. Our dashboards are designed to provide real-time insights and help you make data-driven decisions with ease. Whether you’re looking to optimize financial performance, streamline inventory management, or drive sales, our Power BI dashboards will give you the tools you need to achieve your business goals.
Here’s what you can expect in our Top Pack of BI Dashboards which includes following:
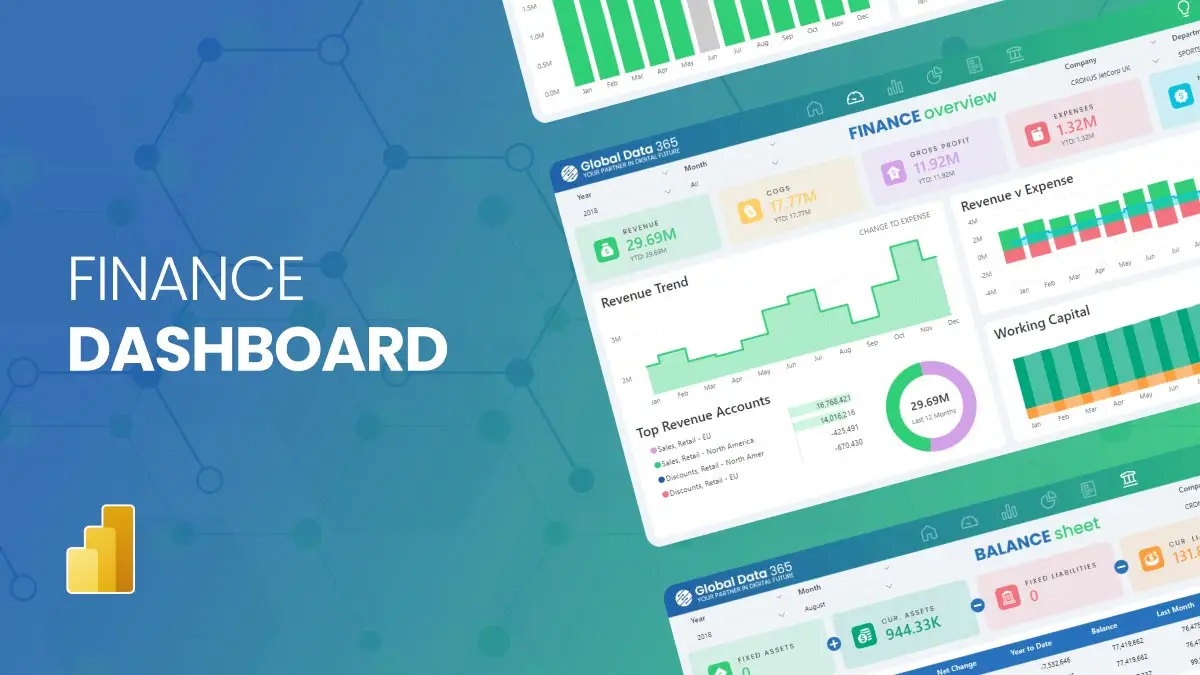
- Finance Dashboard: Gain in-depth insights into your financial operations, track key financial KPIs, and improve budgeting and forecasting accuracy.
- Inventory Dashboard: Track inventory levels, reduce waste, optimize stock levels, and improve inventory turnover rates with real-time data insights.
- Sales Dashboard: Get a comprehensive view of your sales data, identify high-performing products, and make strategic decisions to boost revenue.
- Purchases Dashboard: Manage purchasing activities, monitor supplier performance, and control procurement costs effectively.
- Retail Sales Dashboard: Analyze retail sales performance, track customer trends, and optimize inventory levels for maximum profitability.
- HR Dashboard: Track employee analysis, record payroll and recruitment for informed organizational decision-making.
Why Choose Our Dashboard Packs?
- Ready-to-Use: Get started quickly with pre-built dashboards tailored to your industry.
- Customizable: Easily adjust visualizations and data models to fit your specific needs.
- Comprehensive Insights: Access a wide range of metrics and KPIs for in-depth analysis.
- Expert Support: Benefit from our dedicated support team to help you get the most out of your dashboard packs.
Who Can Use it?
Although business intelligence products are usually the territory of business analysts and data scientists, Power BI’s user-friendly nature enables it to be used by a wide range of people within an organization. Power BI will build customized dashboards based on the data you want to see and the details you need.
It’s mainly used by business intelligence practitioners to build data models and reports that are then circulated to their company. It is frequently used as a self-service tool by different sections of the business to check on progress and gain insight into their team’s success. Not all companies, however, would have the scale or need to support a full-time data whiz, so it is frequently used as a self-service tool by various branches of the business to check on performance and gain insight into their team’s performance. Power BI will report on almost anything because it operates with whatever data you give it. Finance, Retail Sales, Inventory, Sales, and operations are among the divisions that use it the most.
Takeaway
Global Data 365 offers financial analytics solutions for the entire Microsoft Dynamics software products. We have been assisting business leaders in getting the knowledge they need effectively, reliably, and efficiently for almost 8+ years. We offer a wide range of Power BI Training Programs, if you want to learn it from beginner to advanced level. Get Consultation and choose the best training for you or your team, to revolutionize your reporting.
If you want to learn more about how Power BI can transform your business operations, we suggest learning more about the advantages of our quick but efficient reporting tools.
Register Now and Get 25% off on Power BI Training!
Search Blog
Related Resources

Power BI with Jet Analytics

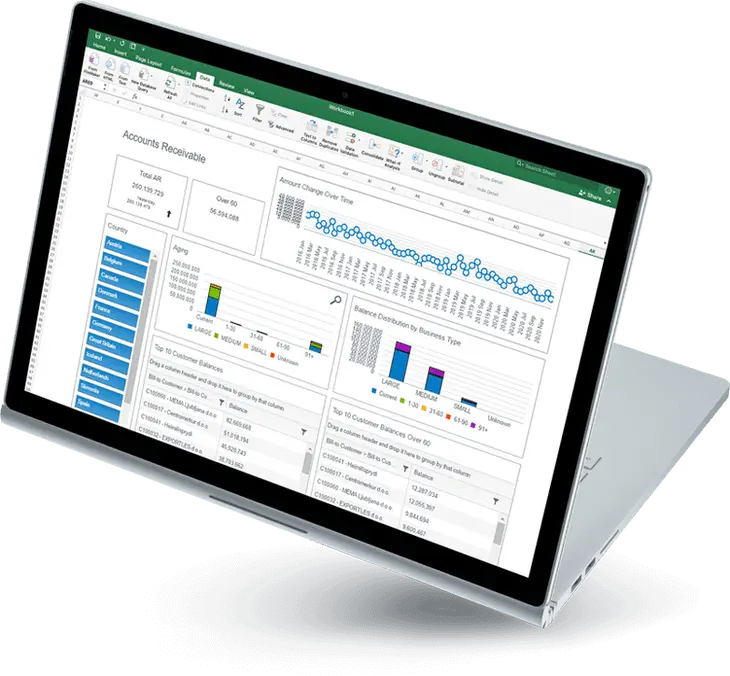
Why Power BI is a Better Choice than Excel for Analytics

Business Intelligence with Power BI: Unlock Data Insights
Interact Live with Dashboards
Boost efficiency with Power BI – now on 20% off!